CALL ON ➥8923113531 🔝Call Girls Gomti Nagar Lucknow best Night Fun service
Market research survey_results_(section_b)
1. Market Research Survey Results
The purpose of this market research survey was to collect primary data to help me make my
desicons on who im going to aim and design my music magazine for To construct the survey I used a
website called survey monkey; this is an easy way to creat questionnaires and collect the data to
analyse it.
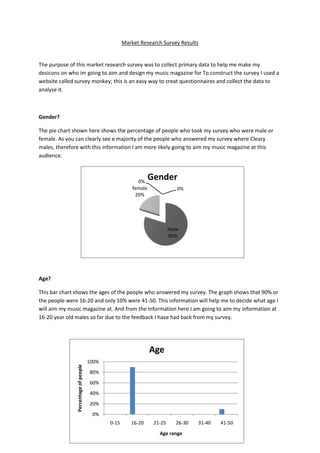
Gender?
The pie chart shown here shows the percentage of people who took my survey who were male or
female. As you can clearly see e majority of the people who answered my survey where Cleary
males, therefore with this information I am more likely going to aim my music magazine at this
audience.
Age?
This bar chart shows the ages of the people who answered my survey. The graph shows that 90% or
the people were 16-20 and only 10% were 41-50. This information will help me to decide what age I
will aim my music magazine at. And from the information here I am going to aim my information at
16-20 year old males so far due to the feedback I have had back from my survey.
Male
80%
female
20%
0%
0%
Gender
0%
20%
40%
60%
80%
100%
0-15 16-20 21-25 26-30 31-40 41-50
Percentageofpeople
Age range
Age
2. Education
90%
Occupation
10%
Education/Occupation
0% 0%0%
8%
33%
42%
17%
0%
What genre of music do you prefer?
Jazz
Heavy Metal
Pop
Rock
R'n'B
Indie/Alternative
Country
Eletronica
Education/Occupation
This pie chart shows the amount of people who are in education or work. From the results I can
clearly see that the high majority of the people who answered my survey are in education. Therefore
in my magazine I may have inserts that may relate to students. It also tells me that I should aim my
magazine at young students.
What genre of music do you prefer?
This pie chart shows the percentage of people who preferred each genre of music when taking my
survey. This will help me in deciding what type of music genre my music magazine will consist of.
From these results I am most likely going to have an RnB magazine or Indie genre of music.
What
3. 0%
1000%
2000%
3000%
4000%
5000%
6000%
7000%
I don tuse
internet sites
My Space YouTube Spotify
Percentageofpeople
Website
What website do you use as a music player?
Series 1
Column1
Series 3
10%
0%
30%
60%
Where do you buy your music?
Record shops
Order CD's/records online
iTunes
I burn or download from
the internet
website do you use as a music player?
This line graph shows the percentages of the people who completed my survey that use different
websites to listen to their music on. This may help me decided in the type of information my
magazine may consist of as I can now mention one rather spotify or YouTube on how to listen or
download music.
Where do you buy your music?
This pie chart shows the percentage of people who took my survey and the methods they use to
download their music. It is very clear to see that the majority of people who answered my survey
said, they burn music/download it off the internet therefore in my magazine I may try and
encourage people to buy music from ITunes or from a store or order it online as no one does this. It
may also help me as I can mention the top charts on ITunes etc. in my magazine.
What
do you
listen to
4. 0
20
40
60
Percentageofpeopls(%)
Music Player
What do you listen to your
music on?
Red and
white
10%
Red , white
and black
80%
Blue and
white
10%
Red, yellow
and white
0%
Sales
your music on?
This line graph shows the percentage of people and the method they use to listen to their music. It is
clear that the majority of people use the internet and there IPods to listen to music. This information
is useful as I can talk about these two things to appeal to a wider audience and entice people into
reading my music magazine.
What colour scheme do you prefer?
This pie chart shows the colour schemes I delivered on the survey and which was realized as most
popular with the recipients. It is clear to see that red, white and black was the most agreed colour
scheme. This data can support me through decision construction when coming to the finish on which
colour scheme to choose. I think choosing red, white and black will be the most appropriate for my
audience since it is the one they chose most so consequently would be a practical choice.
How often do you purchase a music magazine?
This bar chart shoes the percentage of people who buy a music magazine in a certain time period.
Rom tis graph it is clear to see that not many people read music magazines that often therefore,
5. 0
50
100
Every day Every week Every two
weeks
Every
month
I don't
percentageofpeople
Frequency
How often do you purchase a
music magazine?
Every day
60%
Once a week
10%
Once a month
10%
once every
three months
10%
Once or twice a
year
0%
Hardly
ever
10%
I don't
0%
How often do you normally actively
seek new music?
with this information I will try and make my music magazine as appealing as possible to try and get
more people to read music magazines.
How often do you normally actively seek new music?
These pie charts shows how often people actively seek new music. It is a mixed chart showing that
the majority of the people who took the survey looked for new music every day. This information
will help me decided on what to talk about in my music magazine therefor I am likely talk about new
bands and music