This document discusses parametric and nonparametric statistics, when each should be used, and their relative power. Parametric tests make assumptions about the population that may not always be justified, while nonparametric tests do not rely on these assumptions. Some key points:
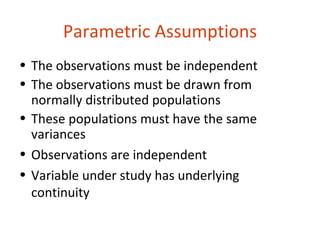
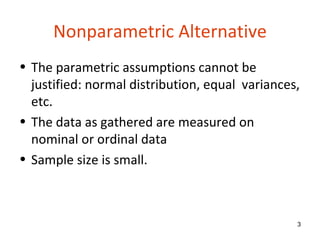
1. Parametric tests assume normal distributions and equal variances, while nonparametric tests do not require these assumptions and can be used on small sample sizes or ordinal data.
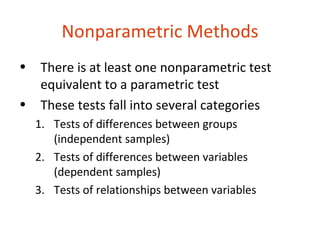
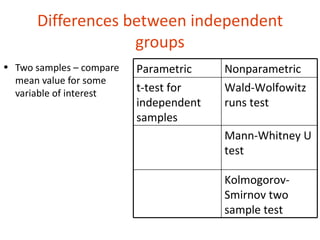
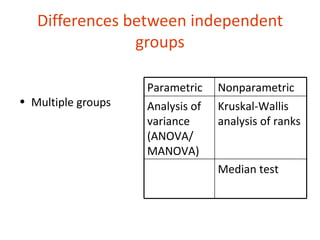
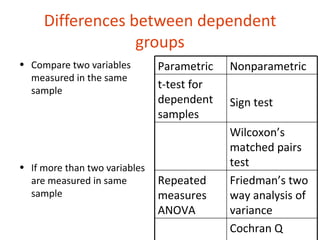
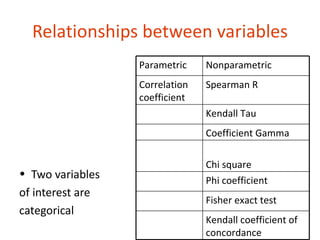
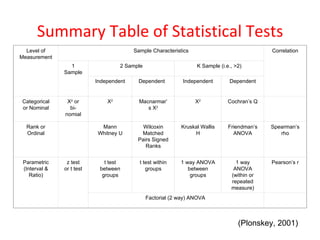
2. There are nonparametric equivalents to most common parametric tests for comparing groups (independent or dependent samples) or relationships between variables.
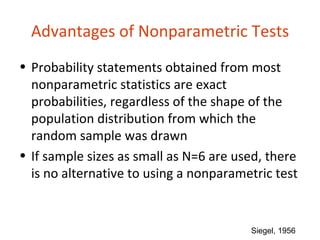
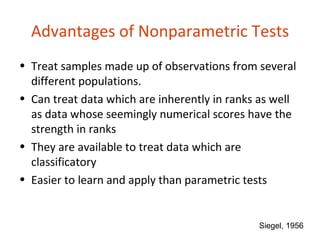
3. Advantages of nonparametric tests are they provide exact probabilities regardless of the population distribution and can