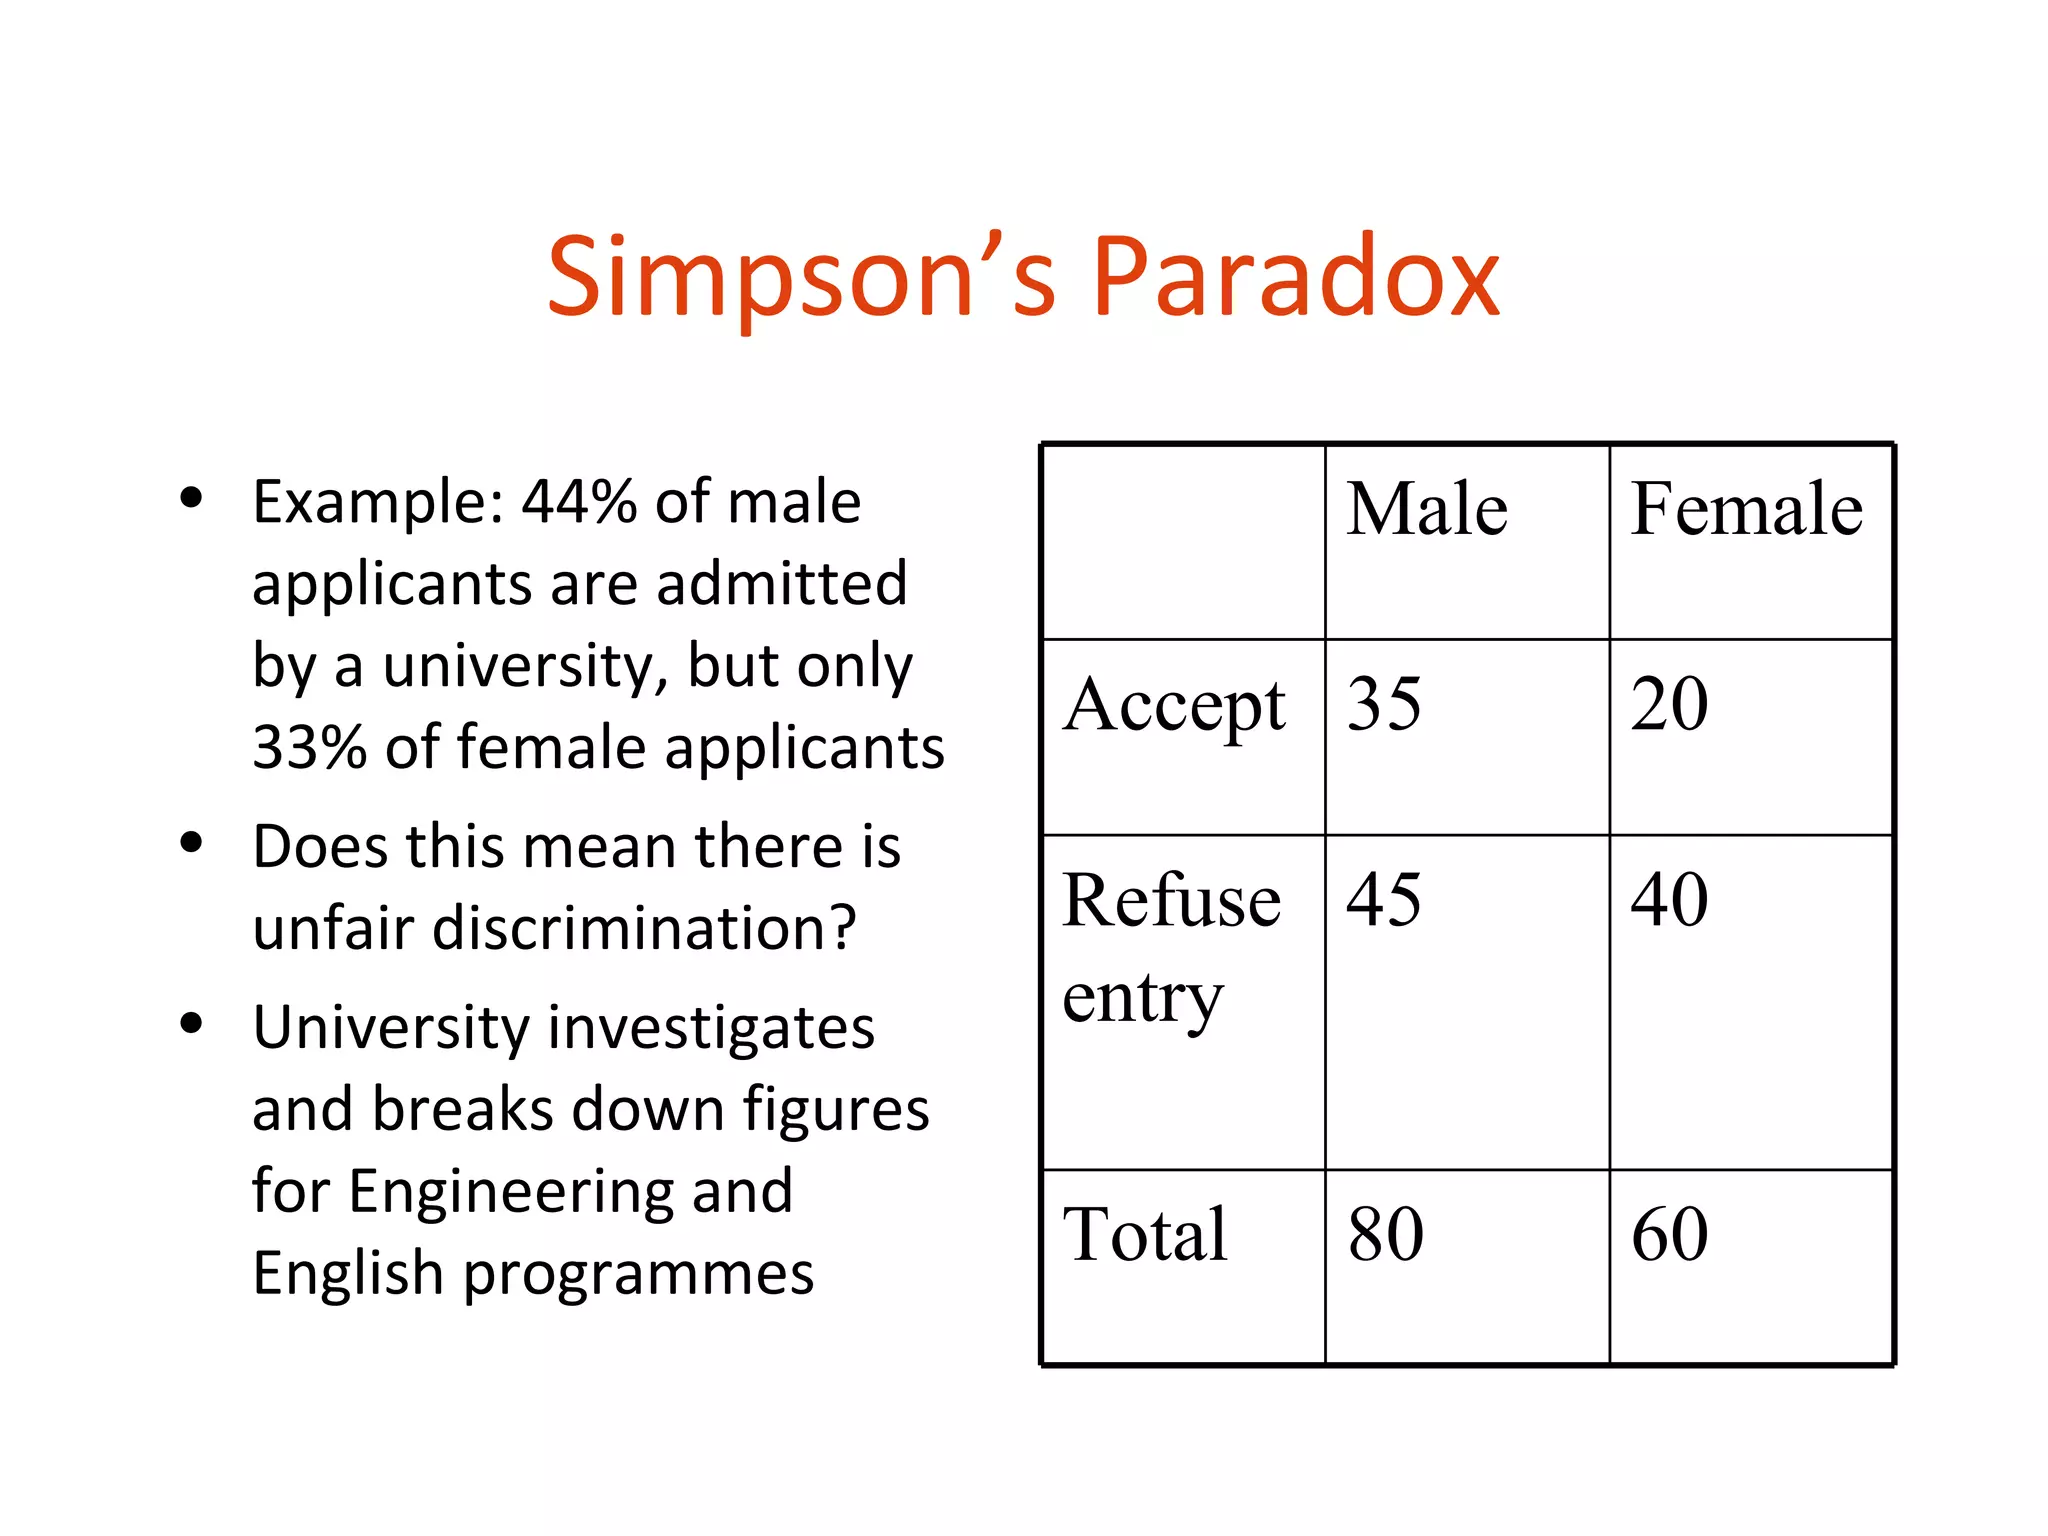
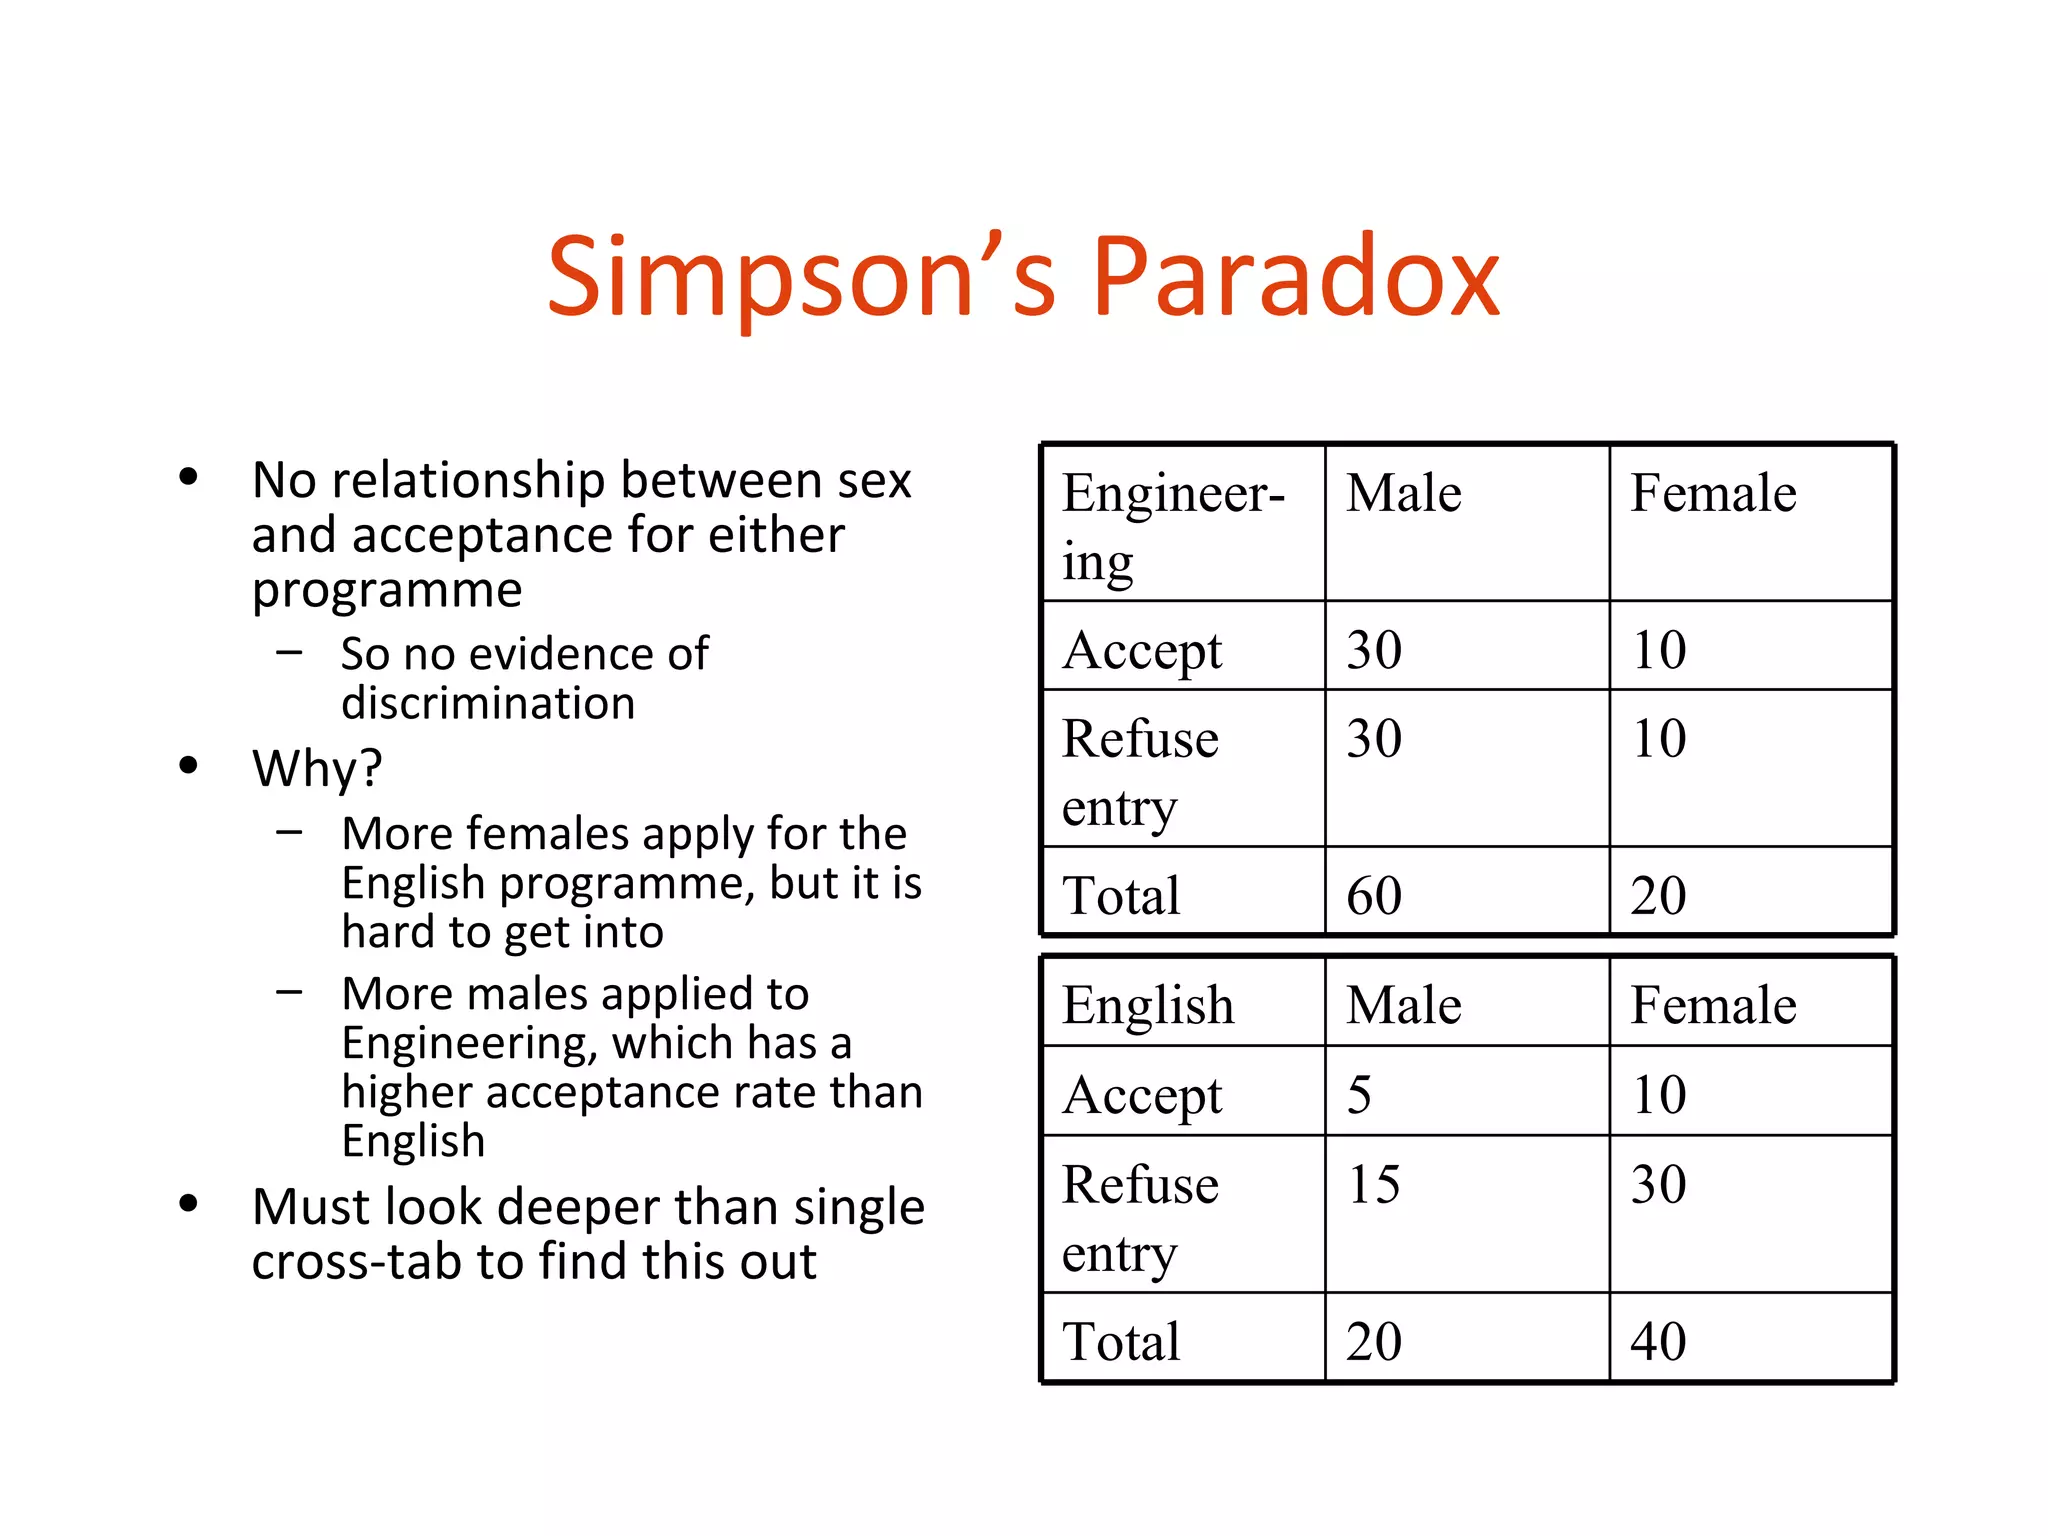
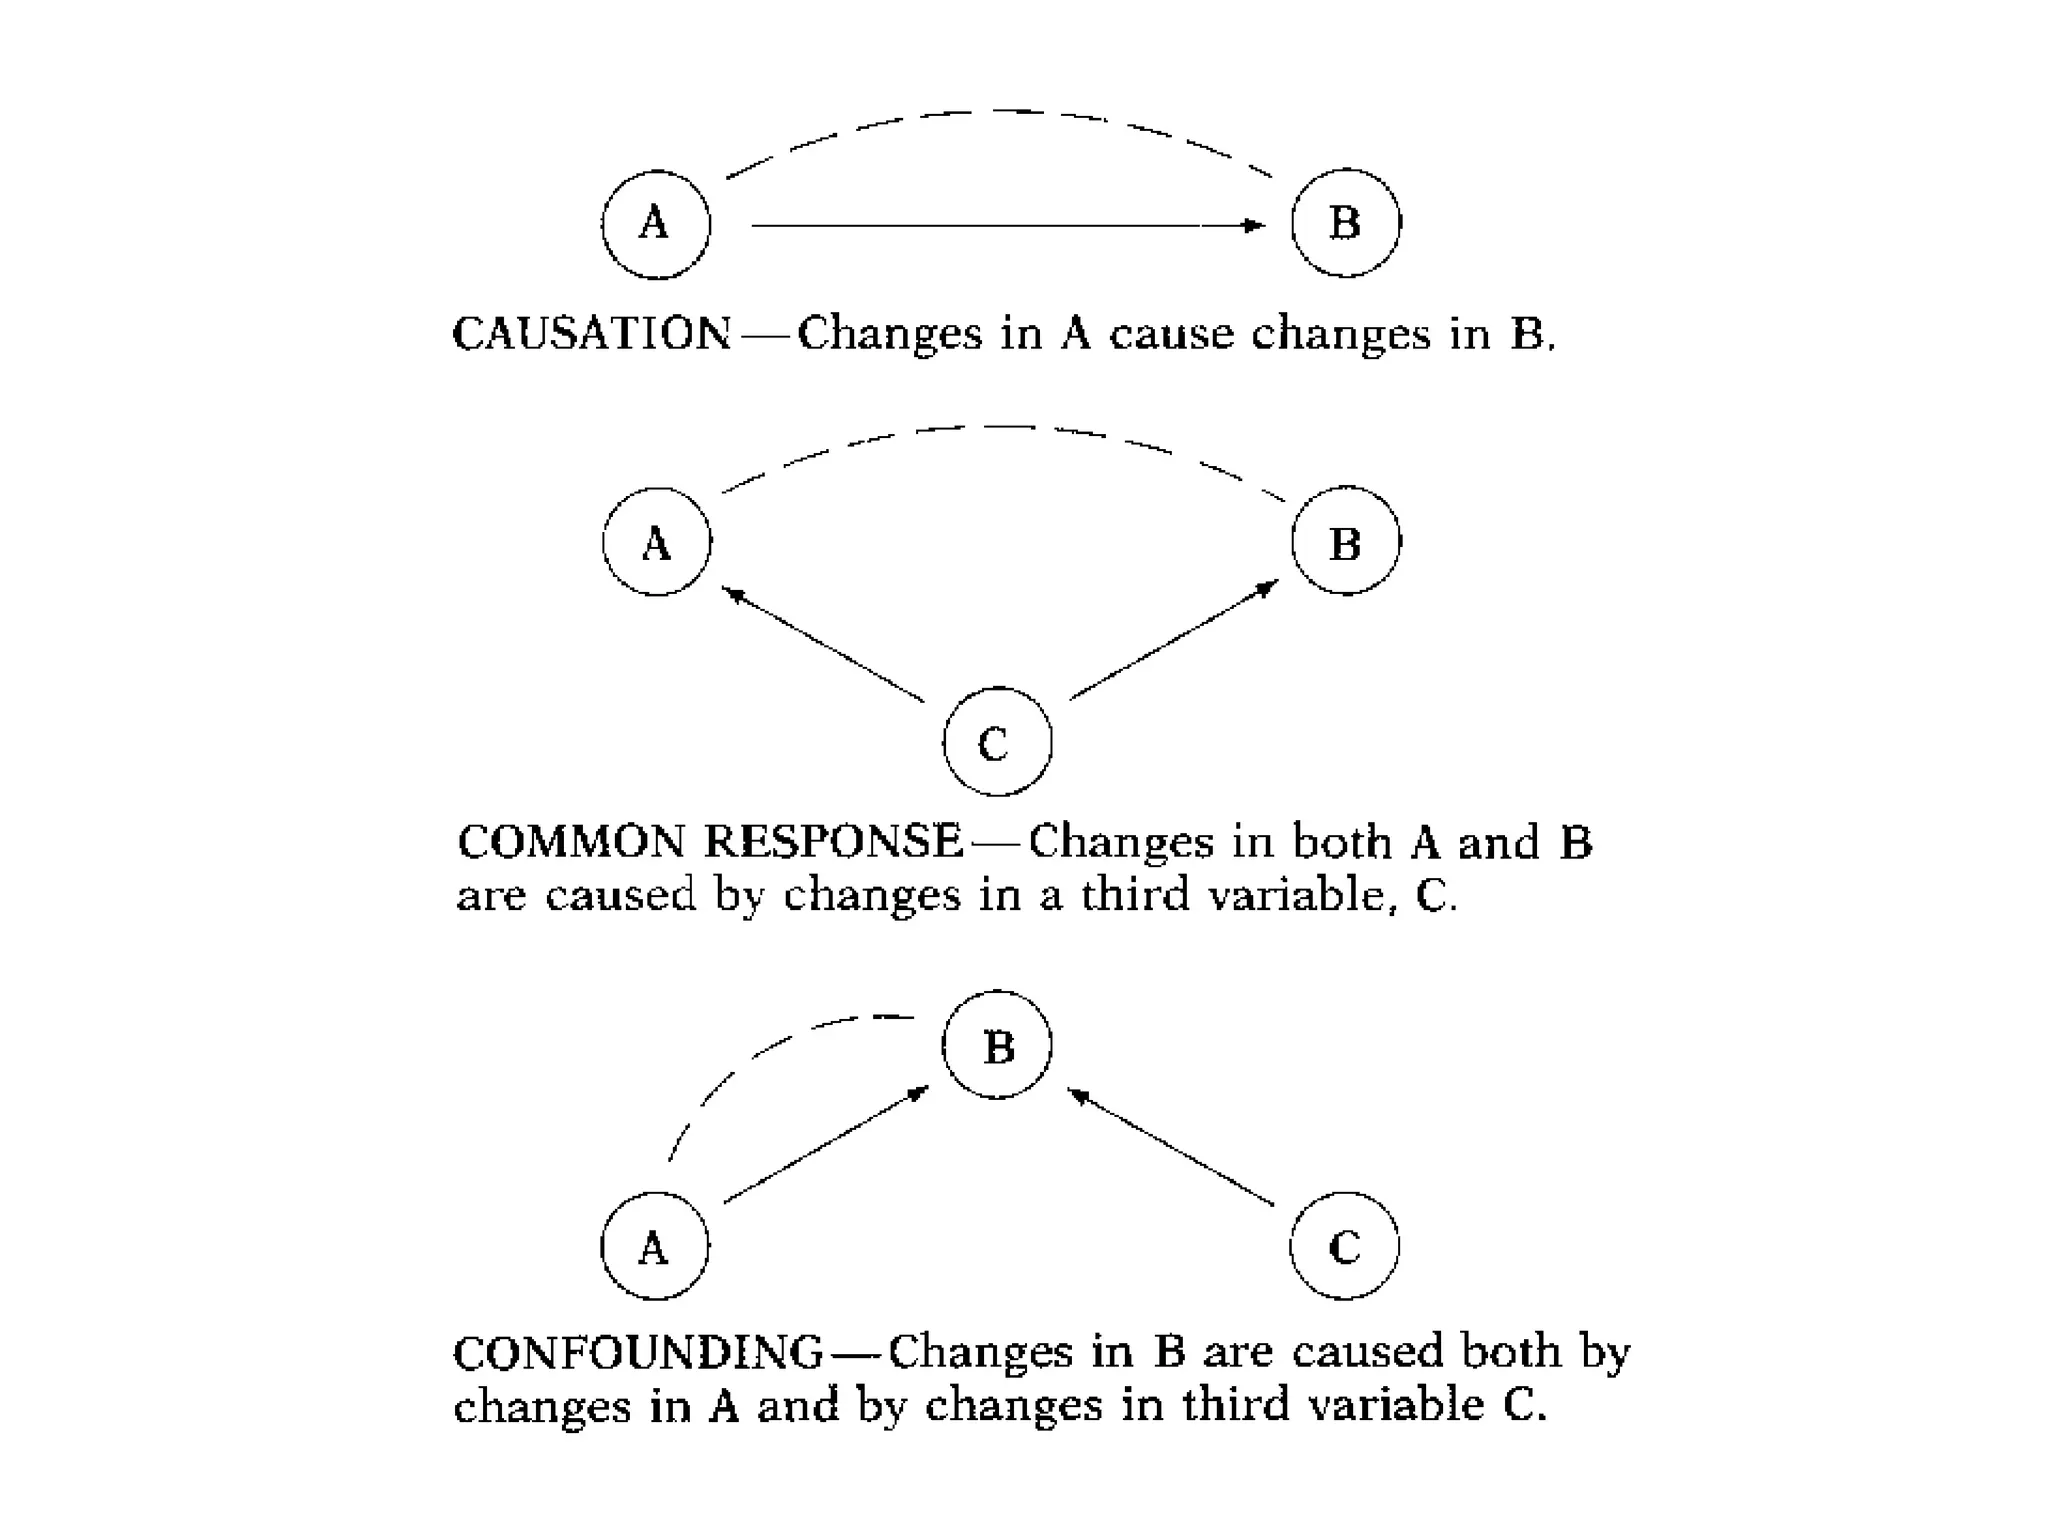
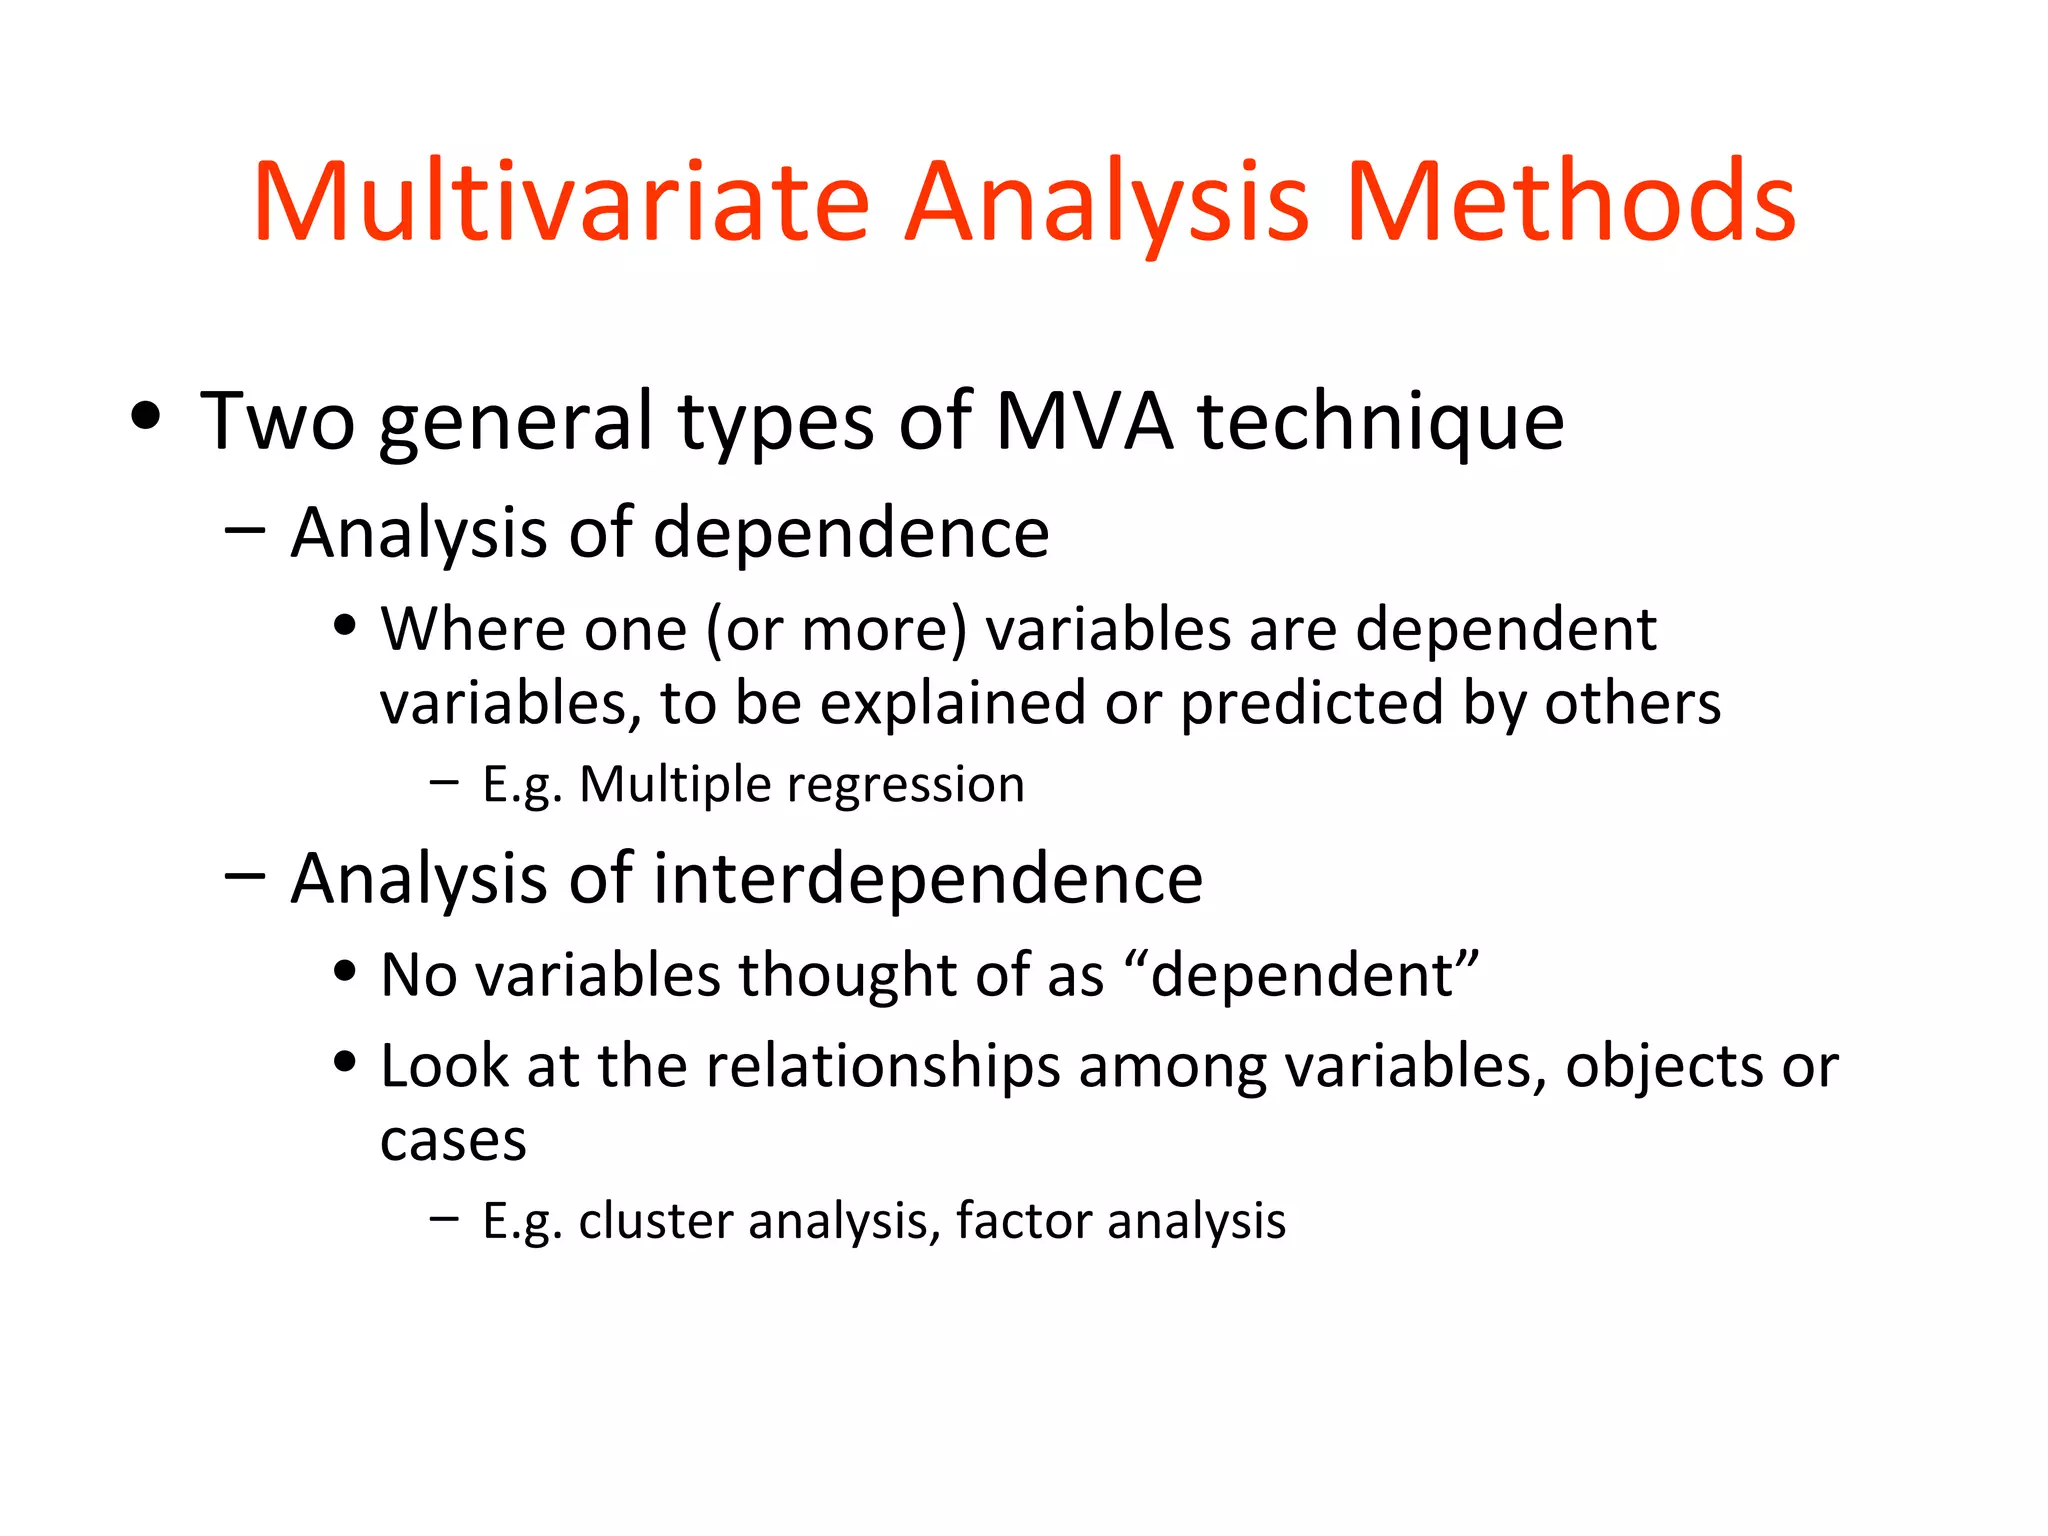
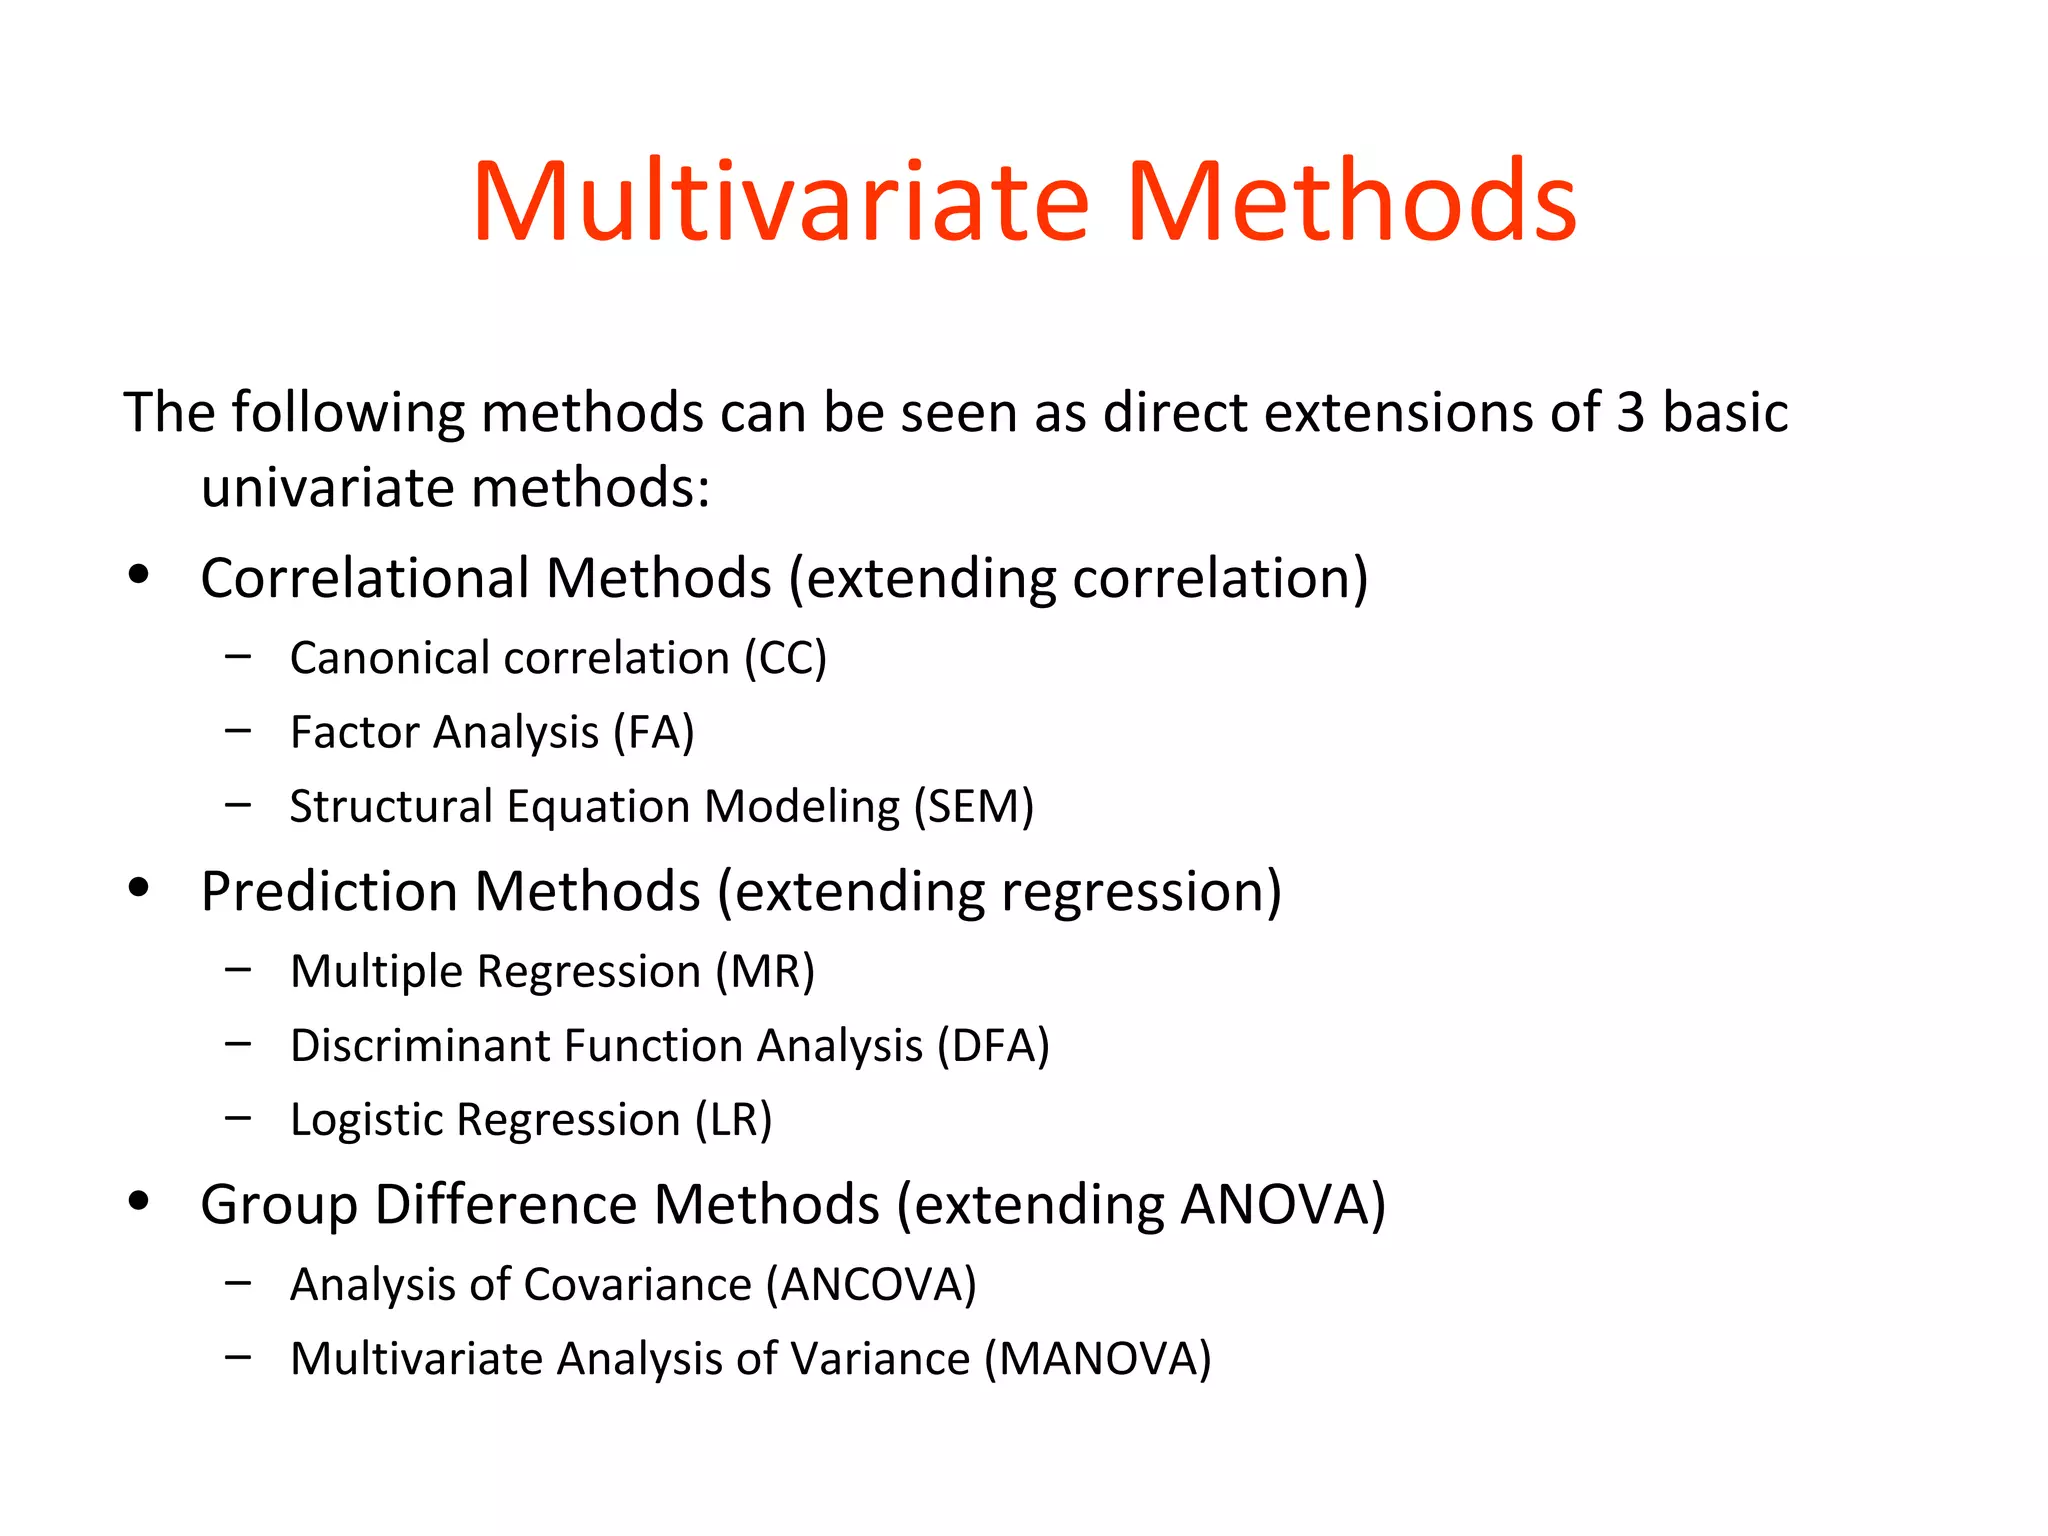
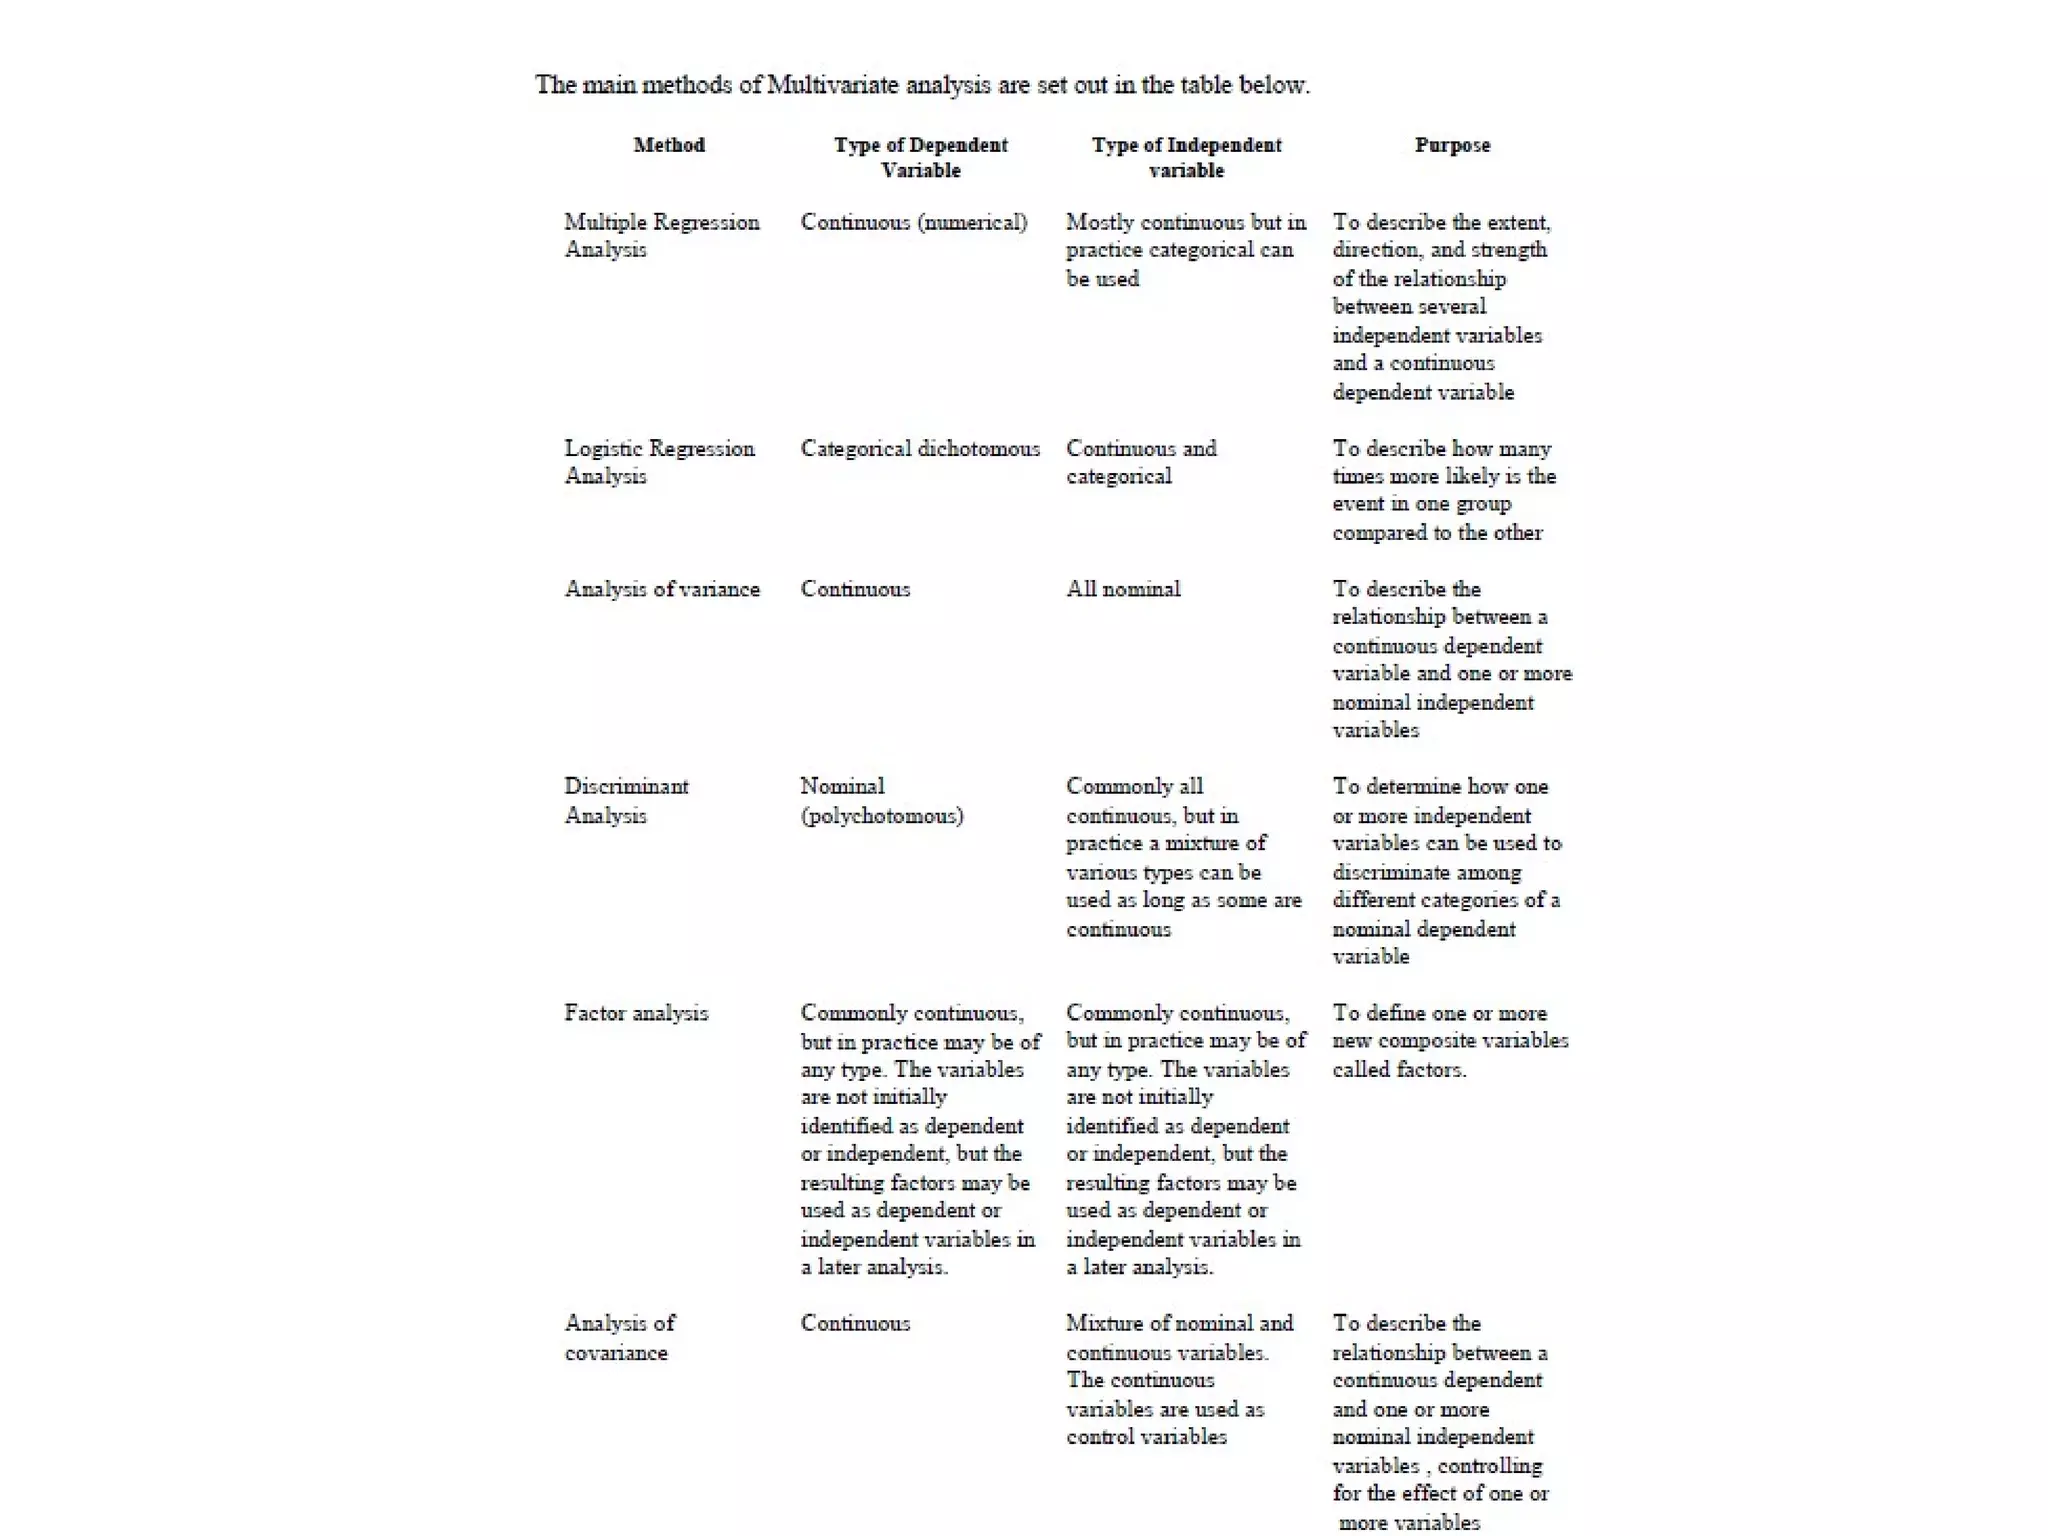
Parametric Tests


By Rama Krishna Kompella
Simpson’s Paradox
• Example: 44% of male                Male   Female
  applicants are admitted
  by a university, but only
  33% of female applicants
                              Accept 35      20
• Does this mean there is
  unfair discrimination?      Refuse 45      40
• University investigates     entry
  and breaks down figures
  for Engineering and
  English programmes          Total   80     60
Simpson’s Paradox
• No relationship between sex        Engineer-   Male   Female
  and acceptance for either          ing
  programme
    – So no evidence of              Accept      30     10
      discrimination
• Why?                               Refuse      30     10
    – More females apply for the     entry
      English programme, but it is   Total       60     20
      hard to get into
    – More males applied to          English     Male   Female
      Engineering, which has a
      higher acceptance rate than    Accept      5      10
      English
• Must look deeper than single       Refuse      15     30
  cross-tab to find this out         entry
                                     Total       20     40
Another Example
• A study of graduates’ salaries showed negative
  association between economists’ starting salary and
  the level of the degree
   – i.e. PhDs earned less than Masters degree holders, who in
     turn earned less than those with just a Bachelor’s degree
   – Why?
• The data was split into three employment sectors
   – Teaching, government and private industry
   – Each sector showed a positive relationship
   – Employer type was confounded with degree level
Simpson’s Paradox
• In each of these examples, the bivariate
  analysis (cross-tabulation or correlation) gave
  misleading results
• Introducing another variable gave a better
  understanding of the data
  – It even reversed the initial conclusions
Many Variables
• Commonly have many relevant variables in market
  research surveys
  – E.g. one not atypical survey had ~2000 variables
  – Typically researchers pore over many crosstabs
  – However it can be difficult to make sense of these, and the
    crosstabs may be misleading
• MVA can help summarise the data
  – E.g. factor analysis and segmentation based on agreement
    ratings on 20 attitude statements
• MVA can also reduce the chance of obtaining
  spurious results
Multivariate Analysis Methods
• Two general types of MVA technique
  – Analysis of dependence
     • Where one (or more) variables are dependent
       variables, to be explained or predicted by others
        – E.g. Multiple regression
  – Analysis of interdependence
     • No variables thought of as “dependent”
     • Look at the relationships among variables, objects or
       cases
        – E.g. cluster analysis, factor analysis
Multivariate Methods
The following methods can be seen as direct extensions of 3 basic
  univariate methods:
• Correlational Methods (extending correlation)
   – Canonical correlation (CC)
   – Factor Analysis (FA)
   – Structural Equation Modeling (SEM)
• Prediction Methods (extending regression)
   – Multiple Regression (MR)
   – Discriminant Function Analysis (DFA)
   – Logistic Regression (LR)
• Group Difference Methods (extending ANOVA)
   – Analysis of Covariance (ANCOVA)
   – Multivariate Analysis of Variance (MANOVA)
Questions?

T13 parametric tests

  • 1.
    Parametric Tests By RamaKrishna Kompella
  • 2.
    Simpson’s Paradox • Example:44% of male Male Female applicants are admitted by a university, but only 33% of female applicants Accept 35 20 • Does this mean there is unfair discrimination? Refuse 45 40 • University investigates entry and breaks down figures for Engineering and English programmes Total 80 60
  • 3.
    Simpson’s Paradox • Norelationship between sex Engineer- Male Female and acceptance for either ing programme – So no evidence of Accept 30 10 discrimination • Why? Refuse 30 10 – More females apply for the entry English programme, but it is Total 60 20 hard to get into – More males applied to English Male Female Engineering, which has a higher acceptance rate than Accept 5 10 English • Must look deeper than single Refuse 15 30 cross-tab to find this out entry Total 20 40
  • 4.
    Another Example • Astudy of graduates’ salaries showed negative association between economists’ starting salary and the level of the degree – i.e. PhDs earned less than Masters degree holders, who in turn earned less than those with just a Bachelor’s degree – Why? • The data was split into three employment sectors – Teaching, government and private industry – Each sector showed a positive relationship – Employer type was confounded with degree level
  • 6.
    Simpson’s Paradox • Ineach of these examples, the bivariate analysis (cross-tabulation or correlation) gave misleading results • Introducing another variable gave a better understanding of the data – It even reversed the initial conclusions
  • 7.
    Many Variables • Commonlyhave many relevant variables in market research surveys – E.g. one not atypical survey had ~2000 variables – Typically researchers pore over many crosstabs – However it can be difficult to make sense of these, and the crosstabs may be misleading • MVA can help summarise the data – E.g. factor analysis and segmentation based on agreement ratings on 20 attitude statements • MVA can also reduce the chance of obtaining spurious results
  • 8.
    Multivariate Analysis Methods •Two general types of MVA technique – Analysis of dependence • Where one (or more) variables are dependent variables, to be explained or predicted by others – E.g. Multiple regression – Analysis of interdependence • No variables thought of as “dependent” • Look at the relationships among variables, objects or cases – E.g. cluster analysis, factor analysis
  • 9.
    Multivariate Methods The followingmethods can be seen as direct extensions of 3 basic univariate methods: • Correlational Methods (extending correlation) – Canonical correlation (CC) – Factor Analysis (FA) – Structural Equation Modeling (SEM) • Prediction Methods (extending regression) – Multiple Regression (MR) – Discriminant Function Analysis (DFA) – Logistic Regression (LR) • Group Difference Methods (extending ANOVA) – Analysis of Covariance (ANCOVA) – Multivariate Analysis of Variance (MANOVA)
  • 11.