Dynamic Analysis of Bridge with different spans of bridge piers applying pushover
•
0 likes•4 views

https://www.irjet.net/archives/V10/i1/IRJET-V10I132.pdf

Recommended
Recommended
More Related Content
Similar to Dynamic Analysis of Bridge with different spans of bridge piers applying pushover
Similar to Dynamic Analysis of Bridge with different spans of bridge piers applying pushover (20)
More from IRJET Journal
More from IRJET Journal (20)
Recently uploaded
Recently uploaded (20)
Dynamic Analysis of Bridge with different spans of bridge piers applying pushover
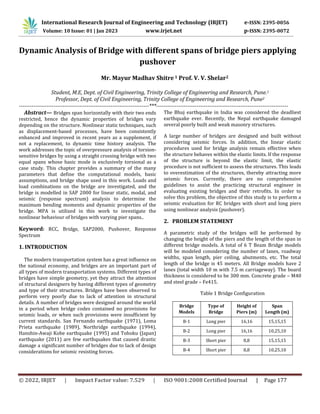
- 1. © 2022, IRJET | Impact Factor value: 7.529 | ISO 9001:2008 Certified Journal | Page 177 Dynamic Analysis of Bridge with different spans of bridge piers applying pushover Mr. Mayur Madhav Shitre 1 Prof. V. V. Shelar2 Student, M.E, Dept. of Civil Engineering, Trinity College of Engineering and Research, Pune.1 Professor, Dept. of Civil Engineering, Trinity College of Engineering and Research, Pune2 -----------------------------------------------------------------------***------------------------------------------------------------------------ Abstract— Bridges span horizontally with their two ends restricted, hence the dynamic properties of bridges vary depending on the structure. Nonlinear static techniques, such as displacement-based processes, have been consistently enhanced and improved in recent years as a supplement, if not a replacement, to dynamic time history analysis. The work addresses the topic of overpressure analysis of torsion- sensitive bridges by using a straight crossing bridge with two equal spans whose basic mode is exclusively torsional as a case study. This chapter provides a summary of the many parameters that define the computational models, basic assumptions, and bridge shape used in this work. Loads and load combinations on the bridge are investigated, and the bridge is modelled in SAP 2000 for linear static, modal, and seismic (response spectrum) analysis to determine the maximum bending moments and dynamic properties of the bridge. MPA is utilized in this work to investigate the nonlinear behaviour of bridges with varying pier spans.. Keyword: RCC, Bridge, SAP2000, Pushover, Response Spectrum 1. INTRODUCTION The modern transportation system has a great influence on the national economy, and bridges are an important part of all types of modern transportation systems. Different types of bridges have simple geometry, yet they attract the attention of structural designers by having different types of geometry and type of their structures. Bridges have been observed to perform very poorly due to lack of attention in structural details. A number of bridges were designed around the world in a period when bridge codes contained no provisions for seismic loads, or when such provisions were insufficient by current standards. San Fernando earthquake (1971), Loma Prieta earthquake (1989), Northridge earthquake (1994), Hanshin-Awaji Kobe earthquake (1995) and Tohoku (Japan) earthquake (2011) are few earthquakes that caused drastic damage a significant number of bridges due to lack of design considerations for seismic resisting forces. The Bhuj earthquake in India was considered the deadliest earthquake ever. Recently, the Nepal earthquake damaged several poorly built and weak masonry structures. A large number of bridges are designed and built without considering seismic forces. In addition, the linear elastic procedures used for bridge analysis remain effective when the structure behaves within the elastic limits. If the response of the structure is beyond the elastic limit, the elastic procedure is not sufficient to assess the structures. This leads to overestimation of the structures, thereby attracting more seismic forces. Currently, there are no comprehensive guidelines to assist the practicing structural engineer in evaluating existing bridges and their retrofits. In order to solve this problem, the objective of this study is to perform a seismic evaluation for RC bridges with short and long piers using nonlinear analysis (pushover). 2. PROBLEM STATEMENT A parametric study of the bridges will be performed by changing the height of the piers and the length of the span in different bridge models. A total of 6 T Beam Bridge models will be modeled considering the number of lanes, roadway widths, span length, pier ceiling, abutments, etc. The total length of the bridge is 45 meters. All Bridge models have 2 lanes (total width 10 m with 7.5 m carriageway). The board thickness is considered to be 300 mm. Concrete grade – M40 and steel grade – Fe415. Table 1 Bridge Configuration Bridge Models Type of Bridge Height of Piers (m) Span Length (m) B-1 Long pier 16,16 15,15,15 B-2 Long pier 16,16 10,25,10 B-3 Short pier 8,8 15,15,15 B-4 Short pier 8,8 10,25,10 International Research Journal of Engineering and Technology (IRJET) e-ISSN: 2395-0056 Volume: 10 Issue: 01 | Jan 2023 www.irjet.net p-ISSN: 2395-0072
- 2. © 2022, IRJET | Impact Factor value: 7.529 | ISO 9001:2008 Certified Journal | Page 178 Seismic Zone – Zone 4 (Seismic Coeff. Factor = 0.24) Poisson’s ratio – 0.2 Type of soil – Medium Importance Factor – 1 Response Reduction Factor – 5 Damping of Structure – 5% Clear width of roadway = 7.5mSpan of the bridge =16m Average thickness of the wearing coat = 80mmGrade of concrete= M25 Grade of steel =Fe415 3. MODELING AND RESULTS Fig. 1. Model B1 Fig. 2. Model B2 Fig. 3. Model B3 Fig. 4. Model B4 A. Time Period Table 2. Time Period (SPAN 15, 15, 15) SPAN 15, 15, 15 Mode Long bridge pier (B1) Short bridge pier (B3) 1 0.439 0.296 2 0.376 0.261 3 0.287 0.203 4 0.266 0.188 5 0.265 0.187 6 0.22 0.155 Graph. 1. Time Period: Span 15, 15, 15 As we can see in the above chart, it shows approximately span time period of 15, 15, 15 for long bridge pillar (B1), short bridge pillar (B2). The maximum time period shows for the long bridge pier (B1) and the minimum results for the short pier. International Research Journal of Engineering and Technology (IRJET) e-ISSN: 2395-0056 Volume: 10 Issue: 01 | Jan 2023 www.irjet.net p-ISSN: 2395-0072
- 3. © 2022, IRJET | Impact Factor value: 7.529 | ISO 9001:2008 Certified Journal | Page 179 Table 3. Time Period (SPAN 10, 25, 10) SPAN 10, 25, 10 Mode Long bridge pier (B1) Short bridge pier (B3) 1 0.547 0.529 2 0.334 0.334 3 0.2 0.195 4 0.15 0.15 5 0.131 0.129 6 0.119 0.118 Graph. 2. Time Period: Span 10, 25, 10 As we can see in the above chart, it shows approximately span time period 10, 25, 10 for long bridge pillar (B2), short bridge pillar (B4). Almost all bridges report results for the same time period. B. Pushover Fig 5 Frame hinge property data Fig 6 Model B1: Push-over curve Fig 7 Model B2: Push-over curve Fig 8 Model B3: Push-over curve Fig 9 Model B4: Push-over curve International Research Journal of Engineering and Technology (IRJET) e-ISSN: 2395-0056 Volume: 10 Issue: 01 | Jan 2023 www.irjet.net p-ISSN: 2395-0072
- 4. © 2022, IRJET | Impact Factor value: 7.529 | ISO 9001:2008 Certified Journal | Page 180 Table 4. Performance Point Performance Point SPAN 15, 15, 15 SPAN 10, 25, 10 Long bridge pier (B1) Short bridge pier (B3) Long bridge pier (B2) Short bridge pier (B4) 7305 7293 7002 6976 Graph. 3. Performance Point 4. CONCLUSION A parametric study of bridges performed by varying pier height and span length in various bridge models. A total of 6 T Beam Bridge models with bearing and design of the bridge and bearings are analysed. A total of six models of the bridge model are considered with equal and unequal spans and pier heights and analyse these modes in FEM software SAP2000 for various seismic analysis methods such as response spectrum, time history analysis, etc. to investigate and measure the performance of the bridge. bridge with different span and pier condition, the analysis concluded that short pier height models are economical than unequal and long pier model in comparison, but compared to unequal pier models, they have equivalent results with short pier model, so bridge with unequal span and pier conditions are recommended for seismic design purposes, all final conclusions are made from the following results. In the seismic coefficient method, the time period and the natural frequency of the bridge are compared, compared to the time period results for equal and unequal spans, the long span piers having a longer period than the Short and Irregular piers, the differences in the time period of the Short and Irregular piers are around 15-20%. In the Push-over analysis method, the bridge's sliding capacity is compared with the results of the sliding capacities of the piers. The sliding capacity is greater than all other models, the difference is around 15-20%. 5. REFRENCES [1] Ranjit S. Abeysinghe, EvgeniaGavaise, Marco Rosignoli, and TheodorosTzaveas, “PUSHOVER ANALYSIS OF INELASTIC SEISMIC BEHAVIOR OF [2] GREVENIOTIKOS BRIDGE”, American Society of Civil Engineers (ASCE), August 2002 [3] Mohammad Farhan and MohdTasleem, “PUSHOVER ANALYSIS OF REINFORCED [4] CONCRETE BRIDGE PIER DESIGNED AS PER IRC-6 CODAL PROVISION”, [5] Journal of Civil & Environmental Engineering, August 2020 [6] AmitKatkar, P. M. Kulkarni, “PARAMETRIC STUDY OF BRIDGE PIERS”, [7] International Research Journal of Engineering and Technology (IRJET), Jan 2018 [8] NileshShadunkey, RashmiSakalle, “COMPARATIVE STUDY OF EFFECT OF [9] VARYING SPAN LENGTH ON MAJOR ELEMENTS OF METRO BRIDGE”, [10] International Research Journal of Engineering and Technology (IRJET), Sept. 2019 [12] Freedom Estimate of Displacement for Pushover Analysis of Buildings.” J. Struct. Eng., 129(4), 459– 469. [13] IS 1893 (Part 1)–2002, “Indian Standard Criteria for Earthquake Resistant Design of Structures, Part 1: General Provision and Buildings”, Bureau of Indian Standards, New Delhi. IS CODES: i. IS 456 : 2000 -Plain and Reinforced Concrete Code of Practice. - BUREAU OF INDIAN STANDARDS, NEW DELHI. ii. IS 1893 : 2000 - Criteria For Earthquake Resistant Design Of Structures International Research Journal of Engineering and Technology (IRJET) e-ISSN: 2395-0056 Volume: 10 Issue: 01 | Jan 2023 www.irjet.net p-ISSN: 2395-0072 [11] Chopra, A., Goel, R., and Chintanapakdee, C. (2003). ”Statistics of Single-Degree-of-