Delineating Sphere of Urban Influence: The Case of Three Early Urban Centres of Eastern India
•
2 likes•395 views

The document discusses delineating the sphere of urban influence of three early urban centers in Eastern India - Tamluk, Contai, and Midnapore. It analyzes their hierarchical growth and influence over time as regional economic and administrative hubs from ancient dynasties to the present. Population and area data from 2001-2011 show that Tamluk experienced the highest annual population growth at 4.25% as it became the new district headquarters in 2001, doubling its area. Contai's annual population and area growth were nearly identical at 1.9% and 2.11%. While population increased for all three cities, their rates of population versus area growth differed. The document aims to model their spheres of influence based on socioeconomic

Recommended
Recommended
More Related Content
What's hot
What's hot (20)
Viewers also liked
Viewers also liked (18)
Similar to Delineating Sphere of Urban Influence: The Case of Three Early Urban Centres of Eastern India
Similar to Delineating Sphere of Urban Influence: The Case of Three Early Urban Centres of Eastern India (20)
More from iosrjce
More from iosrjce (20)
Recently uploaded
Recently uploaded (20)
Delineating Sphere of Urban Influence: The Case of Three Early Urban Centres of Eastern India
- 1. IOSR Journal Of Humanities And Social Science (IOSR-JHSS) Volume 20, Issue 11, Ver. IV (Nov. 2015) PP 91-100 e-ISSN: 2279-0837, p-ISSN: 2279-0845. www.iosrjournals.org DOI: 10.9790/0837-2011491100 www.iosrjournals.org 91 | Page Delineating Sphere of Urban Influence: The Case of Three Early Urban Centres of Eastern India Koushik Mandal1 , Soumendu Chatterjee2 & Nilanjana Das Chatterjee³ 1 Department of Geography and Environment Management, Vidyasagar University, India 2 Department of Geography, Presidency University, India ³Department of Geography and Environment Management, Vidyasagar University, India Abstract: Urbanization and regional development are intimately allied. Higher and lower order facilities and specialization of activities influence urban growth which diffuses its benefit to the surrounding countryside. Subsequently, socio-economic development of the region comes into being. Optimum level of growth of an urban centre depends on the capacity to provide required facilities to the people. Hierarchical growth of urban centre in association with the location of civic amenities induces regional development in hierarchical dimension. In case of Eastern India, few of the urban centres are having large number of facilities while others are lacking in correspondence to their population size. Formulation of pragmatic planning model is the rescue of wiping out such problems. The present treatise is a humble effort to analyze the hierarchical growth and influence of the three early urban centres (Tamluk, Contai and Midnapore) of Southern Bengal and in Eastern India as well. It seeks to explain how the urban centres of historical importance have evolved and continues to evolve in a hierarchical framework of functional weightage and how the geography of their spheres of influence are changing in relation to the transformation of economic and political regime since their origin through the dynasties like Mauraya, Kalinga, Gupta, Afghan, Mughal, Portuguese, Dutch, French, British etc. Further, it recommends a model, for the historical urban area to analyze the problem of regional variation in development. Besides, it looks at the adequacy and inadequacy of facilities in the urban centres and put forward planning recommendations, so that a balanced regional development would be achieved. Keywords: Functional weightage, Hierarchical growth, Regional development, Sphere of influence I. Introduction Urban spheres of influence reflect centre-to-hinterland relationship, compared with the non-central region, the centre assumes more complex economic functions, and provides more economic activities. Famous theoretical contributions to this research field are the Central Place Theory (Christaller, 1933), the extension to the Central Place Theory (Losch, 1940), the modification to the Central Place Theory (Isard, 1956), and An Economic Theory of Central Places (Eaton et al.,1982). After verification and conceptual refinement of these classical literatures, it can be found that any study on delineating sphere of urban influence has been guided by either of two research approaches: the empirical research and model research. Empirical method determines sphere of urban influence according to data features and regional characteristics. As for example, sphere of urban influence in America is described in terms of the extent of the regional delivery system (Huff, 1973). Models are developed to capture the interaction between or spaces using theoretical understanding, the intensity and pattern of contact among cities, and thus those models help to determine the sphere of urban influence. In modeling, the sphere of urban influence, Huff (1973) and Lutz (1995) made a great contribution by using a model namely “Sphere of Urban Influence and Urban System” to delineate the urban sphere of influence of United States of America, Ireland and Ghana. Now-a-days in Western countries, the study of sphere urban of influence is diminishing in general. By virtue of their high degree of economic and social development, most of the developed countries have accessed post-industrial society, where node-to-node interactions have become, as compared to the node-to-hinterland relationships. But, for the developing countries, they are still pursuing industrial development and hence, develop the industries; the node-to-hinterland relationships are distinctly dominant. Recently the studies of spheres urban of influence of industrial cities are assuming international academic interest (Wang et al., 2001 & Liang, 2008). The present study is a humble attempt to analyze the socio-economic facilities by total population and composite functional score, and to delineate the sphere of urban influence. II. Data base and Methodology 2.1 Data Source Data are mainly obtained from the District Census Handbook 2001, 2011 (Office of the Director of Census Operation, W.B. IB-199, Sector-III, Salt Lake City, Kolkata-700106). Other data sources include
- 2. Delineating Sphere of Urban Influence: The Case of Three Early Urban Centres of Eastern India DOI: 10.9790/0837-2011491100 www.iosrjournals.org 92 | Page District Statistical Handbook 2001, 2011 of Purba and Paschim Medinipur District (Bureau of Applied Economics and Statistics, Government of West Bengal), Economic Review 2001-02, 2011-12 (Department of Statistics and Programme Implementation, Government of West Bengal), Statistical Abstarct of Purba and Paschim Medinipur (Bureau of Applied Economics and Statistics, Government of West Bengal). When necessary, synthesis of data is performed. 2.2 Methodology 2.2.1 Projection for Urban Population A) Annual growth rates of population in percentage have been estimated using following equation: r = (P2 – P1)/10 Where, P1 and P2 are the population of urban area in two census enumerations at 10 years of interval and r = Growth B) The annual growth rate of population for each urban centre is used in the following equation to derive projected population assuming Arithmetic growth: PP = P1 + (r × t) Where, PP = projected population, P1 = population of base year and t = time interval between the base year and the year of which projected population would be estimated. 2.2.2 Delineating Sphere of Urban Influence The zone of urban influence is estimated through the following four steps. A) Mean Population Threshold for a particular category of facility is the ratio between total population and number of facilities belonging to the category. (Haggett and Gunwardena, 1965) This can be expressed as: mT = P/NFi Where, mT = mean population threshold, P = total population, and NFi = total number of facilities under functional category „i‟. B) Mean Population Threshold (mT) value for each facility type available in a geographical unit (district, urban centre etc.) is employed in the following equation to derive the Functional Weightage of the facility category (Bhatt, 1976): WFi = mTi / mTl Where, WFi = estimated weightage of facility „i‟, mTi = mean population threshold of facility „i‟, and mTl = lowest mean population threshold. C) The WFi values for all facilities are summed up to derive Composite Functional Score of a geographical unit, which is given by: n CFs = ∑WFi i=1 Where, CFs = Composite Functional score, n= number of facilities and i=1. Thus Composite Functional Score for Purba and Paschim Medinipur as a combined district and for each of the urban centres under examination are computed. D) Now the Proportional Composite Functional Score of an urban centre with respect to that of the district is multiplied by the area of the district to receive Sphere of Urban Influence for the urban centre in question (V.L.S. Prakash Rao, 1964): CFs Urban centre S.I. = ×A District CFs District Where, S.I. = Sphere of Urban Influence (sq. km.), CFs Urban centre = Composite Functional Score of Urban Centre, CFs District = Composite Functional Score of District and A District = Area of district.
- 3. Delineating Sphere of Urban Influence: The Case of Three Early Urban Centres of Eastern India DOI: 10.9790/0837-2011491100 www.iosrjournals.org 93 | Page III. Study Area Fig.1 study area at a glance Tamluk is the headquarters of Tamluk sub-division (O‟Malley, 1911), situated on the north bank of river Rupnarayana, 16 miles south west from Panskura railway station and with which it is also connected by road (Majumdar, 1971). Tamluk came into being about 1500 to 2000 years B.P. and at that time it was characterized by marshy land topography, halophytic plants and salt marshes (Majumdar, 1971). The low lying marshy area was filled up by depositional reworking of the rivers Hoogly and Rupnarayana. Thus, the area came into existence as an elevated land surface where port activities began to be carried out. By 700 B.C., Tamluk became a renowned port (O‟Malley, 1911). But after the eighth century A.D., due to downfall of the port,
- 4. Delineating Sphere of Urban Influence: The Case of Three Early Urban Centres of Eastern India DOI: 10.9790/0837-2011491100 www.iosrjournals.org 94 | Page Tamralipta lost its importance (Basham, 1975) and existed as a Portuguese settlement (Majumdar, 1971 & O‟Malley, 1911). Presently, the Tamluk urban area exists as the centre of operations of district Purba Medinipur and has a strong control over the regional economy as a trade centre (Basu, 1921). Different cultural traits left their imprints over the physical space. Some of which are still existent e.g. Bargabhima temple (Buddhist architecture) and Sakti temple (Oriya type architecture) (Basham, 1975). Contai is headquarters of Contai sub-division in Purba Medinipur district, West Bengal. In its early phase of evolution the area, 27 miles in and from Rasulpur estuary was occupied by an outstretched sand dune elevated and elongated enough to appear in the form of a long walls, locally known as „Kanths‟ and these „kanths‟ gave the place its name (O‟Malley, 1911). Consequent marine regression left this beach ridges inland for development of settlements like Majna, Kandi etc over them about 6000 years ago (Basu, 1921). After eighth century, port Tamralipta lost its importance (Sharma, 2003 & O‟Malley, 1911) and Hijili became a great trade centre (O‟Malley, 1911). European trade appears to have flourished during colonial period around Contai (Roy, 2006 & O‟Malley, 1911). In 1852 A.D., the East India Company announced as a sub-division consisting of six police stations – Contai, Khejuri, Ramnagar, Egra, Bhagabanpur and Pataspur and the sub-divisional office was at Negua (Hunter, 1876). Bankim Chandra Chattopadhaya served as the deputy magistrate of Contai from January to November, 1860 (Ghosh, 2008). In 2002, Medinipur district was divided into two – Purba and Paschim Medinipur for the sake of administrative efficiency. Purba Medinipur district consists of four sub- divisions – Contai, Tamluk, Egra and Haldia. Contai urban area is under Contai block and Contai block is under Contai sub-division. Presently, Contai urban area is about 30 kilometres away from the beach town Digha, a famous tourism centre of West Bengal as well as Eastern India. Now-a-days, Contai is famous for cashew nut industry, salt processing industry and also for kansa and madur production (Roy, 2006). Midnapore town is the headquarters of the district Paschim Medinipur, West Bengal (O‟Malley, 1911). Sea level fall and consequent isostatic adjustment (86000 B.P.) led this area to rise as an upland over which laterization became dominant process to shape its geomorphology (Majumdar, 1971). The town was declared to be the headquarters on 22nd September, 1783A.D. (O‟Malley, 1911). The name of the town was recorded as an important port of Sarkar Jaleswar (Medinipur, Chakal, Bardhaman and Chetua) in Ain-e-Akbori and Medinipur was established and named after Medinikar (1200 to 1431 A.D.), the famous author of the lexicon ‟Medinikosh‟ (Hunter, 1876). In 2002, Medinipur district was divided into two – Purba and Paschim Medinipur for the sake of administrative efficiency. Paschim Medinipur district has four sub-divisions – Kharagpur, Medinipur Sadar, Ghatal and Jhargram. Midnapore urban area is under Medinipur Sadar sub-division. Presently, Midnapore urban area is mainly developed as an administrative cum commercial centre along with agricultural activities, industrial activities and different types of informal activities (O‟Malley, 1911). IV. Result and Discussion 4.1 Annual Growth Rate of Urban Population and Area Annual Growth Rate of Urban Population and Area of Tamluk, Contai and Midnapore Urban Centre Name of the Urban centres Population Annual Growth (%) Area (Sq.Km) Annual Growth (%) 2001 2011 2001-2011 2001 2011 2001-2011 Tamluk 45830 65306 4.25 10.36 17.86 7.24 Contai 77513 92226 1.90 14.25 17.25 2.11 Midnapore 149769 169264 1.30 14.78 18.65 2.62 Urban populations are increasing rapidly. In approximately 2027, for the first time in history, the global urban population will exceed the global rural population, and urban population has remained predominantly urban thereafter (Unite Nations, 2000). In coming decades, urban populations are expected to double in next 50 years, while rural population remain constant or decline (Rosser, 1980). In the US, urban populations are growing (not as rapid as the global rate) and the urban areas are expanding faster than the urban population size, leading to a decline in average urban population density. Whereas, in India, urban population are increasing (as rapid as the global rate) and the urban areas are expanding faster than the urban population size, leading to a incline in average urban population density. Urban population growth affects urban areas in many ways, from infrastructure requirements and their environmental impacts, to a new pattern of social interactions and changes in regional economy (Bettencourt et al., 2007; Rosser, 1980). But urban growth in terms of population ad area is related with economic development, institutional and commercial activities, technological advancement, cultural growth and ecological settings. A single or autonomous factor alone also accelerates the growth of an urban centre. It is found that Tamluk urban area of Purba Medinipur District has almost doubled in terms of area (Table 1) in one decade from year 2001 to 2011 i.e. from 10.36 sq.km to 17.86 sq.km. Tamluk has experienced a very high annual growth rate of population, 4.25% during 2001 to 2011 which is very high as compared to the growth rates experienced in the previous time periods and as compared to the growth rates of Contai (2.11%) and Midnapore urban area (1.30%). It is due to the fact that Tamluk has become the district headquarters of
- 5. Delineating Sphere of Urban Influence: The Case of Three Early Urban Centres of Eastern India DOI: 10.9790/0837-2011491100 www.iosrjournals.org 95 | Page newly formed Purba Medinipur district in 2001. This change in status has attracted large amount of institutional and commercial activities to come up in Tamluk urban area in last one decade. Further, it is evident from the same table that all the three urban centres have been recorded to increase their urban population along with expansion of urban area. The annual growth of urban population (1.90%) and annual growth of urban area (2.11%) during 2001 to 2011 are near about identical for Contai urban centre, but for Tamluk and Midnapore urban centre the annual growth rate of urban population and urban area are not identical i.e. the annual growth rate of urban area (7.24% for Tamluk and 2.62% for Midnapore urban area) is near about double in relation to annual population growth rate(4.25% for Tamluk and 1.30% for Midnapore urban area). 4.2 Projection for Urban Population Projected Population for Tamluk, Conati and Midnapore Urban Areas Urban centres Population of the base year i.e. in 2001 Annual growth rate (%) Projected year Projected Population Tamluk 65306 4.25 104163 Contai 92226 1.90 2025 116758 Midnapore 169264 1.30 200070 In today‟s increasingly global and interconnected world, one half of the World‟s Population lives in urban areas although there is still a substantial variability in the levels of urbanization across countries (UN World Population Prospects Report, 2014). The coming decades are expected to see changes in the size and spatial distribution of global population. The continuing urbanization and overall growth of World Population is projected to add 2.5 billion people to the global urban population by 2050, with nearly 90% of the increase concentrated in Asia and Africa. At the same time, the population of the World living in urban areas is expected to increase, reaching 66% by 2050. The urban population in 2014 accounted for 54% of the total global population, up from 34% in 1960, and continues to grow. The global urban population is expected to grow approximately by 1.84% per year between 2015 and 2020, 1.63% per year between 2020 and 2025, and 1.44% per year between 2025 and 2030 (Global Health Observation). Population projection is a scientific attempt to peep into the future population scenario, under certain assumptions by using available data at present point of time. Being the fourth most populous state in India, the size and growth of West Bengal‟s population remained a matter of great interest not only to West Bengal but to India also. According to 2011 census, the total population of West Bengal was 9,13,47,736 (urban-6,22,13,676 and Rural-2,91,34,060) and the population of West Bengal is currently growing at the rate of 0.14 percent per year, whereas the growth rate for urban population per year is 1.13 percent. Tamluk, Contai and Midnapore, the three early urban centres of West Bengal as well as for eastern India, there has been a spurt in growth of urban population from 2001 to 2011 census at the rate of 4.25 %, 2.11 % and 1.30 %, respectively, which could be due to migration and natural increase, in general. The population of these three urban areas will continue to grow until at least 2050, with the estimated population (based on current growth trends), to reach 104163 for Tamluk, 116758 for Contai and 200070 for Midnapore in 2025, and in 2050 as high as 1 lakh 50 thousand for Tamluk and Contai and 2 lakh 50 thousand for Midnapore urban area. 4.3 Mean Population Threshold (MPT) Mean Population Threshold for a particular category of facility of a geographical unit is considered to be the best way to assess and determine the ratio between the total population and number of facilities of the category (Haggett and Gunwardana, 1965). Threshold Population (PT) is the minimum number of people required to support a given service. The concept is equivalent to the „range‟ in Central Place Theory, which delineates the market area of the central place for a particular service, and is dependent on the spatial distribution of population and the willingness of the consumers to travel a given distance to purchase goods or to achieve services (Goodall, 1987). Therefore, it states that there is a range of population size for each function, below the lower limit of which all settlements lack that functions, while above the upper limit all settlements possess it. A lower order facility (Primary School) may require only 500 or so populations, whereas a higher order facility (Degree College) may need a threshold of 50000 to be sustainable, a University may need 350000 to be viable (Tiscali Encyclopedia). For example, a Primary school, a Degree college and a University may require threshold population in Aligarh District in UP are 1727, 33679 and 1868831 and in Kolkata district, West Bengal these threshold are 3112, 66927 and 749449, respectively. The present study, reveals that among the educational facilities, Primary school, Degree College and University for the combined Purba and Paschim Medinipur district, are having the MTP are higher than the required ratio i.e. 1389, 262799 and 11037538. Therefore, the Population Threshold propose that all the settlements having higher population than the threshold but not yet having the function should have it; and the settlements having lower population than the threshold and having the function should have it.
- 6. Delineating Sphere of Urban Influence: The Case of Three Early Urban Centres of Eastern India DOI: 10.9790/0837-2011491100 www.iosrjournals.org 96 | Page 4.4 Functional Weightage of Facility Anyone settlement in a region may not have all types of utility and amenitiy for fulfilling the social functions. But the functional importance of the settlement is judge on the basis of the concentration of available facilites. In an integrated area planning, population centres at the bottom of the hierarchy are planned to promote for the balanced growth of the region (Bhatt, 1960). The Functional Weitage of a choosen function/ facility is obviously related to the frequency of its occurrence. In case of Ballia district in UP, the functional importance of Primary schools, High schools and Degree colleges are 1.21, 2.99 and 5.04, respectively; and total number of Primary schools, High schools and Degree colleges are 4200, 2963 and 499, comparatively. Therefore, it is quite simple to understand that importance of a University is much more than a secondary school which may occur in more numbers in a particular settlement (Sharma, 1972). In the present analysis, to find out the relative functional importance/weightage, mean population threshold for non-formal educational institute (577 persons) has been taken as the unit measure i.e. weightage value of 1 has been assigned to a non-formal educational institute which has the lowest mean population threshold. In relation to this unit value, functional weightage of the other facilities have been estimated. Therefore, facilities occurring in higher frequency have functionally lower importance value and vice-versa. Thus, a university receives highest functional weightage (19139) followed by the government tourist lodge (2392.38), while the lowest functional weightage is obtained by the non-formal educational institute (1.00) after the facility of primary schools (2.41). Mean Population Threshold and Functional Weightage of Urban Facilities, Purba and Paschim Medinipur District Category of Facilities Name of the Facility Number of Facility Total Number of Facility Total Population Mean Population Threshold Functional Weightage Purba Medinipur Paschim Medinipur Educational Institute Primary Schools 3253 4691 7944 11037538 1389 2.41 Middle/Junior Schools 55 12 67 11037538 164739 285.66 Secondary/Matri culation 317 440 757 11037538 14581 25.28 Senior Secondary Schools 313 316 629 11037538 17548 30.43 Degree Colleges 18 24 42 11037538 262799 455.69 University 0 1 1 11037538 11037538 19139.0 Centre of Open University 6 3 9 11037538 1226393 2126.56 Technical Schools 20 22 42 11037538 262799 455.69 Technical Colleges 22 15 37 11037538 298312 517.27 Technical University 1 0 1 11037538 11037538 19139.00 Mass Literacy Centre 3161 4198 7359 11037538 1500 2.60 Non-formal 7597 11542 19139 11037538 577 1.00 Recreational Facility Cinemas 76 24 100 11037538 110375 191.39 Public Libraries 121 158 279 11037538 39561 68.60 Reading Rooms 124 158 282 11037538 39140 67.87 Govt. Tourist Lodge 7 1 8 11037538 1379692 2392.38 Health Facility Hospitals 8 28 36 11037538 306598 531.64 Sub-centres 706 858 1564 11037538 7057 12.24 Family Welfare Centres 31 40 71 11037538 155458 269.56 Primary Health Centres 51 82 133 11037538 82989 143.90 Nursing Homes 152 124 276 11037538 39991 69.34 Block Primary Health Centres 22 6 28 11037538 394198 683.54 Financial and Commercial Institute Nationalized & Non-nationalized Banks 227 324 551 11037538 20032 34.74 Agricultural Credit Societies 722 835 1557 11037538 7089 12.29
- 7. Delineating Sphere of Urban Influence: The Case of Three Early Urban Centres of Eastern India DOI: 10.9790/0837-2011491100 www.iosrjournals.org 97 | Page Non- Agricultural Credit Societies 534 1084 1618 11037538 6822 11.83 Non-Credit Societies 373 452 825 11037538 13379 23.20 Communication Facility Post Offices 832 590 1422 11037538 7762 13.46 Administrative Facility Police Stations 34 52 86 11037538 128343 222.55 Cold Storage Facility 23 81 104 11037538 106130 184.03 4.5 Composite Functional Score (CFs) and Proportional Composite Functional Score (PCFs) The analysis of spatio-temporal dynamism of phenomena is the main thrust of geographical research. Likewise diverse physical, cultural, social and economic aspects, the distribution of population and facilities is not uniform across the region. But over the earth‟s surface, the nature of distribution of both population and facilities happens together, as both are interdependent to each other. People requires different facilities to sustain their socio-economic life as well as to fulfill needs and desires, while proper functioning of facilities depends on the size and purchasing power of patrons. Therefore, higher important facilities which are fewer in number available only in bigger size towns, while lower important facilities are available in both bigger as well as smaller size towns. Functional weightage values for all the facilities (based on MPT) are summed up to derive the Composite Functional Score for a geographical unit. Composite Functional Score and Proportional Composite Functional Score analysis is a significant way to estimate the probability of extension of an urban centre in future. People flows towards the centre where there are ample opportunities of education, employment, medical etc.as socio-economic pull factors. Urban centre having more functions but less population has more prospect of further growth. The present study reveals the distribution of three urban centres or towns in five categories according to their population size and also indicates the total urban population and composite functional score (total importance of all facilities in a town) in each size category. Midnapore is the biggest town in medinipur district with its total population 169264 persons in 2011 (51.80 per cent of total urban population in the district) and Composite Functional Score (CFS) of 855.12 (45.30 per cent of total urban functional importance), comes under the category of Class I towns in India. However, Tamluk and Contai (65306 and 92226) are found in Class II town in the district having 16.59 per cent urban population and 38.11 per cent (CFS 313.14 and 719.42) urban functional importance. The present study reveals the Proportional Composite Functional Score (relative ratio of CFs of urban centre and CFs of district as a whole). Such an analysis is significant to estimate the probability of extension of a town in future. People flows towards the centre where there are ample opportunities of education, employment, medical, etc. as socio-economic pull factors. Therefore, a town having more functions but lesser population has more prospect of further growth. In this view, it may be argued that a town with PCFs near about 01 is supposed to have more functional importance in proportion to its existing population size, subsequently has an advantage of further expansion by attracting and accommodating more people. In contrary, towns with ratio less nearer to zero have lesser probability to be expanded. In the study area, Class I town i.e., Midnapore has scored the ratio of 0.01960, while Class II town i.e., Contai and Tamluk have scored highest ratio of 0.01512 and 0.00879 respectively. It may be inferred that Midnapore and Contai urban centre have greater probability of its further growth than Tamluk urban centre. However, Midnapore and Contai have better prospect of its further growth in terms of both population and area consequent upon in-migration of people from surrounding rural part. Number of Facilities and Functional Weightage of Urban Facilities of Tamluk, Contai and Midnapore Urban Centres Category of Facilities Name of the Facility Number of Facility Functional Weightage Tamluk Contai Midnapore Tamluk Contai Midnapore Educational Institute Primary Schools 34 21 85 1.24 4.14 1.35 Middle/Junior Schools/ Secondary 2 3 7 21.00 29.00 16.43 Senior Secondary Schools 7 8 18 6.00 10.88 6.39 Degree Colleges 1 1 3 42.00 87.01 38.33 University - - 1 - - 114.99 Technical Schools/ College 11 12 15 3.82 7.25 7.67 Mass Literacy Centre 29 18 24 1.45 4.83 4.79
- 8. Delineating Sphere of Urban Influence: The Case of Three Early Urban Centres of Eastern India DOI: 10.9790/0837-2011491100 www.iosrjournals.org 98 | Page Non-formal 42 87 115 1.00 1.00 1.00 Recreational Facility Cinemas 3 4 1 14.00 21.75 114.99 Public Libraries 3 1 4 14.00 87.01 28.75 Reading Rooms 5 2 4 8.40 43.50 28.75 Health Facility Hospitals 1 1 1 42.00 87.01 114.99 Family Welfare Centres 2 1 3 21.00 87.01 38.33 Nursing Homes 32 19 20 1.31 4.58 5.75 Financial and Commercial Institute Nationalized & Non- nationalized Banks 8 7 16 5.25 12.43 7.19 Agricultural and Non-agricultural Credit Societies 9 6 11 4.67 14.50 10.45 Communicatio n Facility Post Offices 1 1 1 42.00 87.01 114.99 Administrativ e Facility Police Stations 1 1 1 42.00 87.01 114.99 Cold Storage Facility 1 2 1 42.00 43.50 114.99 CFs 313.14 719.42 855.12 Composite and Proportional Composite Functional Score of Urban Centres, Their Sphere and Radius of Influence Urban Centres Composite Functional Score (CFs) Population (P) Area (A) in Sq.Km. Proportional Composite Functional Score (PCFs) Sphere of Influence (SI) in Sq.Km. Radius of Influence (R) in Km. Tamluk 313.14 65306 17.86 0.00879 123.77199 11.12529 Contai 719.42 92226 17.25 0.01512 212.90472 14.59125 Midnapore 855.12 169264 18.65 0.01960 275.98760 16.61287 Kolkata 17383.83 4496694 185.00 0.15330 13605.40684 116.64222 4.6 Adequacy and Inadequacy of Urban Facilities Functional importance is the sum of all the pulling factors available in an urban centre. Therefore, higher functional importance having variety of both higher and lower order facilities exerts a greater pulling effect that attracts people towards an urban centre. Thus, a smaller urban centre turns into a bigger urban centre progressively. Functional importance is the qualitative identity of an urban centre, as it refers to the pulling gravity of later. Since the functional importance varies across urban centre, their size of population and area also vary positively. Higher order centres with higher functional importance encompasses larger influence area within which the influence area of lower order centres come under. Kolkata metropolitan urban centre being a largest urban centre in the state of West Bengal as well as in Eastern India radiates its influence up to the highest distance from the centre with radius of influence 116.6422 km and its population and CFs are 4496694 and 17383.83. In comparison to Kolkata metropolitan urban centre, the CFs of Midnapore, Tamluk and Contai urban centre should be 655.05168, 252.73422 and 356.91462 respectively. But it is revealed that Midnapore urban area with functional importance 855.12 stood at the highest position accounting total population 169264 persons and 18.65 sq.km area. Midnapore urban area had enjoyed the position of headquarter of Medinipur district and now this urban area is getting pleasure from the status of headquarter of Paschim Medinipur district and have all the socio-economic facilities including a university, medical college. It is followed by Contai and Tamluk urban area of Purba Medinipur district with functional importance of 719.42 and 313.14. Among the three historical urban area of Purba and Paschim Medinipur district, Tamluk urban area having functional importance of 313.14 stood at the lowest position with population and area 65306 persons and 17.86 sq.km respectively. Therefore, in comparison to Kolkata metropolitan urban centre these three urban centres have the adequate facilities and make use of these facilities to the people of the urban centre.
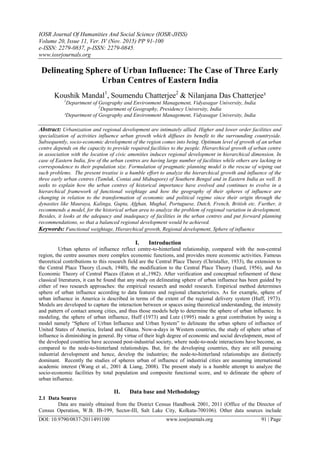
- 9. Delineating Sphere of Urban Influence: The Case of Three Early Urban Centres of Eastern India DOI: 10.9790/0837-2011491100 www.iosrjournals.org 99 | Page 4.7 Sphere of Influence of Urban Centre Fig.2 radius of influence of tamluk, contai and midnapore urban centres (based on modified method of V.L.Prakas Rao, 1964) Each city forms the centre of a larger area and dominates over certain area which is actually the city‟s sphere of influence (Murphy 1974). Urban centres do not function in isolation; rather they provide goods and services to the area lying beyond the urban boundary. People from the surrounding area commute a town to avail the required facilities. But, people visit towns from a certain distance. The distance, which patrons willing to travel, depends on the importance of facility so that it should be the economy of the distance (Pawar and Lokhande 2001, Yasenovskiy and Hodgson 2007). Therefore, both importance of facility and the distance traveled by the patrons are positively related. Again, an urban centre having large number and higher order of facilities is being visited by patrons from longer distance. In other words, an urban centre with higher functional importance exerts an influence upon larger area of its surrounding (Lokhande and Pawar 2004). Such, an area surrounding the urban centre reveals the complexity of interaction and interdependence between town and surrounding rural area that is popularly known as functional region (Glasson 1978). It may be inferred that a town having higher functional importance covers larger zone of influence and vice-versa. In this analysis by adopting V.L.S.Prakash Rao‟s modified method, the sphere of influence of each urban centre has been delineated. Midnapore urban area exerts its influence up to 16.61287 km and covers the area of 275.98760 sq.km. It is followed by the Contai urban area with its radius of influence 14.59125 km. and sphere of influence is 212.90472 sq.km. However, Tamluk has been identified at the bottom position in its functional influence with radius of influence 11.12529 km. and sphere of influence is 123.77199 sq.km. V. Conclusion Urban growth is the outcome of concentration of population due to the availability of diverse amenities and facilities in the urban centre. The urban centres do not grow in isolation, rather grow in hierarchical manner. Quantitatively, an urban centre with higher functional weightage exerts an influence upon the larger area of its
- 10. Delineating Sphere of Urban Influence: The Case of Three Early Urban Centres of Eastern India DOI: 10.9790/0837-2011491100 www.iosrjournals.org 100 | Page surrounding. Functional weightage of Tamluk, Contai and Midnapore urban centres are 313.14, 719.42 and 855.12 and their sphere of influence are 123.77199 sq.km, 212.90472 sq.km and 275.8760 sq.km respectively. Therefore, it is evident that the sphere of influence of these urban centres positively related to their functional weightage which leads to socio-economic development. Further research will be valuable on the distribution pattern and evolution characteristics of urban sphere of influence and on the development progress of urban agglomeration regions. Furthermore, the urban hierarchy and relationship among urban agglomeration regions need to be studied in future. References [1]. W. Christaller, The Central Places in Southern Germany, doctoral diss., University of Heidelberge, Munich, 1933. [2]. Losch, The spatial organization of the economy (302 Temple st, New Haven, CT 06511, United States, Yale University Press, 1940). [3]. W. Israd, Location and space economy (New York, Wiley, 1956 & Massachusetts Institute of Technology, The Technology Press, 1956). [4]. Curtis Eaton and G. Lipsey Richard, An economic theory of central places, The Economic Journal, 92(365), March, 1982, 56-72. [5]. D.L. Huff, The delineation of a national system of planning regions on the basis of urban sphere of influence, Regional Studies, 7(3), 1973, 323-329. [6]. D.L. Huff, and J.M. Lutz, Change and continuity in the irish urban system, Sage Journals of Urban Studies, 32(1), 1995, 155-173. [7]. F. Wang, Regional density functions and growth patterns in major plains china, Regional Science, 80(3), 2001, 231-240. [8]. S. Liang, Research on the urban influence domains in china, International Journal of Geographical Information Science, 23(12), 2008, 1527-1539. [9]. P. Hagget, and K.A. Gunwardena, Determination of population thresholds for settlement functions by reed muench method, Journal of Professional Geographer, 16(4), 1965, 6-9. [10]. Bhatt, Micro level planning-a study of karnal area Haryana india (New Delhi, K.B.Publication, 1976). [11]. V.L.Prakash Rao, Towns of mysore state (Calcutta, Asia Publishing House, 1964). [12]. L.S.S. O‟Malley, Bengal district gazetteers midnapore (Salt Lake City, Calcutta, The Bengal Secretariat Book depot, 1911). [13]. R.C. Majumdar, History of ancient Bengal (22A College Row, Calcutta-9, G. Bharadwaj & Co., 1971). [14]. A.L. Basham, A cultural history of india (YMCA Library Building, Jai Singh Road, New Delhi, 110001, Oxford University Press, 1975). [15]. J. Basu, Medinipurer itihas (36A College Row, Kolkata, 700073, Annapurna Prakashani, 1921). [16]. R. Sharma, Adi o madhayajuger bharatiya samaj: samanta pokriya bishaye ek samikha (17 Chittaranjan Avenue, Kolkata, 700072, Orient Longman Private Limited, 2003). [17]. T. Roy, The economic history of india 1857-1947 2nd edition (YMCA Library Building, Jai Singh Road, New Delhi, 110001, Oxford University Press, 2006). [18]. W.W. Hunter, A statistical account of bengal vol III districts of midnapore and hoogly (London, Trubner & Co., 1876). [19]. Ghosh, Paschimbanglar sanaskriti vol II (15 Bankim Chatterjee Street, Kolkata, 700073, Prakash Bhaban, 2008). [20]. J.B. Rosser, Complex evolutionary dynamism in urban-regional ecological-economic system from catastrophe to chaos and beyond (Harrisonburg, USA, Springer, 1980). [21]. J. Lobo, M.A. Bettencourt, D. Strumsky, and G.B. West, The economic productivity of urban areas: Disentangling general scale effects from local exceptionality, Santa Fe Institute Working Paper,1399 Hyde Park Road, Santa Fe, New Maxico, USA, 2012, 32- 38. [22]. E.E. Murphy, The American city: an urban geography 2nd edition (New York, McGraw Hill, 1974). [23]. T.C. Pawar, and N.T. Lokhande, Centrality and hierarchy of market centres in Kolhapur district, Maharastra, The Deccan Geographers, 39(1), 2001, 1-14. [24]. Yasenovskiy, and J. Hodgson, Hierarchical location-allocation with spatial choice interaction modeling, Annals of Association of American Geographers, 97(3), 2007, 496-511. [25]. J. Glasson, An introduction to regional planning 2nd edition (Great Britain, Anchor Press Ltd., 1978).