SlideShare a Scribd company logo
1 of 10
QUANTITATIVE DATA ANALYSIS
Let us commence our look at data analysis by looking at a
hypothetical research study.
Remember that there are different ways of approaching a
research question and how we put together our research
question will determine the type of methodology, data
collection method, statistics, analysis and presentation
that we will use to approach our research problem.
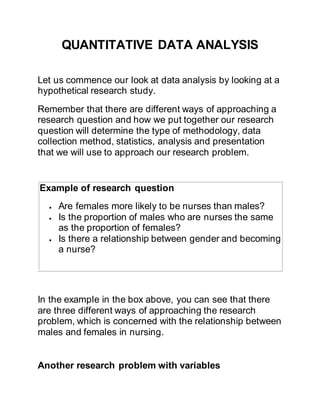
Example of research question
 Are females more likely to be nurses than males?
 Is the proportion of males who are nurses the same
as the proportion of females?
 Is there a relationship between gender and becoming
a nurse?
In the example in the box above, you can see that there
are three different ways of approaching the research
problem, which is concerned with the relationship between
males and females in nursing.
Another research problem with variables
In another research problem - the relationship between
gender and smoking, there are 2
categorical variables(gender & smoker), with two or more
categories in each, for example:
Gender (male/female)
Smoker (yes/no)
You are looking for whether or not there is any
significance in the results
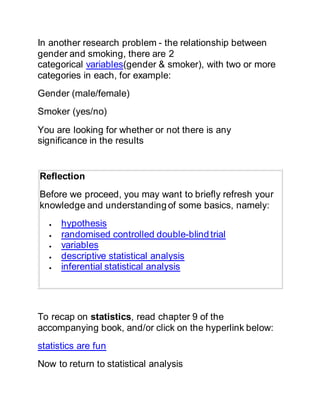
Reflection
Before we proceed, you may want to briefly refresh your
knowledge and understanding of some basics, namely:
 hypothesis
 randomised controlled double-blind trial
 variables
 descriptive statistical analysis
 inferential statistical analysis
To recap on statistics, read chapter 9 of the
accompanying book, and/or click on the hyperlink below:
statistics are fun
Now to return to statistical analysis
Alpha level (p level)
In statistical analysis we are looking to see if there is any
significance in the results. The acceptance or rejection of
a hypothesis is based upon a level of significance – the
alpha () level
This is usually set at the 5% (0.05)  level, followed in
popularity by the 1% (0.01)  level
We usually designate these as p, i.e. p =0.05 or p = 0.01
So, what do we mean by levels of significance that the 'p'
value can give us?
Statistical tests
There are many tests that we can use to analyse our data,
and which particular one we use to analyse our data
depends upon what we are looking for, and what data we
collected (and how we collected it).
Below are just a few of the more common ones that you
may come across in research papers.
Mann-Whitney U-test
This test is used to test for differences between 2
independent groups on a continuous measure, e.g. do
males and females differ in terms of their levels of self-
esteem.
This test requires two variables (e.g. male/female gender)
and one continuous variable (e.g. self-esteem).
It actually compares medians.
It converts the scores on the continuous variable
to ranks, across the two groups.
It then evaluates whether the medians for the two groups
differ significantly.
Spearman rank correlation test
This test is used to demonstrate the relationship between
two ranked variables
Frequently used to compare judgements by a group of
judges on two objects, or the scores of a group of
subjects on two measures.
This is a coefficient correlation based on ranks.
It shows the association between two variables (X and Y),
which are not normally distributed.
Don’t worry about the details – just remember that it is an
acceptable method for parametric data when there are
less than 30 but more than 9 paired variables.
Kruskal-Wallis test
This test is used to compare the means among more than
two samples, when either the data are ordinal or the
distribution is not normal.
If there are only two groups then it is the equivalent of the
Mann-Whitney U-test, so you may as well use that test.
This test would normally be used when you wanted to
determine the significance of difference among three or
more groups.
Below is a very brief look at other common tests - for more
information on statistical tests, read chapter 9 of the
accompanying book.
Other Common Statistical Tests/Procedures
t-test
The t-test assesses whether the means of two groups
are statisticallydifferent from each other. This analysis is appropriate
whenever you want to compare the means of two groups.
Pearson Correlation
We use the Pearson's correlation in order to find a correlation
between at least two continuous variables. The value for such a
correlation lies between 0.00 (no correlation) and 1.00 (perfect
correlation).
ANOVA (Analysis of Variance)
ANOVA is one of a number of tests (ANCOVA - analysis of
covariance - and MANOVA - multivariate analysis of variance) that
are used to describe/compare the relationship among a number of
groups.
Chi-square test
There are two different types of chi-square tests - but both involve
categorical data (Pallant 2001).
One type of chi-square test compares the frequency count of what is
expected in theory against what is actually observed.
The second type of chi-square test is known as a chi-square test
with two variables or the chi-square test for independence.
Wilcoxon signed-rank test
This is the most common nonparametric test for the two-sampled
repeated measures design of research study, and is also known as
the Wilcoxon matched-pairs test.
This has just been a very brief look at some of the more
common statistical tests for the analysis of data obtained
from quantitative research - more details are given in
chapter 9 of the accompanying book. There are, of course,
many others, and any good statistics book will have details
of them.
Selecting your statistical test
When it comes to the selection of the appropriate test for
your research in order to determine the p-value, you need
to base the selection of four major factors, namely:
 The level of data (nominal, ordinal, ratio, or interval).
 The number of groups/samples in your research study
(one, two, or more).
 Were the data collected from independent
groups/samples or from related groups? Remember
that independent groups are two or more separated
groups of participants, whilst related groups are often
the same group, but at a different time in the study,
e.g. pre- and post-testing, or even a different
environment.
 The characteristics of the data (i.e. the distribution of
the data).
Now all these statistical tests may look very complicated,
but if ever you are involved in quantitative research and
have to do statistical analysis, don't worry because help is
at hand.
There is a computer package for statistical analysis known
as SPSS
SPSS stands for:
Statistical Package for Social Sciences
SPSS is one of a number of computer packages that can
do just about any calculation that you want, using any
statistical test.
Before we finish this section, we just need to remind you
to be careful when you are looking at research that uses
statistics.
Limitations of research study/data/statistical tests
Always look for these – the researchers should reflect on
their study and discuss anything that did not make it
perfect, for example:
 size of sample
 tests used
 initial question
It is easy to tie yourself up into knots when either doing
statistics as part of your research, or when reading
research papers, so remember two things:
1. Keep things simple
2. Statistics by themselves are meaningless, it is the
analysis and
discussion of statistics which makes them meaningful
and brings
them to life.
Finally
The time has come for you to decide which statistical test
you will be using for your own quantitative research. As we
keep mentioning, if all this is new to you, do not hesitate to
seek the advice of an experienced quantitative researcher
and/or a statistician - at as early a stage as possible.
TO DO
Click on to the icon below for the example of a
quantitative research study proposal:

When you are satisfied that you have the correct
statistical test(s), and you can justify it/them, then write
them into your research proposal.

More Related Content

What's hot

Research assumption
Research assumptionResearch assumption
Research assumptionNursing Path
 
Practical Research 2 Chapter 3: Common Statistical Tools
 Practical Research 2 Chapter 3: Common Statistical Tools Practical Research 2 Chapter 3: Common Statistical Tools
Practical Research 2 Chapter 3: Common Statistical ToolsDaianMoreno1
 
Chapter I - The Problem and Its Background
Chapter I - The Problem and Its BackgroundChapter I - The Problem and Its Background
Chapter I - The Problem and Its Backgroundschool
 
Review of related literature and studies
Review of related literature and studiesReview of related literature and studies
Review of related literature and studiesbantigui
 
Participants of the study
Participants of the studyParticipants of the study
Participants of the studyMayang Colcol
 
Statistical treatment of data
Statistical treatment of dataStatistical treatment of data
Statistical treatment of datasenseiDelfin
 
8. validity and reliability of research instruments
8. validity and reliability of research instruments8. validity and reliability of research instruments
8. validity and reliability of research instrumentsRazif Shahril
 
Summary, Conclusions and Recommendations
Summary, Conclusions and RecommendationsSummary, Conclusions and Recommendations
Summary, Conclusions and RecommendationsRoqui Malijan
 
Related Literature and Studies
Related Literature and StudiesRelated Literature and Studies
Related Literature and StudiesRoqui Malijan
 
Chapter 3 research methodology
Chapter 3 research methodologyChapter 3 research methodology
Chapter 3 research methodologyNeilson Silva
 
Statistical Treatment
Statistical TreatmentStatistical Treatment
Statistical TreatmentDaryl Tabogoc
 
Statistical treatment and data processing copy
Statistical treatment and data processing   copyStatistical treatment and data processing   copy
Statistical treatment and data processing copySWEET PEARL GAMAYON
 
3.2 strengths and weaknesses of qualitative research
3.2 strengths and weaknesses of qualitative research3.2 strengths and weaknesses of qualitative research
3.2 strengths and weaknesses of qualitative researchJoash Medina
 
Review of related literature samples
Review of related literature samplesReview of related literature samples
Review of related literature samplesairamaerama
 

What's hot (20)

Research assumption
Research assumptionResearch assumption
Research assumption
 
Thesis Chapter 1 to 5
Thesis Chapter 1 to 5 Thesis Chapter 1 to 5
Thesis Chapter 1 to 5
 
Practical Research 2 Chapter 3: Common Statistical Tools
 Practical Research 2 Chapter 3: Common Statistical Tools Practical Research 2 Chapter 3: Common Statistical Tools
Practical Research 2 Chapter 3: Common Statistical Tools
 
Chapter iii
Chapter iiiChapter iii
Chapter iii
 
Chapter I - The Problem and Its Background
Chapter I - The Problem and Its BackgroundChapter I - The Problem and Its Background
Chapter I - The Problem and Its Background
 
Review of related literature and studies
Review of related literature and studiesReview of related literature and studies
Review of related literature and studies
 
Participants of the study
Participants of the studyParticipants of the study
Participants of the study
 
Statistical treatment of data
Statistical treatment of dataStatistical treatment of data
Statistical treatment of data
 
8. validity and reliability of research instruments
8. validity and reliability of research instruments8. validity and reliability of research instruments
8. validity and reliability of research instruments
 
Summary, Conclusions and Recommendations
Summary, Conclusions and RecommendationsSummary, Conclusions and Recommendations
Summary, Conclusions and Recommendations
 
Related Literature and Studies
Related Literature and StudiesRelated Literature and Studies
Related Literature and Studies
 
Presentation of data
Presentation of dataPresentation of data
Presentation of data
 
Chapter 3 research methodology
Chapter 3 research methodologyChapter 3 research methodology
Chapter 3 research methodology
 
Chapter iii
Chapter iiiChapter iii
Chapter iii
 
Chapter 9-METHODS OF DATA COLLECTION
Chapter 9-METHODS OF DATA COLLECTIONChapter 9-METHODS OF DATA COLLECTION
Chapter 9-METHODS OF DATA COLLECTION
 
Statistical Treatment
Statistical TreatmentStatistical Treatment
Statistical Treatment
 
Chapters 1 5
Chapters 1 5Chapters 1 5
Chapters 1 5
 
Statistical treatment and data processing copy
Statistical treatment and data processing   copyStatistical treatment and data processing   copy
Statistical treatment and data processing copy
 
3.2 strengths and weaknesses of qualitative research
3.2 strengths and weaknesses of qualitative research3.2 strengths and weaknesses of qualitative research
3.2 strengths and weaknesses of qualitative research
 
Review of related literature samples
Review of related literature samplesReview of related literature samples
Review of related literature samples
 

Viewers also liked

Research: Conclusion
Research: ConclusionResearch: Conclusion
Research: Conclusiongeorgewyse
 
Research conclusion
Research conclusionResearch conclusion
Research conclusionamybradley95
 
Conclusion of research
Conclusion of researchConclusion of research
Conclusion of researchMaria Jordan
 
Research Conclusion
Research ConclusionResearch Conclusion
Research Conclusiontmendel10
 
Research conclusion
Research conclusionResearch conclusion
Research conclusionp10540735
 
Quantitative Data Analysis: Hypothesis Testing
Quantitative Data Analysis: Hypothesis TestingQuantitative Data Analysis: Hypothesis Testing
Quantitative Data Analysis: Hypothesis TestingMurni Mohd Yusof
 
Data analysis powerpoint
Data analysis powerpointData analysis powerpoint
Data analysis powerpointjamiebrandon
 
Drawing conclusions powerpoint
Drawing conclusions powerpointDrawing conclusions powerpoint
Drawing conclusions powerpointLisa
 
Quantitative Data Analysis
Quantitative Data AnalysisQuantitative Data Analysis
Quantitative Data AnalysisAsma Muhamad
 

Viewers also liked (13)

Research: Conclusion
Research: ConclusionResearch: Conclusion
Research: Conclusion
 
Research conclusion
Research conclusionResearch conclusion
Research conclusion
 
Conclusion of research
Conclusion of researchConclusion of research
Conclusion of research
 
Research conclusion
Research conclusionResearch conclusion
Research conclusion
 
Research Conclusion
Research ConclusionResearch Conclusion
Research Conclusion
 
Research conclusion
Research conclusionResearch conclusion
Research conclusion
 
Quantitative Data Analysis: Hypothesis Testing
Quantitative Data Analysis: Hypothesis TestingQuantitative Data Analysis: Hypothesis Testing
Quantitative Data Analysis: Hypothesis Testing
 
Qualitative Research
Qualitative ResearchQualitative Research
Qualitative Research
 
Data analysis powerpoint
Data analysis powerpointData analysis powerpoint
Data analysis powerpoint
 
Drawing conclusions powerpoint
Drawing conclusions powerpointDrawing conclusions powerpoint
Drawing conclusions powerpoint
 
Chapter 10-DATA ANALYSIS & PRESENTATION
Chapter 10-DATA ANALYSIS & PRESENTATIONChapter 10-DATA ANALYSIS & PRESENTATION
Chapter 10-DATA ANALYSIS & PRESENTATION
 
Quantitative Data Analysis
Quantitative Data AnalysisQuantitative Data Analysis
Quantitative Data Analysis
 
Qualitative data analysis
Qualitative data analysisQualitative data analysis
Qualitative data analysis
 

Similar to Quantitative data analysis

When to use, What Statistical Test for data Analysis modified.pptx
When to use, What Statistical Test for data Analysis modified.pptxWhen to use, What Statistical Test for data Analysis modified.pptx
When to use, What Statistical Test for data Analysis modified.pptxAsokan R
 
Statistics  What you Need to KnowIntroductionOften, when peop.docx
Statistics  What you Need to KnowIntroductionOften, when peop.docxStatistics  What you Need to KnowIntroductionOften, when peop.docx
Statistics  What you Need to KnowIntroductionOften, when peop.docxdessiechisomjj4
 
Need a nonplagiarised paper and a form completed by 1006015 before.docx
Need a nonplagiarised paper and a form completed by 1006015 before.docxNeed a nonplagiarised paper and a form completed by 1006015 before.docx
Need a nonplagiarised paper and a form completed by 1006015 before.docxlea6nklmattu
 
statisticscf_choose_a_statistical_test (1) (1).pptxIndependen.docx
statisticscf_choose_a_statistical_test (1) (1).pptxIndependen.docxstatisticscf_choose_a_statistical_test (1) (1).pptxIndependen.docx
statisticscf_choose_a_statistical_test (1) (1).pptxIndependen.docxrafaelaj1
 
statistical analysis.pptx
statistical analysis.pptxstatistical analysis.pptx
statistical analysis.pptxhayatalakoum1
 
Chapter 12Choosing an Appropriate Statistical TestiStockph.docx
Chapter 12Choosing an Appropriate Statistical TestiStockph.docxChapter 12Choosing an Appropriate Statistical TestiStockph.docx
Chapter 12Choosing an Appropriate Statistical TestiStockph.docxmccormicknadine86
 
Respond  using one or more of the following approachesAsk a pro
Respond  using one or more of the following approachesAsk a proRespond  using one or more of the following approachesAsk a pro
Respond  using one or more of the following approachesAsk a promickietanger
 
statistical analysis gr12.pptx lesson in research
statistical analysis gr12.pptx lesson in researchstatistical analysis gr12.pptx lesson in research
statistical analysis gr12.pptx lesson in researchCyrilleGustilo
 
Chapter 3 part1-Design of Experiments
Chapter 3 part1-Design of ExperimentsChapter 3 part1-Design of Experiments
Chapter 3 part1-Design of Experimentsnszakir
 
REVISION SLIDES 2.pptx
REVISION SLIDES 2.pptxREVISION SLIDES 2.pptx
REVISION SLIDES 2.pptxssuser0bb1f22
 
59172888 introduction-to-statistics-independent-study-requirements-2nd-sem-20...
59172888 introduction-to-statistics-independent-study-requirements-2nd-sem-20...59172888 introduction-to-statistics-independent-study-requirements-2nd-sem-20...
59172888 introduction-to-statistics-independent-study-requirements-2nd-sem-20...homeworkping3
 
Selection of appropriate data analysis technique
Selection of appropriate data analysis techniqueSelection of appropriate data analysis technique
Selection of appropriate data analysis techniqueRajaKrishnan M
 
Statistical test
Statistical test Statistical test
Statistical test As Siyam
 
BASIC STATISTICAL TREATMENT IN RESEARCH.pptx
BASIC STATISTICAL TREATMENT IN RESEARCH.pptxBASIC STATISTICAL TREATMENT IN RESEARCH.pptx
BASIC STATISTICAL TREATMENT IN RESEARCH.pptxardrianmalangen2
 
How to read a paper
How to read a paperHow to read a paper
How to read a paperfaheta
 

Similar to Quantitative data analysis (20)

When to use, What Statistical Test for data Analysis modified.pptx
When to use, What Statistical Test for data Analysis modified.pptxWhen to use, What Statistical Test for data Analysis modified.pptx
When to use, What Statistical Test for data Analysis modified.pptx
 
Statistics  What you Need to KnowIntroductionOften, when peop.docx
Statistics  What you Need to KnowIntroductionOften, when peop.docxStatistics  What you Need to KnowIntroductionOften, when peop.docx
Statistics  What you Need to KnowIntroductionOften, when peop.docx
 
Need a nonplagiarised paper and a form completed by 1006015 before.docx
Need a nonplagiarised paper and a form completed by 1006015 before.docxNeed a nonplagiarised paper and a form completed by 1006015 before.docx
Need a nonplagiarised paper and a form completed by 1006015 before.docx
 
statisticscf_choose_a_statistical_test (1) (1).pptxIndependen.docx
statisticscf_choose_a_statistical_test (1) (1).pptxIndependen.docxstatisticscf_choose_a_statistical_test (1) (1).pptxIndependen.docx
statisticscf_choose_a_statistical_test (1) (1).pptxIndependen.docx
 
statistical analysis.pptx
statistical analysis.pptxstatistical analysis.pptx
statistical analysis.pptx
 
Chapter 12Choosing an Appropriate Statistical TestiStockph.docx
Chapter 12Choosing an Appropriate Statistical TestiStockph.docxChapter 12Choosing an Appropriate Statistical TestiStockph.docx
Chapter 12Choosing an Appropriate Statistical TestiStockph.docx
 
Respond  using one or more of the following approachesAsk a pro
Respond  using one or more of the following approachesAsk a proRespond  using one or more of the following approachesAsk a pro
Respond  using one or more of the following approachesAsk a pro
 
Seminar in Meta-analysis
Seminar in Meta-analysisSeminar in Meta-analysis
Seminar in Meta-analysis
 
Parametric tests
Parametric testsParametric tests
Parametric tests
 
Berd 5-6
Berd 5-6Berd 5-6
Berd 5-6
 
statistical analysis gr12.pptx lesson in research
statistical analysis gr12.pptx lesson in researchstatistical analysis gr12.pptx lesson in research
statistical analysis gr12.pptx lesson in research
 
Chapter 3 part1-Design of Experiments
Chapter 3 part1-Design of ExperimentsChapter 3 part1-Design of Experiments
Chapter 3 part1-Design of Experiments
 
What is research
What is researchWhat is research
What is research
 
REVISION SLIDES 2.pptx
REVISION SLIDES 2.pptxREVISION SLIDES 2.pptx
REVISION SLIDES 2.pptx
 
59172888 introduction-to-statistics-independent-study-requirements-2nd-sem-20...
59172888 introduction-to-statistics-independent-study-requirements-2nd-sem-20...59172888 introduction-to-statistics-independent-study-requirements-2nd-sem-20...
59172888 introduction-to-statistics-independent-study-requirements-2nd-sem-20...
 
t-test Parametric test Biostatics and Research Methodology
t-test Parametric test Biostatics and Research Methodologyt-test Parametric test Biostatics and Research Methodology
t-test Parametric test Biostatics and Research Methodology
 
Selection of appropriate data analysis technique
Selection of appropriate data analysis techniqueSelection of appropriate data analysis technique
Selection of appropriate data analysis technique
 
Statistical test
Statistical test Statistical test
Statistical test
 
BASIC STATISTICAL TREATMENT IN RESEARCH.pptx
BASIC STATISTICAL TREATMENT IN RESEARCH.pptxBASIC STATISTICAL TREATMENT IN RESEARCH.pptx
BASIC STATISTICAL TREATMENT IN RESEARCH.pptx
 
How to read a paper
How to read a paperHow to read a paper
How to read a paper
 

More from Ayuni Abdullah

Games in language learning opportunities and challenges
Games in language learning opportunities and challengesGames in language learning opportunities and challenges
Games in language learning opportunities and challengesAyuni Abdullah
 
Attitude of esl chinese students towards call
Attitude of esl chinese  students towards callAttitude of esl chinese  students towards call
Attitude of esl chinese students towards callAyuni Abdullah
 
Teach vocab with hypermedia
Teach vocab with hypermediaTeach vocab with hypermedia
Teach vocab with hypermediaAyuni Abdullah
 
Effect of denis n games and on vocabulary learning and strategies
Effect of denis n games and on vocabulary learning and strategiesEffect of denis n games and on vocabulary learning and strategies
Effect of denis n games and on vocabulary learning and strategiesAyuni Abdullah
 
Second draft exploring the effectiveness and perceptions of computer game bas...
Second draft exploring the effectiveness and perceptions of computer game bas...Second draft exploring the effectiveness and perceptions of computer game bas...
Second draft exploring the effectiveness and perceptions of computer game bas...Ayuni Abdullah
 
Questionnaire for mini research
Questionnaire for mini researchQuestionnaire for mini research
Questionnaire for mini researchAyuni Abdullah
 
An alternate reality game for language learning and multilingual motivation
An alternate reality game for language learning and multilingual motivationAn alternate reality game for language learning and multilingual motivation
An alternate reality game for language learning and multilingual motivationAyuni Abdullah
 
Mini research computer game based
Mini research computer game basedMini research computer game based
Mini research computer game basedAyuni Abdullah
 
Lecture 6 qualitative data analysis
Lecture 6 qualitative data analysisLecture 6 qualitative data analysis
Lecture 6 qualitative data analysisAyuni Abdullah
 
Qualitative data analysis pdf
Qualitative data analysis pdfQualitative data analysis pdf
Qualitative data analysis pdfAyuni Abdullah
 
Play games-or-study-computer-games-in-e books-to-learn-english-vocabulary-201...
Play games-or-study-computer-games-in-e books-to-learn-english-vocabulary-201...Play games-or-study-computer-games-in-e books-to-learn-english-vocabulary-201...
Play games-or-study-computer-games-in-e books-to-learn-english-vocabulary-201...Ayuni Abdullah
 
Vocabulary and grammar gain through computer
Vocabulary and grammar gain through computerVocabulary and grammar gain through computer
Vocabulary and grammar gain through computerAyuni Abdullah
 

More from Ayuni Abdullah (15)

Games in language learning opportunities and challenges
Games in language learning opportunities and challengesGames in language learning opportunities and challenges
Games in language learning opportunities and challenges
 
Attitude of esl chinese students towards call
Attitude of esl chinese  students towards callAttitude of esl chinese  students towards call
Attitude of esl chinese students towards call
 
Teach vocab with hypermedia
Teach vocab with hypermediaTeach vocab with hypermedia
Teach vocab with hypermedia
 
Effect of denis n games and on vocabulary learning and strategies
Effect of denis n games and on vocabulary learning and strategiesEffect of denis n games and on vocabulary learning and strategies
Effect of denis n games and on vocabulary learning and strategies
 
Second draft exploring the effectiveness and perceptions of computer game bas...
Second draft exploring the effectiveness and perceptions of computer game bas...Second draft exploring the effectiveness and perceptions of computer game bas...
Second draft exploring the effectiveness and perceptions of computer game bas...
 
Questionnaire for mini research
Questionnaire for mini researchQuestionnaire for mini research
Questionnaire for mini research
 
An alternate reality game for language learning and multilingual motivation
An alternate reality game for language learning and multilingual motivationAn alternate reality game for language learning and multilingual motivation
An alternate reality game for language learning and multilingual motivation
 
Mini research computer game based
Mini research computer game basedMini research computer game based
Mini research computer game based
 
Lecture 6 qualitative data analysis
Lecture 6 qualitative data analysisLecture 6 qualitative data analysis
Lecture 6 qualitative data analysis
 
Qualitative data analysis pdf
Qualitative data analysis pdfQualitative data analysis pdf
Qualitative data analysis pdf
 
chapter 1
chapter 1chapter 1
chapter 1
 
Chapter 2
Chapter 2Chapter 2
Chapter 2
 
Introduction chapter1
Introduction chapter1Introduction chapter1
Introduction chapter1
 
Play games-or-study-computer-games-in-e books-to-learn-english-vocabulary-201...
Play games-or-study-computer-games-in-e books-to-learn-english-vocabulary-201...Play games-or-study-computer-games-in-e books-to-learn-english-vocabulary-201...
Play games-or-study-computer-games-in-e books-to-learn-english-vocabulary-201...
 
Vocabulary and grammar gain through computer
Vocabulary and grammar gain through computerVocabulary and grammar gain through computer
Vocabulary and grammar gain through computer
 

Recently uploaded

Roles & Responsibilities in Pharmacovigilance
Roles & Responsibilities in PharmacovigilanceRoles & Responsibilities in Pharmacovigilance
Roles & Responsibilities in PharmacovigilanceSamikshaHamane
 
Judging the Relevance and worth of ideas part 2.pptx
Judging the Relevance  and worth of ideas part 2.pptxJudging the Relevance  and worth of ideas part 2.pptx
Judging the Relevance and worth of ideas part 2.pptxSherlyMaeNeri
 
Incoming and Outgoing Shipments in 3 STEPS Using Odoo 17
Incoming and Outgoing Shipments in 3 STEPS Using Odoo 17Incoming and Outgoing Shipments in 3 STEPS Using Odoo 17
Incoming and Outgoing Shipments in 3 STEPS Using Odoo 17Celine George
 
4.18.24 Movement Legacies, Reflection, and Review.pptx
4.18.24 Movement Legacies, Reflection, and Review.pptx4.18.24 Movement Legacies, Reflection, and Review.pptx
4.18.24 Movement Legacies, Reflection, and Review.pptxmary850239
 
AMERICAN LANGUAGE HUB_Level2_Student'sBook_Answerkey.pdf
AMERICAN LANGUAGE HUB_Level2_Student'sBook_Answerkey.pdfAMERICAN LANGUAGE HUB_Level2_Student'sBook_Answerkey.pdf
AMERICAN LANGUAGE HUB_Level2_Student'sBook_Answerkey.pdfphamnguyenenglishnb
 
MULTIDISCIPLINRY NATURE OF THE ENVIRONMENTAL STUDIES.pptx
MULTIDISCIPLINRY NATURE OF THE ENVIRONMENTAL STUDIES.pptxMULTIDISCIPLINRY NATURE OF THE ENVIRONMENTAL STUDIES.pptx
MULTIDISCIPLINRY NATURE OF THE ENVIRONMENTAL STUDIES.pptxAnupkumar Sharma
 
Full Stack Web Development Course for Beginners
Full Stack Web Development Course  for BeginnersFull Stack Web Development Course  for Beginners
Full Stack Web Development Course for BeginnersSabitha Banu
 
ANG SEKTOR NG agrikultura.pptx QUARTER 4
ANG SEKTOR NG agrikultura.pptx QUARTER 4ANG SEKTOR NG agrikultura.pptx QUARTER 4
ANG SEKTOR NG agrikultura.pptx QUARTER 4MiaBumagat1
 
Proudly South Africa powerpoint Thorisha.pptx
Proudly South Africa powerpoint Thorisha.pptxProudly South Africa powerpoint Thorisha.pptx
Proudly South Africa powerpoint Thorisha.pptxthorishapillay1
 
DATA STRUCTURE AND ALGORITHM for beginners
DATA STRUCTURE AND ALGORITHM for beginnersDATA STRUCTURE AND ALGORITHM for beginners
DATA STRUCTURE AND ALGORITHM for beginnersSabitha Banu
 
ENGLISH6-Q4-W3.pptxqurter our high choom
ENGLISH6-Q4-W3.pptxqurter our high choomENGLISH6-Q4-W3.pptxqurter our high choom
ENGLISH6-Q4-W3.pptxqurter our high choomnelietumpap1
 
Influencing policy (training slides from Fast Track Impact)
Influencing policy (training slides from Fast Track Impact)Influencing policy (training slides from Fast Track Impact)
Influencing policy (training slides from Fast Track Impact)Mark Reed
 
HỌC TỐT TIẾNG ANH 11 THEO CHƯƠNG TRÌNH GLOBAL SUCCESS ĐÁP ÁN CHI TIẾT - CẢ NĂ...
HỌC TỐT TIẾNG ANH 11 THEO CHƯƠNG TRÌNH GLOBAL SUCCESS ĐÁP ÁN CHI TIẾT - CẢ NĂ...HỌC TỐT TIẾNG ANH 11 THEO CHƯƠNG TRÌNH GLOBAL SUCCESS ĐÁP ÁN CHI TIẾT - CẢ NĂ...
HỌC TỐT TIẾNG ANH 11 THEO CHƯƠNG TRÌNH GLOBAL SUCCESS ĐÁP ÁN CHI TIẾT - CẢ NĂ...Nguyen Thanh Tu Collection
 
Gas measurement O2,Co2,& ph) 04/2024.pptx
Gas measurement O2,Co2,& ph) 04/2024.pptxGas measurement O2,Co2,& ph) 04/2024.pptx
Gas measurement O2,Co2,& ph) 04/2024.pptxDr.Ibrahim Hassaan
 
Procuring digital preservation CAN be quick and painless with our new dynamic...
Procuring digital preservation CAN be quick and painless with our new dynamic...Procuring digital preservation CAN be quick and painless with our new dynamic...
Procuring digital preservation CAN be quick and painless with our new dynamic...Jisc
 
GRADE 4 - SUMMATIVE TEST QUARTER 4 ALL SUBJECTS
GRADE 4 - SUMMATIVE TEST QUARTER 4 ALL SUBJECTSGRADE 4 - SUMMATIVE TEST QUARTER 4 ALL SUBJECTS
GRADE 4 - SUMMATIVE TEST QUARTER 4 ALL SUBJECTSJoshuaGantuangco2
 
Field Attribute Index Feature in Odoo 17
Field Attribute Index Feature in Odoo 17Field Attribute Index Feature in Odoo 17
Field Attribute Index Feature in Odoo 17Celine George
 
USPS® Forced Meter Migration - How to Know if Your Postage Meter Will Soon be...
USPS® Forced Meter Migration - How to Know if Your Postage Meter Will Soon be...USPS® Forced Meter Migration - How to Know if Your Postage Meter Will Soon be...
USPS® Forced Meter Migration - How to Know if Your Postage Meter Will Soon be...Postal Advocate Inc.
 
ISYU TUNGKOL SA SEKSWLADIDA (ISSUE ABOUT SEXUALITY
ISYU TUNGKOL SA SEKSWLADIDA (ISSUE ABOUT SEXUALITYISYU TUNGKOL SA SEKSWLADIDA (ISSUE ABOUT SEXUALITY
ISYU TUNGKOL SA SEKSWLADIDA (ISSUE ABOUT SEXUALITYKayeClaireEstoconing
 

Recently uploaded (20)

Roles & Responsibilities in Pharmacovigilance
Roles & Responsibilities in PharmacovigilanceRoles & Responsibilities in Pharmacovigilance
Roles & Responsibilities in Pharmacovigilance
 
Judging the Relevance and worth of ideas part 2.pptx
Judging the Relevance  and worth of ideas part 2.pptxJudging the Relevance  and worth of ideas part 2.pptx
Judging the Relevance and worth of ideas part 2.pptx
 
Incoming and Outgoing Shipments in 3 STEPS Using Odoo 17
Incoming and Outgoing Shipments in 3 STEPS Using Odoo 17Incoming and Outgoing Shipments in 3 STEPS Using Odoo 17
Incoming and Outgoing Shipments in 3 STEPS Using Odoo 17
 
4.18.24 Movement Legacies, Reflection, and Review.pptx
4.18.24 Movement Legacies, Reflection, and Review.pptx4.18.24 Movement Legacies, Reflection, and Review.pptx
4.18.24 Movement Legacies, Reflection, and Review.pptx
 
AMERICAN LANGUAGE HUB_Level2_Student'sBook_Answerkey.pdf
AMERICAN LANGUAGE HUB_Level2_Student'sBook_Answerkey.pdfAMERICAN LANGUAGE HUB_Level2_Student'sBook_Answerkey.pdf
AMERICAN LANGUAGE HUB_Level2_Student'sBook_Answerkey.pdf
 
MULTIDISCIPLINRY NATURE OF THE ENVIRONMENTAL STUDIES.pptx
MULTIDISCIPLINRY NATURE OF THE ENVIRONMENTAL STUDIES.pptxMULTIDISCIPLINRY NATURE OF THE ENVIRONMENTAL STUDIES.pptx
MULTIDISCIPLINRY NATURE OF THE ENVIRONMENTAL STUDIES.pptx
 
Full Stack Web Development Course for Beginners
Full Stack Web Development Course  for BeginnersFull Stack Web Development Course  for Beginners
Full Stack Web Development Course for Beginners
 
Raw materials used in Herbal Cosmetics.pptx
Raw materials used in Herbal Cosmetics.pptxRaw materials used in Herbal Cosmetics.pptx
Raw materials used in Herbal Cosmetics.pptx
 
ANG SEKTOR NG agrikultura.pptx QUARTER 4
ANG SEKTOR NG agrikultura.pptx QUARTER 4ANG SEKTOR NG agrikultura.pptx QUARTER 4
ANG SEKTOR NG agrikultura.pptx QUARTER 4
 
Proudly South Africa powerpoint Thorisha.pptx
Proudly South Africa powerpoint Thorisha.pptxProudly South Africa powerpoint Thorisha.pptx
Proudly South Africa powerpoint Thorisha.pptx
 
DATA STRUCTURE AND ALGORITHM for beginners
DATA STRUCTURE AND ALGORITHM for beginnersDATA STRUCTURE AND ALGORITHM for beginners
DATA STRUCTURE AND ALGORITHM for beginners
 
ENGLISH6-Q4-W3.pptxqurter our high choom
ENGLISH6-Q4-W3.pptxqurter our high choomENGLISH6-Q4-W3.pptxqurter our high choom
ENGLISH6-Q4-W3.pptxqurter our high choom
 
Influencing policy (training slides from Fast Track Impact)
Influencing policy (training slides from Fast Track Impact)Influencing policy (training slides from Fast Track Impact)
Influencing policy (training slides from Fast Track Impact)
 
HỌC TỐT TIẾNG ANH 11 THEO CHƯƠNG TRÌNH GLOBAL SUCCESS ĐÁP ÁN CHI TIẾT - CẢ NĂ...
HỌC TỐT TIẾNG ANH 11 THEO CHƯƠNG TRÌNH GLOBAL SUCCESS ĐÁP ÁN CHI TIẾT - CẢ NĂ...HỌC TỐT TIẾNG ANH 11 THEO CHƯƠNG TRÌNH GLOBAL SUCCESS ĐÁP ÁN CHI TIẾT - CẢ NĂ...
HỌC TỐT TIẾNG ANH 11 THEO CHƯƠNG TRÌNH GLOBAL SUCCESS ĐÁP ÁN CHI TIẾT - CẢ NĂ...
 
Gas measurement O2,Co2,& ph) 04/2024.pptx
Gas measurement O2,Co2,& ph) 04/2024.pptxGas measurement O2,Co2,& ph) 04/2024.pptx
Gas measurement O2,Co2,& ph) 04/2024.pptx
 
Procuring digital preservation CAN be quick and painless with our new dynamic...
Procuring digital preservation CAN be quick and painless with our new dynamic...Procuring digital preservation CAN be quick and painless with our new dynamic...
Procuring digital preservation CAN be quick and painless with our new dynamic...
 
GRADE 4 - SUMMATIVE TEST QUARTER 4 ALL SUBJECTS
GRADE 4 - SUMMATIVE TEST QUARTER 4 ALL SUBJECTSGRADE 4 - SUMMATIVE TEST QUARTER 4 ALL SUBJECTS
GRADE 4 - SUMMATIVE TEST QUARTER 4 ALL SUBJECTS
 
Field Attribute Index Feature in Odoo 17
Field Attribute Index Feature in Odoo 17Field Attribute Index Feature in Odoo 17
Field Attribute Index Feature in Odoo 17
 
USPS® Forced Meter Migration - How to Know if Your Postage Meter Will Soon be...
USPS® Forced Meter Migration - How to Know if Your Postage Meter Will Soon be...USPS® Forced Meter Migration - How to Know if Your Postage Meter Will Soon be...
USPS® Forced Meter Migration - How to Know if Your Postage Meter Will Soon be...
 
ISYU TUNGKOL SA SEKSWLADIDA (ISSUE ABOUT SEXUALITY
ISYU TUNGKOL SA SEKSWLADIDA (ISSUE ABOUT SEXUALITYISYU TUNGKOL SA SEKSWLADIDA (ISSUE ABOUT SEXUALITY
ISYU TUNGKOL SA SEKSWLADIDA (ISSUE ABOUT SEXUALITY
 

Quantitative data analysis

  • 1. QUANTITATIVE DATA ANALYSIS Let us commence our look at data analysis by looking at a hypothetical research study. Remember that there are different ways of approaching a research question and how we put together our research question will determine the type of methodology, data collection method, statistics, analysis and presentation that we will use to approach our research problem. Example of research question  Are females more likely to be nurses than males?  Is the proportion of males who are nurses the same as the proportion of females?  Is there a relationship between gender and becoming a nurse? In the example in the box above, you can see that there are three different ways of approaching the research problem, which is concerned with the relationship between males and females in nursing. Another research problem with variables
  • 2. In another research problem - the relationship between gender and smoking, there are 2 categorical variables(gender & smoker), with two or more categories in each, for example: Gender (male/female) Smoker (yes/no) You are looking for whether or not there is any significance in the results Reflection Before we proceed, you may want to briefly refresh your knowledge and understanding of some basics, namely:  hypothesis  randomised controlled double-blind trial  variables  descriptive statistical analysis  inferential statistical analysis To recap on statistics, read chapter 9 of the accompanying book, and/or click on the hyperlink below: statistics are fun Now to return to statistical analysis
  • 3. Alpha level (p level) In statistical analysis we are looking to see if there is any significance in the results. The acceptance or rejection of a hypothesis is based upon a level of significance – the alpha () level This is usually set at the 5% (0.05)  level, followed in popularity by the 1% (0.01)  level We usually designate these as p, i.e. p =0.05 or p = 0.01 So, what do we mean by levels of significance that the 'p' value can give us? Statistical tests There are many tests that we can use to analyse our data, and which particular one we use to analyse our data depends upon what we are looking for, and what data we collected (and how we collected it). Below are just a few of the more common ones that you may come across in research papers. Mann-Whitney U-test This test is used to test for differences between 2 independent groups on a continuous measure, e.g. do
  • 4. males and females differ in terms of their levels of self- esteem. This test requires two variables (e.g. male/female gender) and one continuous variable (e.g. self-esteem). It actually compares medians. It converts the scores on the continuous variable to ranks, across the two groups. It then evaluates whether the medians for the two groups differ significantly. Spearman rank correlation test This test is used to demonstrate the relationship between two ranked variables Frequently used to compare judgements by a group of judges on two objects, or the scores of a group of subjects on two measures. This is a coefficient correlation based on ranks. It shows the association between two variables (X and Y), which are not normally distributed.
  • 5. Don’t worry about the details – just remember that it is an acceptable method for parametric data when there are less than 30 but more than 9 paired variables. Kruskal-Wallis test This test is used to compare the means among more than two samples, when either the data are ordinal or the distribution is not normal. If there are only two groups then it is the equivalent of the Mann-Whitney U-test, so you may as well use that test. This test would normally be used when you wanted to determine the significance of difference among three or more groups. Below is a very brief look at other common tests - for more information on statistical tests, read chapter 9 of the accompanying book. Other Common Statistical Tests/Procedures
  • 6. t-test The t-test assesses whether the means of two groups are statisticallydifferent from each other. This analysis is appropriate whenever you want to compare the means of two groups. Pearson Correlation We use the Pearson's correlation in order to find a correlation between at least two continuous variables. The value for such a correlation lies between 0.00 (no correlation) and 1.00 (perfect correlation). ANOVA (Analysis of Variance) ANOVA is one of a number of tests (ANCOVA - analysis of covariance - and MANOVA - multivariate analysis of variance) that are used to describe/compare the relationship among a number of groups.
  • 7. Chi-square test There are two different types of chi-square tests - but both involve categorical data (Pallant 2001). One type of chi-square test compares the frequency count of what is expected in theory against what is actually observed. The second type of chi-square test is known as a chi-square test with two variables or the chi-square test for independence. Wilcoxon signed-rank test This is the most common nonparametric test for the two-sampled repeated measures design of research study, and is also known as the Wilcoxon matched-pairs test. This has just been a very brief look at some of the more common statistical tests for the analysis of data obtained from quantitative research - more details are given in chapter 9 of the accompanying book. There are, of course, many others, and any good statistics book will have details of them. Selecting your statistical test
  • 8. When it comes to the selection of the appropriate test for your research in order to determine the p-value, you need to base the selection of four major factors, namely:  The level of data (nominal, ordinal, ratio, or interval).  The number of groups/samples in your research study (one, two, or more).  Were the data collected from independent groups/samples or from related groups? Remember that independent groups are two or more separated groups of participants, whilst related groups are often the same group, but at a different time in the study, e.g. pre- and post-testing, or even a different environment.  The characteristics of the data (i.e. the distribution of the data). Now all these statistical tests may look very complicated, but if ever you are involved in quantitative research and have to do statistical analysis, don't worry because help is at hand. There is a computer package for statistical analysis known as SPSS SPSS stands for: Statistical Package for Social Sciences
  • 9. SPSS is one of a number of computer packages that can do just about any calculation that you want, using any statistical test. Before we finish this section, we just need to remind you to be careful when you are looking at research that uses statistics. Limitations of research study/data/statistical tests Always look for these – the researchers should reflect on their study and discuss anything that did not make it perfect, for example:  size of sample  tests used  initial question It is easy to tie yourself up into knots when either doing statistics as part of your research, or when reading research papers, so remember two things: 1. Keep things simple 2. Statistics by themselves are meaningless, it is the analysis and discussion of statistics which makes them meaningful and brings them to life. Finally
  • 10. The time has come for you to decide which statistical test you will be using for your own quantitative research. As we keep mentioning, if all this is new to you, do not hesitate to seek the advice of an experienced quantitative researcher and/or a statistician - at as early a stage as possible. TO DO Click on to the icon below for the example of a quantitative research study proposal:  When you are satisfied that you have the correct statistical test(s), and you can justify it/them, then write them into your research proposal.