The exposure index (EI) measures the amount of exposure received by the image receptor and is dependent on mAs, detector area, and beam attenuation. It indicates image quality, with manufacturers recommending an optimal EI range. EI can be compared to film speed and blackening in film-screen radiography. Different manufacturers calculate EI differently, resulting in variable ranges and definitions that are not comparable across systems. Standardization efforts aim to define EI proportional to air kerma exposure.
DEMONSTRATION LESSON IN ENGLISH 4 MATATAG CURRICULUM
Exposure index
1. Exposure IndexThis is a featured page
Exposure index (EI) is the measure of the amount of exposure received by the
image receptor (IR). It is dependent on mAs, total detector area irradiated, and
beam attenuation. The exposure index is indicative of the image quality. Equipment
manufacturers provide a recommended EI range for optimal image quality
(Bontrager & Lampignano, 2005, p. 52).
EI in digital radiography can be compared to film speed and blackening in film-
screen. When film was used, the accuracy of the exposure was obvious based on
the appearance of the image. Digital systems post-process images and display
adequate contrast and brightness at a much wider range. Therefore, adequate
exposure can only be assessed through image noise or burn-out. Secondary
workstations such as those used by technologists for image review, are often of
lower resolution and brightness than those used for diagnosis. Because of this, it is
often difficult to assess whether an image is noisy or not. The exposure index is
meant to be an indication of whether the noise levels are acceptable (AAPM,
2009).
Errors in the calculation can occur resulting in an inaccurate EI. This can arise
when the software fails in determining which part of the image is the patient
anatomy, for example, in the presence of gonadal shielding or prosthesis. EI
cannot be solely relied on, therefore the technologist must remain critical of the
appearance of the image and the accuracy of the EI (AAPM, 2009).
EI is derived from the mean detector entrance exposure which is derived from the
mean pixel value of the image. Most systems use a histogram analysis in order to
calculate the mean pixel value (Neitzel, 2004, p. S231).
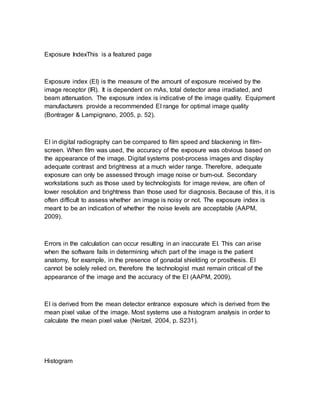
Histogram
2. This is a histogram created from an AP pelvis radiograph. The x-axis represents
the pixel value while the y-axis represents the number of pixels with that value. The
mean pixel value here is 104.381.
Although EI is always derived from the IR exposure, equipment manufacturers
calculate the numeric value differently, resulting in different ranges and definitions
(Carlton & Adler, 2006, p. 367; Neitzel, 2004, p. S231). Also, there is variation
between units purchased from the same manufacturer based on different IRs and
software (Carlton & Adler, 2006, p. 367). Different IRs have different detective
quantum efficiency (DQE). A high DQE results in lower noise levels (AAPM, 2009,
p. 3). Therefore, all systems have a different index and are difficult to compare
across systems.
Fuji CR
Fuji uses a sensitivity number (S) that is related to the amount of amplification
required by the photomultiplier tube to adjust the digital image. S is inversely
proportional to exposure. Properly exposed images should have an S between
150-250 (Carlton & Adler, 2006, p. 367).
Kodak CR
Kodak uses the term Exposure Index, which is directly proportional to exposure.
Properly exposed images should have an EI between 1,800-2,200 (Carlton &
Adler, 2006, p. 367). A change of 300 in the EI indicates a change of a factor of 2
in the exposure to the IR.
Agfa CR
3. Agfa uses log median exposure (LgM). This system compares the exposure level
of the image to a baseline established for the department. Since it is based on a
log system, an increase of 0.3 means the dose was doubled (Carlton & Adler,
2006, p. 367). An optimal exposure lies between 1.9 and 2.5.
Philips DR
Philips uses an EI that is inversely proportional to exposure. This index is
represented in bigger discrete steps (eg., 100, 125, 160, 200, 250, 320, 400, 500,
etc). Each step requires a 25% change in exposure to occur (AAPM, 2009). An
optimal exposure lies between 200 and 800.
Imaging Dynamics DR
Imaging Dynamics uses f#. The f# compares the exposure to an established target
exposure. Negative values represent underexposure, while positive values indicate
overexposure (AAPM, 2009).
Canon DR
Canon uses a reached exposure value (REX). REX is a function of the brightness
and contrast as selected by the operator (AAPM, 2009).
GE DR
GE uses the detector exposure index (DEI) which compares the detector exposure
to the expected exposure value (AAPM, 2009).
4. Siemens
Siemens uses an Exposure Index (EXI). EXI is calculated by dividing the field into
a 3x3 matrix and assessing only the central segment, and is based on the selected
organ program. EXI is directly proportional to dose. Doubling dose doubles the
EXI. EXI depends on organ program, whether manual exposure or AEC was used,
and the measuring field (AAPM, 2009).
Future Developments
In 2008, the International Electrotechnical Commission (IEC) developed and
published the International Standard IEC 62494-1 on the definition and scaling of
the exposure index for digital radiography. According to the standard the EI shall
be proportional to the exposure (air kerma) and shall be scaled as EI = 100 * X,
where X is the air kerma at the detector, at the calibration beam quality. It is
expected that this standard definition will be implemented in future digital
radiography systems.
The American Association of Physicists in Medicine (2009), published a document
in July, 2009 with the purpose of identifying a standard index which reflects the
adequacy of the exposure received by the IR.
References
American Association of Physicists in Medicine. (2009). An Exposure Indicator for
Digital Radiography. Retrieved from http://www.aapm.org/pubs/reports/rpt_116.pdf
Bontrager, K. L., & Lampignano, J. P. (2005). Textbook of radiographic positioning
and related anatomy (6th ed.). Elsevier Science.
5. Carlton, R. R. & Adler, A. M. (2005). Principles of radiographic imaging: An art and
a science. Delmar Learning.
International Electrotechnical Commission (2008). IEC 62494-1 ed. 1 Medical
electrical equipment - Exposure index of digital x-ray imaging systems - Part 1:
Definitions and requirements for general radiography
Neitzel, U. (2004). Management of pediatric radiation dose using Philips digital
radiography. Pediatric Radiology, 34(Suppl 3), S227-S233.
Related Links
•PACEMAN - Image Evaluation technique
•Exposure Chart
eliseleblanc
eliseleblanc Latest page update: made by eliseleblanc , Feb 4 2011, 1:47 PM EST
(about this update eliseleblanc
- complete history)
6. Keyword tags: exposure index exposure indicator image quality S number
More Info: links to this page