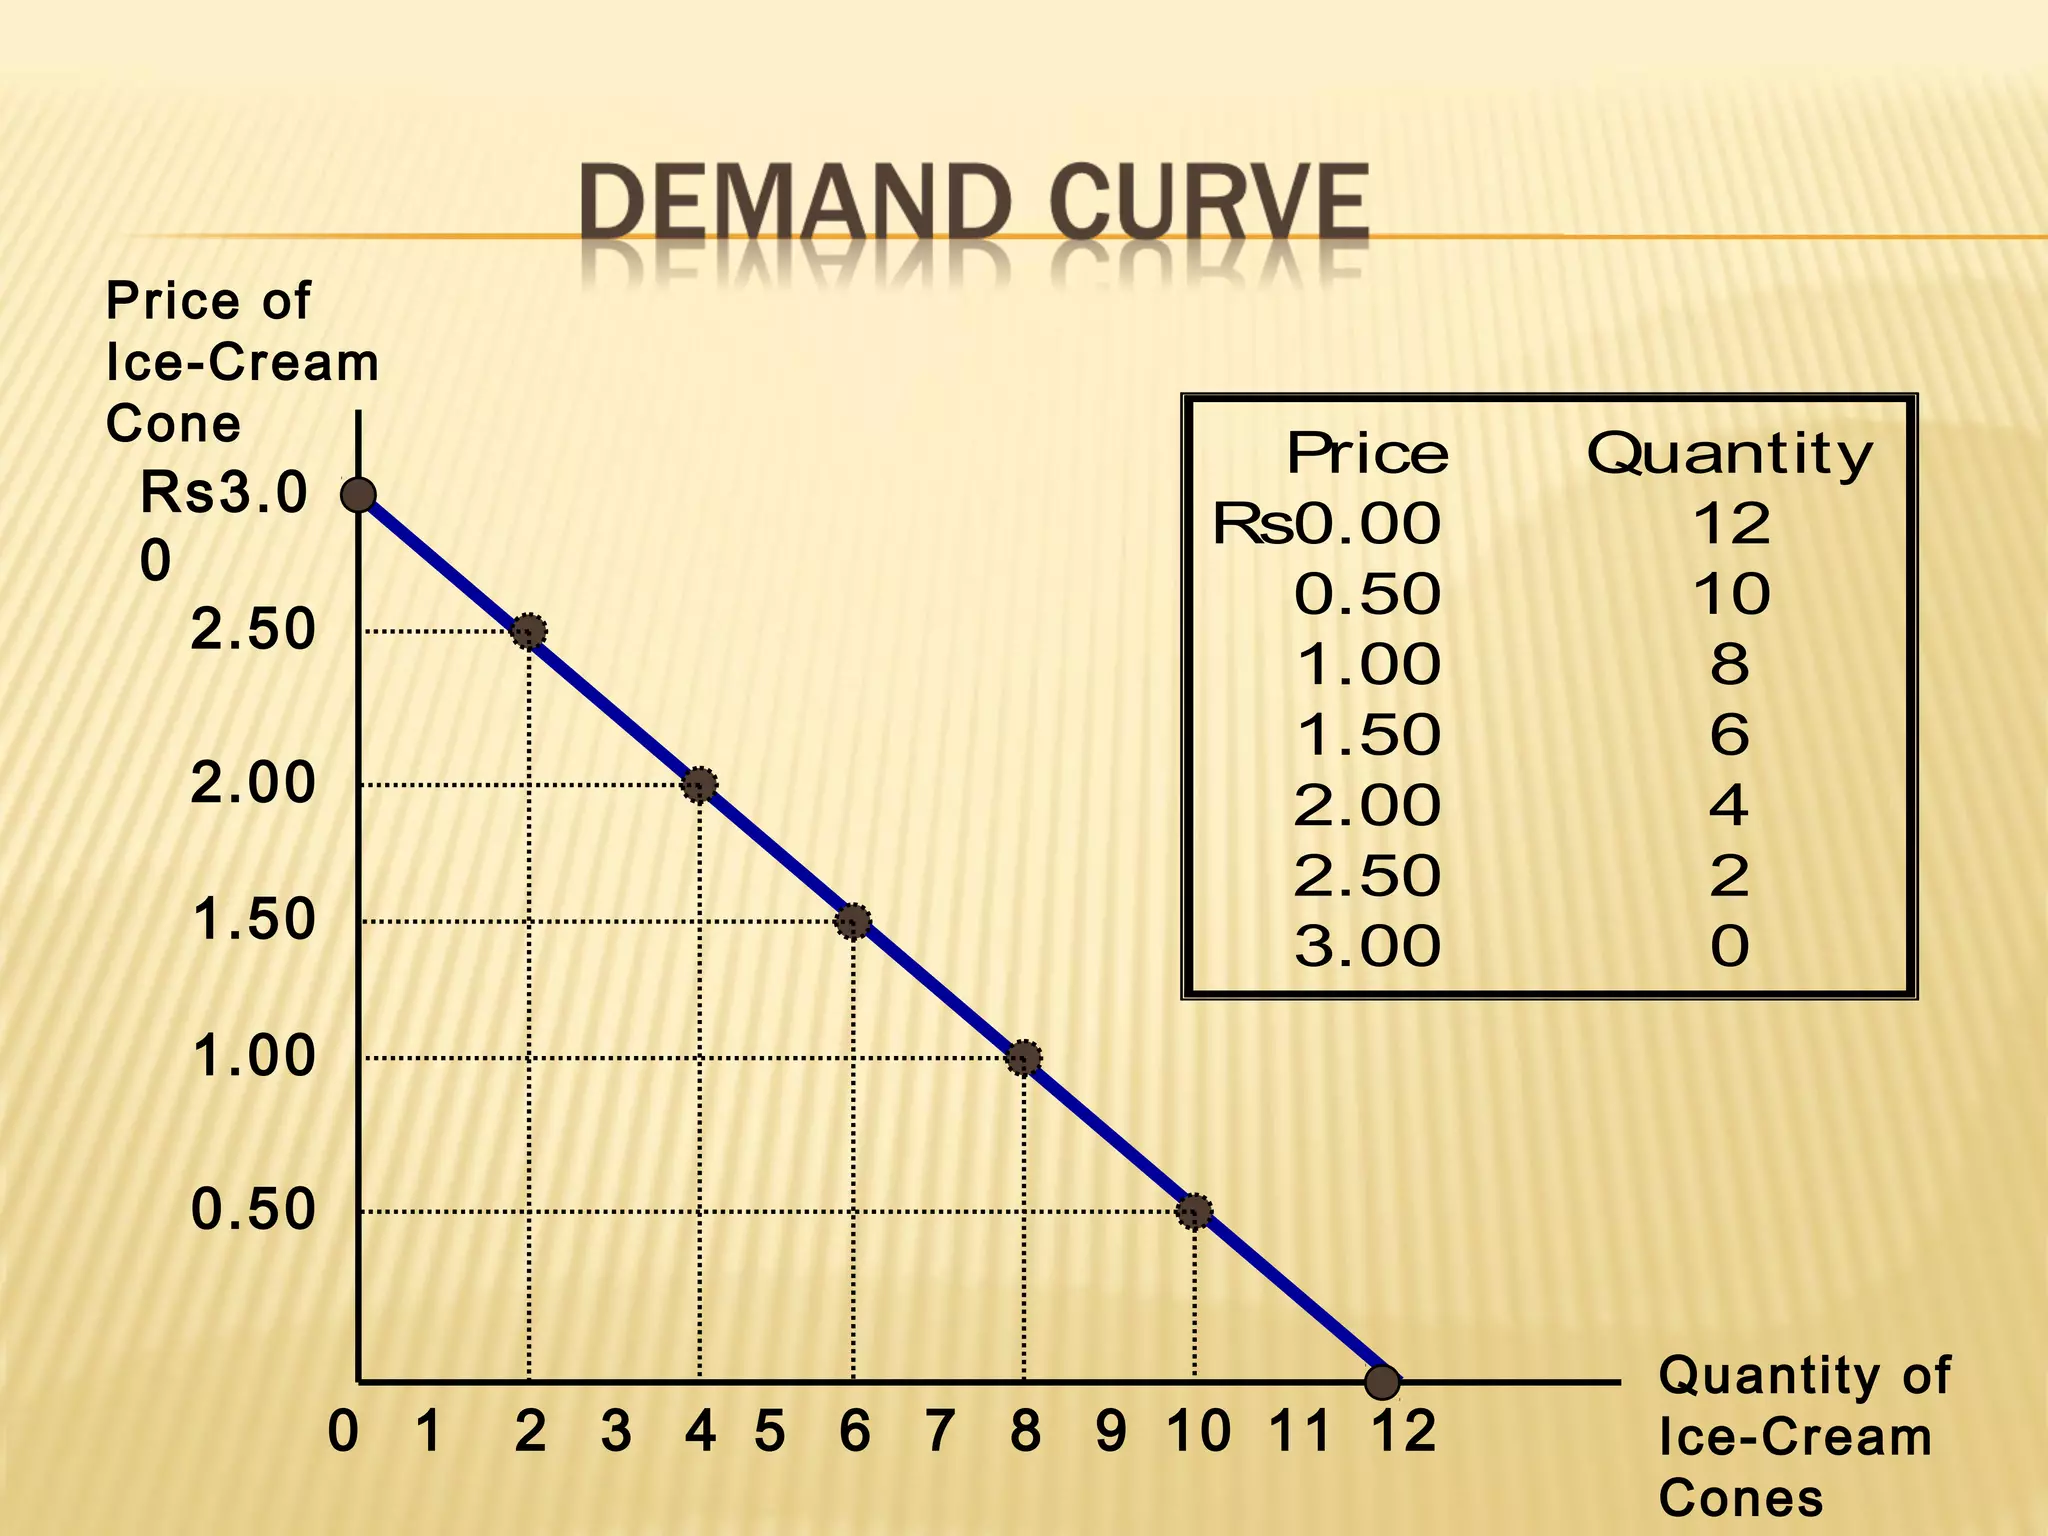
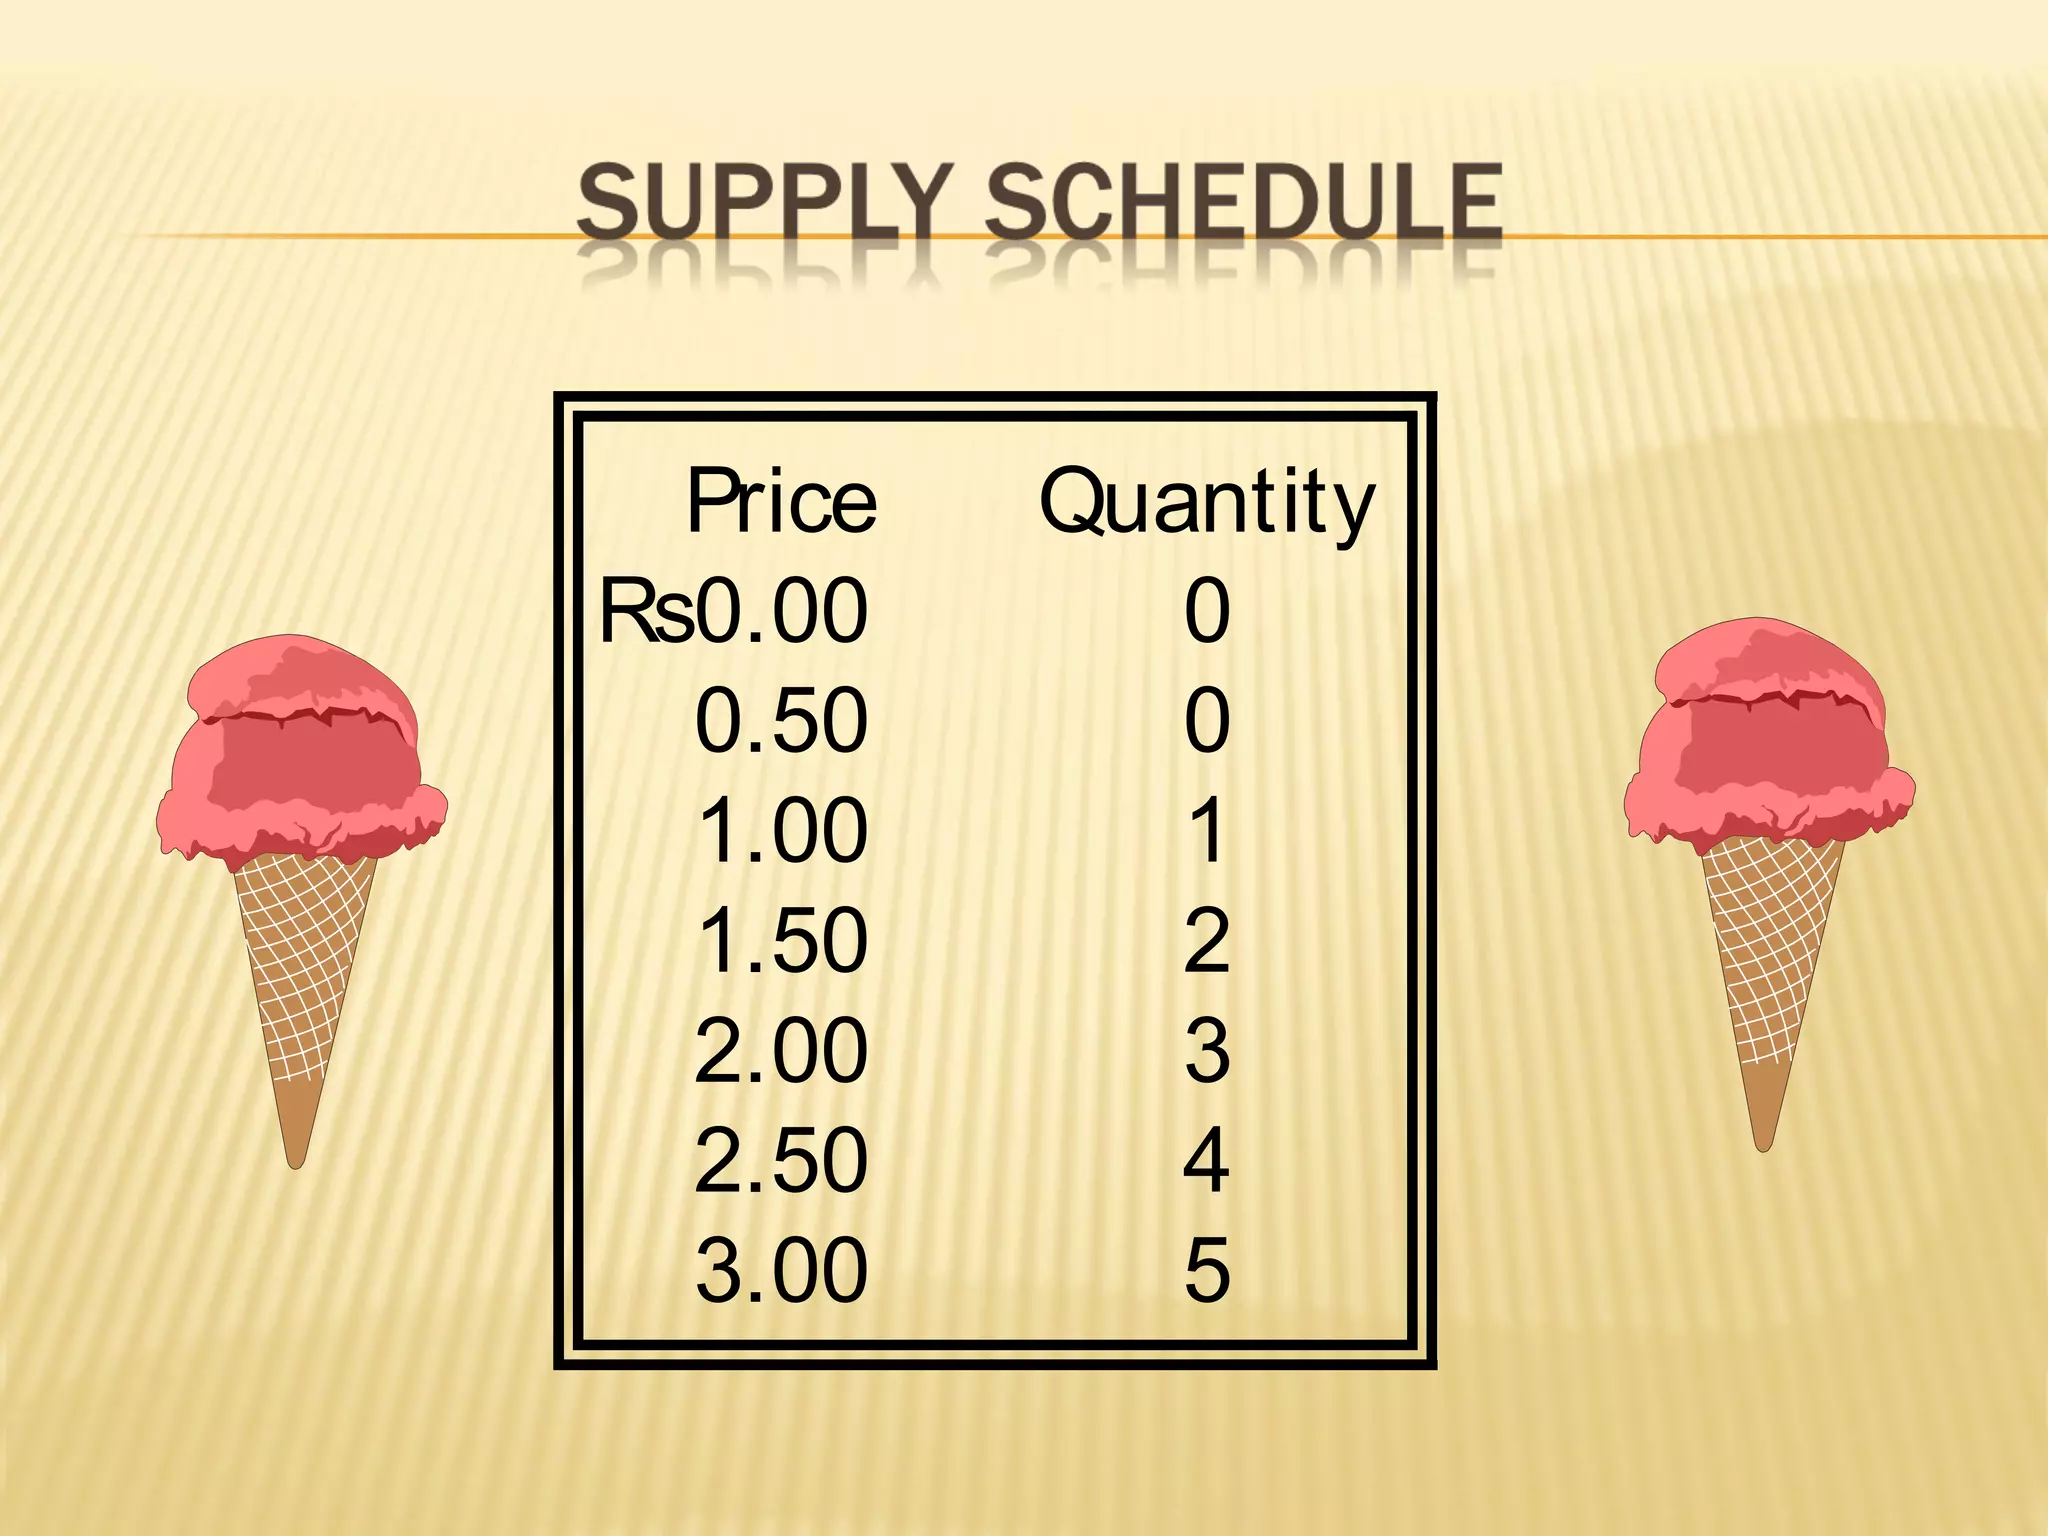
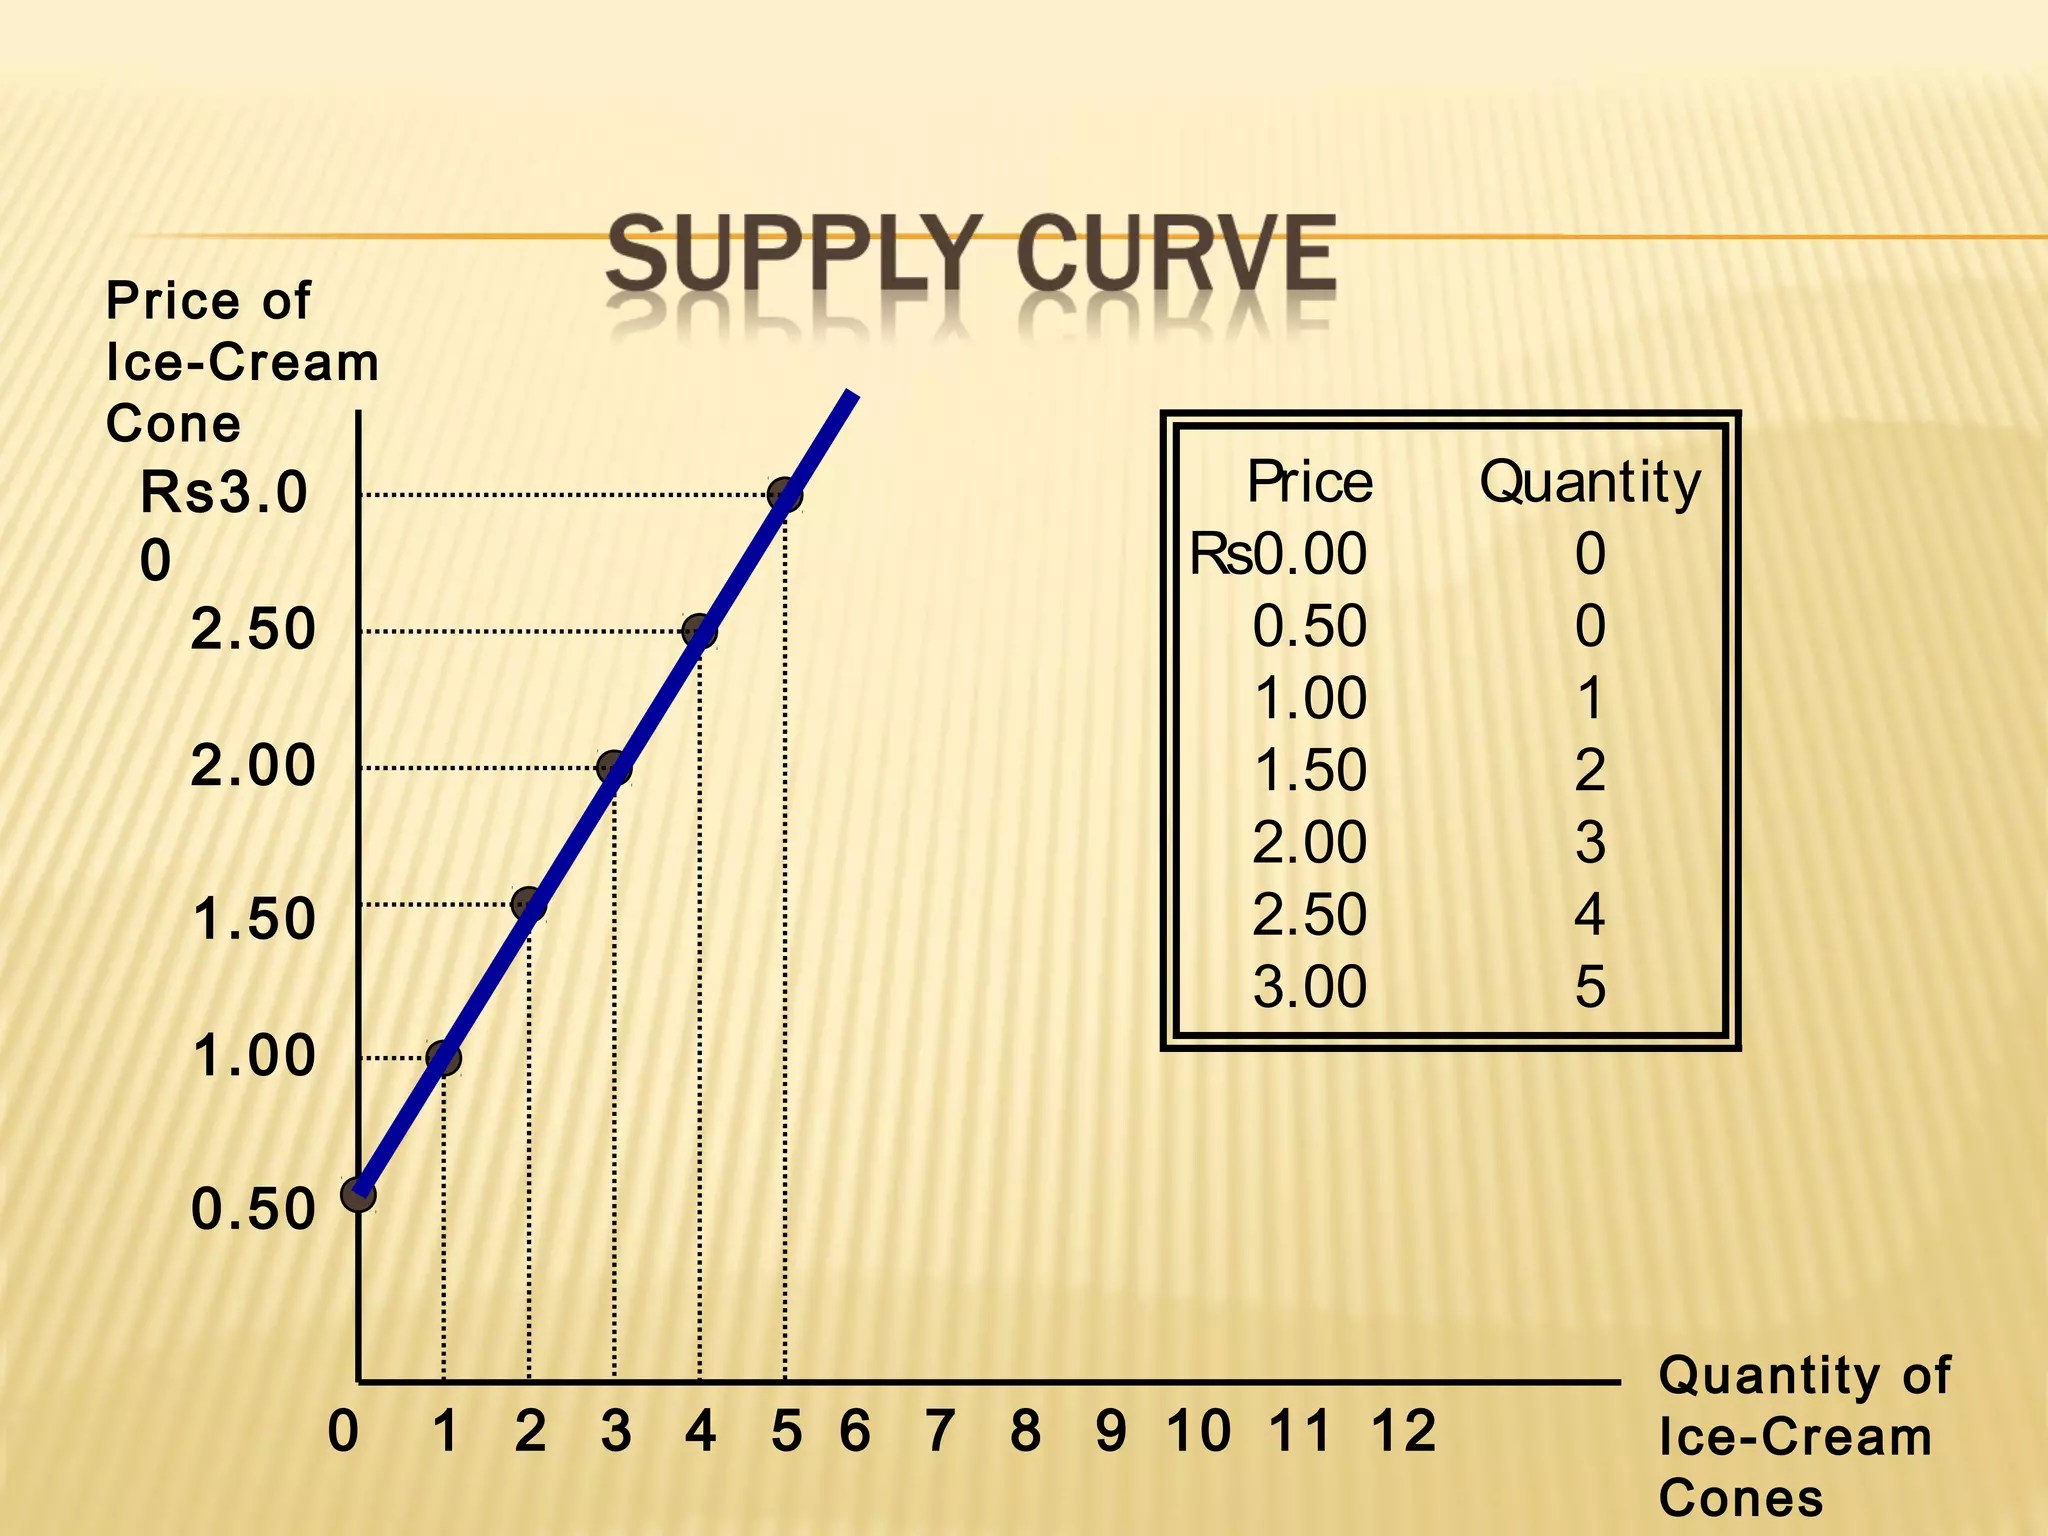
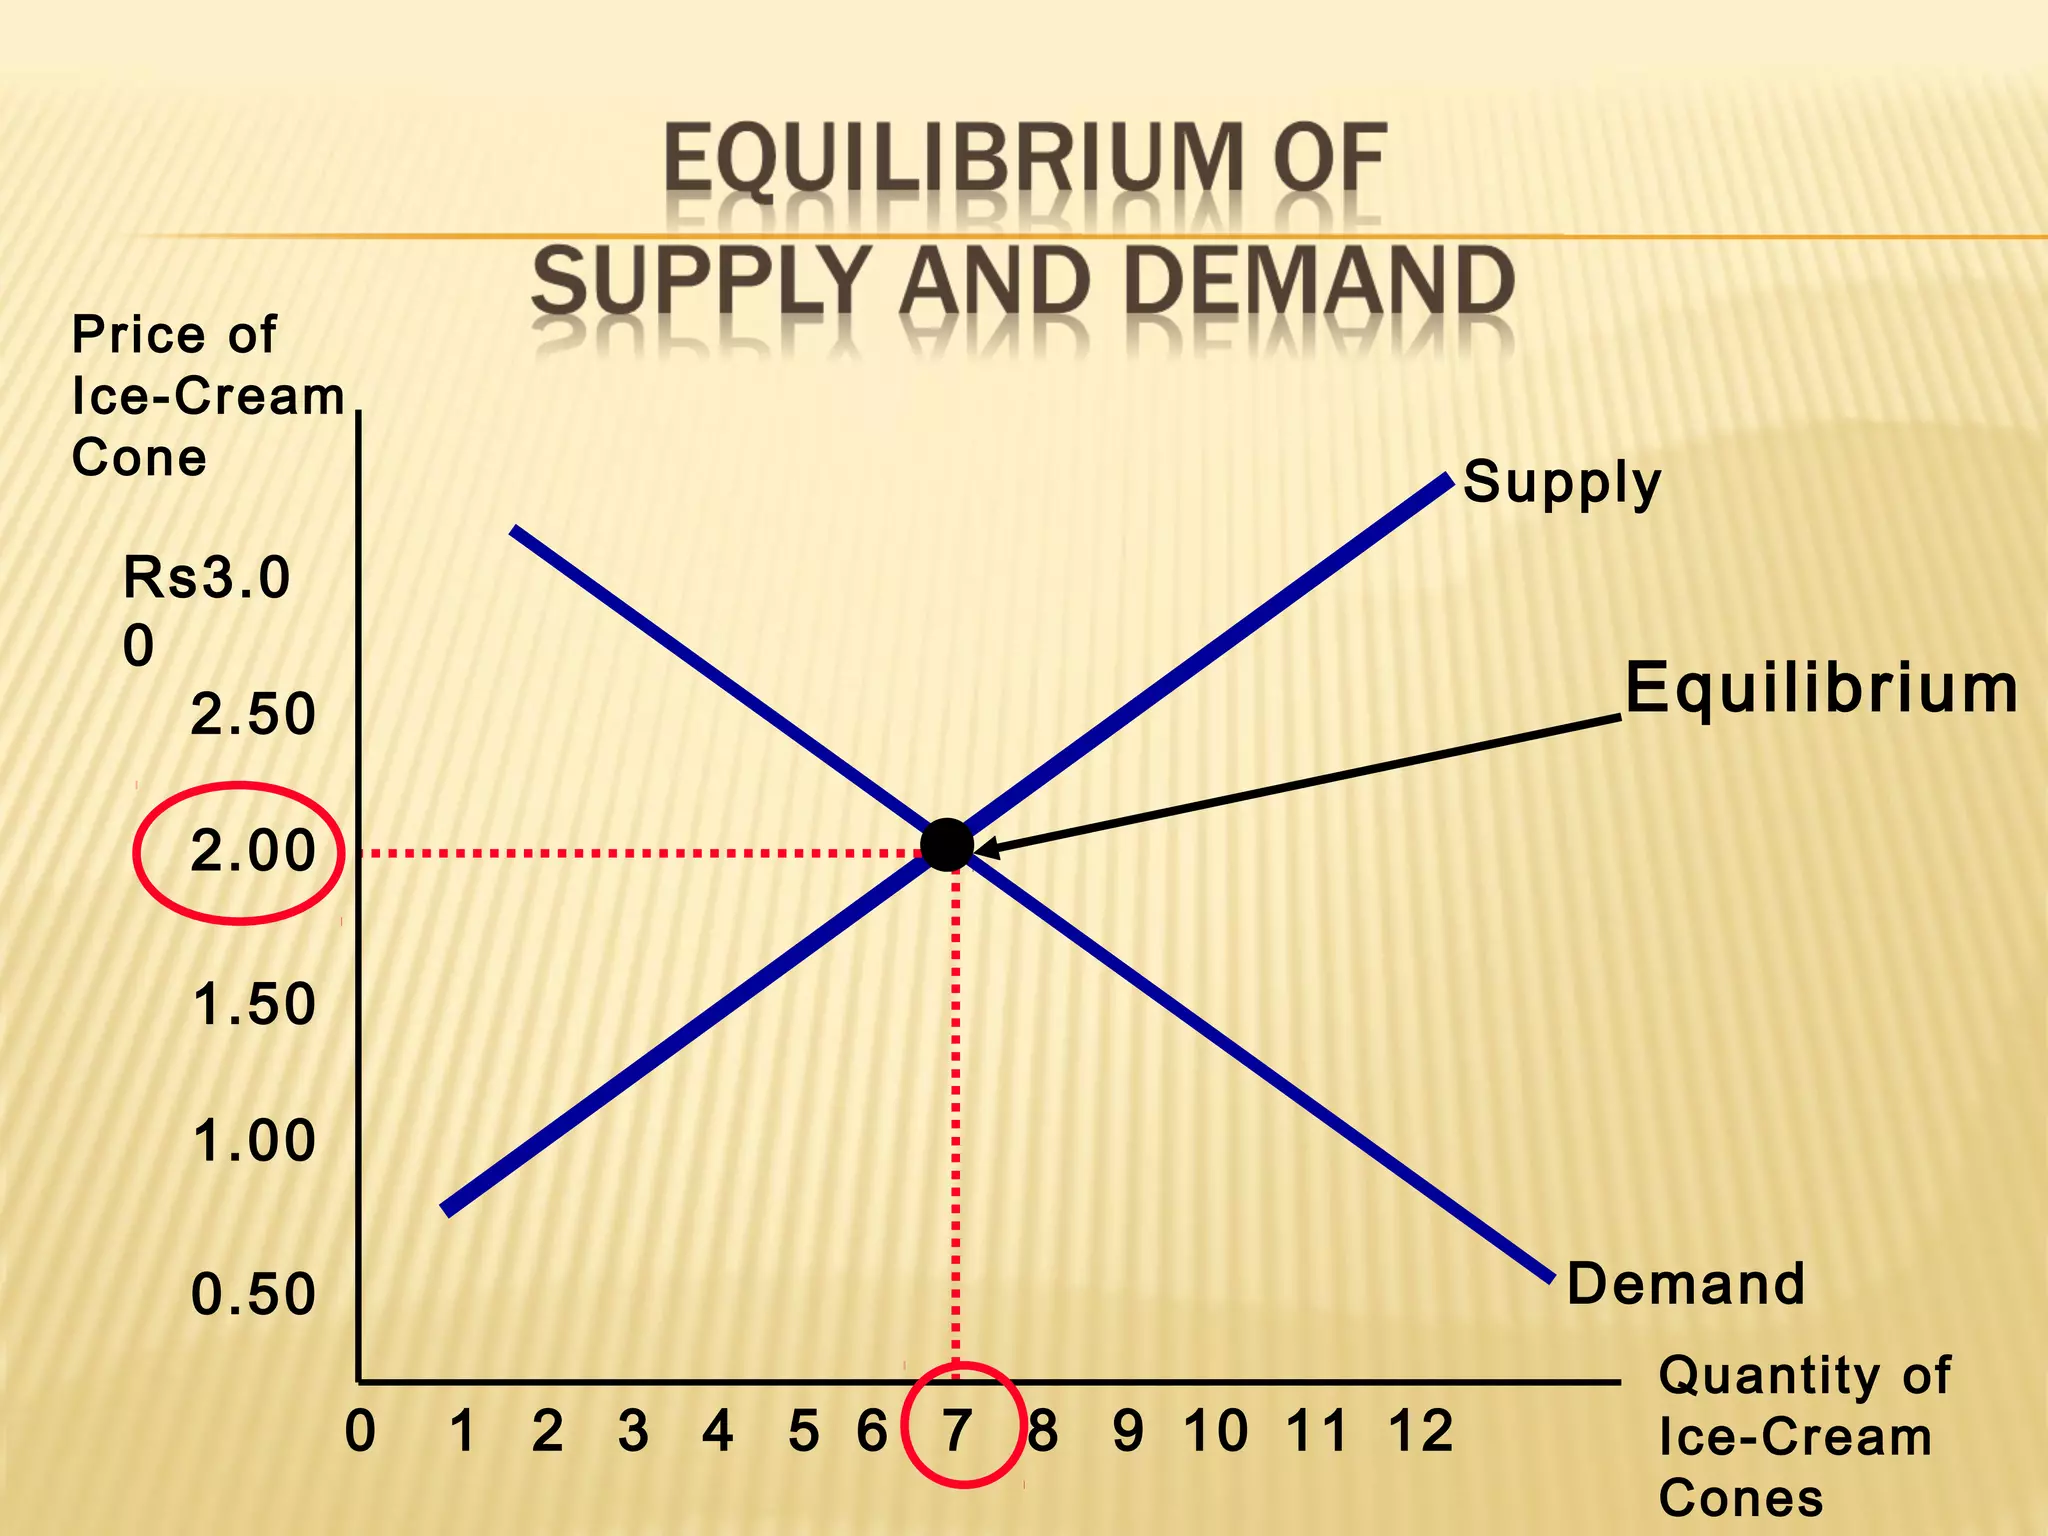
Supply and demand are the two words
that economists use most often.
Supply and demand are the forces that
make market economies work.
Modern microeconomics is about
supply, demand, and market
equilibrium.
A market is a group of buyers and
sellers of a particular good or service.
The terms supply and demand refer to
the behavior of people . . . as they
interact with one another in markets.
Buyers determine demand.
Sellers determine supply.
A competitive market is a market. . .
…with many buyers and sellers.
…that is not controlled by any one person.
…in which a narrow range of prices are
established that buyers and sellers act upon.
Products are the same
Numerous buyers and sellers so that each
has no influence over price
Buyers and Sellers are price takers
Perfect Competition
Monopoly
One seller, and seller controls price
Oligopoly
Few sellers
Not always aggressive competition
Monopolistic Competition
Many sellers
Slightly differentiated products
Each seller may set price for its own
product
Quantity demanded
is the amount
of a good that buyers are
willing and able
to purchase.
Price demand:
Refers to the various quantities of goods and
services that a consumer would purchase at a given
time in a market at various hypothetical prices.
Income demand:
Refers to the various quantities of goods and
services which would be purchased by the
consumers at various levels of income.
Cross demand:
Means the quantities of goods and services which
will be purchased with reference to change in price
not of this good but of other inter-related goods.
The law of demand states that
there is an inverse
relationship between price
and quantity demanded.
The demand schedule is a table
that shows the relationship
between the price of the good
and the quantity demanded.
Price Quantity
Rs0.00 12
0.50 10
1.00 8
1.50 6
2.00 4
2.50 2
3.00 0
Average income
Size of the market
Prices of related goods
Tastes or preferences
Expectations
Distinction
The demand curve is the downward-
sloping line relating price to quantity
demanded.
Rs3.0
0
2.50
2.00
1.50
1.00
0.50
21 3 4 5 6 7 8 9 10 1211
Price of
Ice-Cream
Cone
Quantity of
Ice-Cream
Cones
0
Price Quantity
Rs0.00 12
0.50 10
1.00 8
1.50 6
2.00 4
2.50 2
3.00 0
Substitution effect: when the price of
good rises, we substitute other
similar goods for it.
Income effect: when prices price
goes up we find ourselves poorer
than we were before.
Ceteris paribus is a Latin phrase that
means all variables other than the
ones being studied are assumed to
be constant. Literally, ceteris paribus
means “other things being equal.”
The demand curve slopes downward
because, ceteris paribus, lower prices
imply a greater quantity demanded!
Market demand refers to the sum of
all individual demands for a
particular good or service.
Graphically, individual demand
curves are summed horizontally to
obtain the market demand curve.
Change in Quantity Demanded
Movement along the demand curve.
Caused by a change in the price of
the product.
0
D1
Price of
Cigarettes
per Pack
Number of Cigarettes
Smoked per Day
A tax that raises the
price of cigarettes
results in a movement
along the demand
curve.
A
C
20
2.00
Rs4.0
0
12
Change in Demand
A shift in the demand curve, either to the
left or right.
Caused by a change in a
determinant other than the price.
0
D1
Price of
Ice-Cream
Cone
Quantity of
Ice-Cream
Cones
D3
D2
Increase in
demand
Decrease in
demand
As income increases the demand
for a normal good will increase.
As income increases the demand
for an inferior good will decrease.
Rs3.0
0
2.50
2.00
1.50
1.00
0.50
21 3 4 5 6 7 8 9 10 1211
Price of
Ice-Cream
Cone
Quantity of
Ice-Cream
Cones
0
Increase
in demand
An
increase in
income...
D1
D2
Rs3.00
2.50
2.00
1.50
1.00
0.50
21 3 4 5 6 7 8 9 10 1211
Price of
Ice-Cream
Cone
Quantity of
Ice-Cream
Cones
0
Decrease
in demand
An
increase in
income...
D1D2
When a fall in the price of one good
reduces the demand for another good,
the two goods are called substitutes.
When a fall in the price of one good
increases the demand for another
good, the two goods are called
complements.
Quantity supplied is the amount of a
good that sellers are willing and able
to sell.
The law of supply states that there is a
direct (positive) relationship between
price and quantity supplied.
Market price
Cost of production(inputs)
Technology
Expectations
Government policies
Special influences
Number of producers
The supply schedule is a table that
shows the relationship between the
price of the good and the quantity
supplied.
Price Quantity
Rs0.00 0
0.50 0
1.00 1
1.50 2
2.00 3
2.50 4
3.00 5
The supply curve is the upward-sloping
line relating price to quantity
supplied.
Rs3.0
0
2.50
2.00
1.50
1.00
0.50
21 3 4 5 6 7 8 9 10 1211
Price of
Ice-Cream
Cone
Quantity of
Ice-Cream
Cones
0
Price Quantity
Rs0.00 0
0.50 0
1.00 1
1.50 2
2.00 3
2.50 4
3.00 5
Market supply refers to the sum of all
individual supplies for all sellers of a
particular good or service.
Graphically, individual supply curves
are summed horizontally to obtain
the market supply curve.
Change in Quantity Supplied
Movement along the supply curve.
Caused by a change in the market price of
the product.
1 5
Price of
Ice-Cream
Cone
Quantity of
Ice-Cream
Cones
0
S
1.00
A
C
Rs3.00 A rise in the price
of ice cream cones
results in a
movement along
the supply curve.
Change in Supply
A shift in the supply curve, either to the
left or right.
Caused by a change in a determinant
other than price.
Price of
Ice-Cream
Cone
Quantity of
Ice-Cream
Cones
0
S1 S2
S3
Increase in
Supply
Decrease
in Supply
Market Equilibrium
 Market Equilibrium comes at that price and
quantity where the forces of supply and
demand are in balance.
 The equilibrium price is also called the
market-clearing price.
Equilibrium Price
The price that balances supply and demand.
On a graph, it is the price at which the supply
and demand curves intersect.
Equilibrium Quantity
The quantity that balances supply and demand.
On a graph it is the quantity at which the supply
and demand curves intersect.
Price Quantity
Rs0.00 0
0.50 0
1.00 1
1.50 4
2.00 7
2.50 10
3.00 13
Price Quantity
Rs0.00 19
0.50 16
1.00 13
1.50 10
2.00 7
2.50 4
3.00 1
Demand
Schedule
Supply Schedule
At Rs.2.00, the quantity demanded is
equal to the quantity supplied!
Supply
Demand
Price of
Ice-Cream
Cone
Quantity of
Ice-Cream
Cones
21 3 4 5 6 7 8 9 10 12110
Rs3.0
0
2.50
2.00
1.50
1.00
0.50
Equilibrium
Price of
Ice-Cream
Cone
Quantity of
Ice-Cream
Cones
21 3 4 5 6 7 8 9 10 12110
Rs3.0
0
2.50
2.00
1.50
1.00
0.50
Supply
Demand
Surplus
When the price is above the equilibrium price, the
quantity supplied exceeds the quantity demanded.
There is excess supply or a surplus. Suppliers will
lower the price to increase sales, thereby moving
toward equilibrium.
Quantity of
Ice-Cream Cones
Price of
Ice-Cream
Cone
Rs2.00
0 1 2 3 4 5 6 7 8 9 10 11 12 13
Supply
Demand
Rs1.50
Shortage
When the price is below the equilibrium price, the
quantity demanded exceeds the quantity supplied.
There is excess demand or a shortage. Suppliers
will raise the price due to too many buyers chasing
too few goods, thereby moving toward equilibrium.
Price of
Ice-Cream
Cone
2.00
0 7 Quantity of
Ice-Cream Cones
Supply
Initial
equilibrium
D1
1. Hot weather increases
the demand for ice cream...
D2
2. ...resulting
in a higher
price...
Rs2.50
10
3. ...and a higher
quantity sold.
New equilibrium
A shift in the supply curve is called a change
in supply.
A movement along a fixed supply curve is
called a change in quantity supplied.
A shift in the demand curve is called a
change in demand.
A movement along a fixed demand curve is
called a change in quantity demanded.
S2
Price of
Ice-Cream
Cone
2.00
0 1 2 3 4 7 8 9 11 12 Quantity of
Ice-Cream Cones
13
Demand
Initial equilibrium
S1
10
1. Increase in the price of
inputs reduces the supply
of ice cream...
New
equilibrium
2. ...resulting
in a higher
price...
Rs2.50
3. ...and a lower
quantity sold.
Demand and supply_analysis

Demand and supply_analysis

  • 2.
    Supply and demandare the two words that economists use most often. Supply and demand are the forces that make market economies work. Modern microeconomics is about supply, demand, and market equilibrium.
  • 3.
    A market isa group of buyers and sellers of a particular good or service. The terms supply and demand refer to the behavior of people . . . as they interact with one another in markets.
  • 4.
  • 5.
    A competitive marketis a market. . . …with many buyers and sellers. …that is not controlled by any one person. …in which a narrow range of prices are established that buyers and sellers act upon.
  • 6.
    Products are thesame Numerous buyers and sellers so that each has no influence over price Buyers and Sellers are price takers Perfect Competition
  • 7.
    Monopoly One seller, andseller controls price Oligopoly Few sellers Not always aggressive competition
  • 8.
    Monopolistic Competition Many sellers Slightlydifferentiated products Each seller may set price for its own product
  • 9.
    Quantity demanded is theamount of a good that buyers are willing and able to purchase.
  • 10.
    Price demand: Refers tothe various quantities of goods and services that a consumer would purchase at a given time in a market at various hypothetical prices.
  • 11.
    Income demand: Refers tothe various quantities of goods and services which would be purchased by the consumers at various levels of income.
  • 12.
    Cross demand: Means thequantities of goods and services which will be purchased with reference to change in price not of this good but of other inter-related goods.
  • 13.
    The law ofdemand states that there is an inverse relationship between price and quantity demanded.
  • 14.
    The demand scheduleis a table that shows the relationship between the price of the good and the quantity demanded.
  • 15.
    Price Quantity Rs0.00 12 0.5010 1.00 8 1.50 6 2.00 4 2.50 2 3.00 0
  • 16.
    Average income Size ofthe market Prices of related goods Tastes or preferences Expectations Distinction
  • 17.
    The demand curveis the downward- sloping line relating price to quantity demanded.
  • 18.
    Rs3.0 0 2.50 2.00 1.50 1.00 0.50 21 3 45 6 7 8 9 10 1211 Price of Ice-Cream Cone Quantity of Ice-Cream Cones 0 Price Quantity Rs0.00 12 0.50 10 1.00 8 1.50 6 2.00 4 2.50 2 3.00 0
  • 19.
    Substitution effect: whenthe price of good rises, we substitute other similar goods for it. Income effect: when prices price goes up we find ourselves poorer than we were before.
  • 20.
    Ceteris paribus isa Latin phrase that means all variables other than the ones being studied are assumed to be constant. Literally, ceteris paribus means “other things being equal.” The demand curve slopes downward because, ceteris paribus, lower prices imply a greater quantity demanded!
  • 21.
    Market demand refersto the sum of all individual demands for a particular good or service. Graphically, individual demand curves are summed horizontally to obtain the market demand curve.
  • 22.
    Change in QuantityDemanded Movement along the demand curve. Caused by a change in the price of the product.
  • 23.
    0 D1 Price of Cigarettes per Pack Numberof Cigarettes Smoked per Day A tax that raises the price of cigarettes results in a movement along the demand curve. A C 20 2.00 Rs4.0 0 12
  • 24.
    Change in Demand Ashift in the demand curve, either to the left or right. Caused by a change in a determinant other than the price.
  • 25.
  • 26.
    As income increasesthe demand for a normal good will increase. As income increases the demand for an inferior good will decrease.
  • 27.
    Rs3.0 0 2.50 2.00 1.50 1.00 0.50 21 3 45 6 7 8 9 10 1211 Price of Ice-Cream Cone Quantity of Ice-Cream Cones 0 Increase in demand An increase in income... D1 D2
  • 28.
    Rs3.00 2.50 2.00 1.50 1.00 0.50 21 3 45 6 7 8 9 10 1211 Price of Ice-Cream Cone Quantity of Ice-Cream Cones 0 Decrease in demand An increase in income... D1D2
  • 29.
    When a fallin the price of one good reduces the demand for another good, the two goods are called substitutes. When a fall in the price of one good increases the demand for another good, the two goods are called complements.
  • 30.
    Quantity supplied isthe amount of a good that sellers are willing and able to sell.
  • 31.
    The law ofsupply states that there is a direct (positive) relationship between price and quantity supplied.
  • 32.
    Market price Cost ofproduction(inputs) Technology Expectations Government policies Special influences Number of producers
  • 33.
    The supply scheduleis a table that shows the relationship between the price of the good and the quantity supplied.
  • 34.
    Price Quantity Rs0.00 0 0.500 1.00 1 1.50 2 2.00 3 2.50 4 3.00 5
  • 35.
    The supply curveis the upward-sloping line relating price to quantity supplied.
  • 36.
    Rs3.0 0 2.50 2.00 1.50 1.00 0.50 21 3 45 6 7 8 9 10 1211 Price of Ice-Cream Cone Quantity of Ice-Cream Cones 0 Price Quantity Rs0.00 0 0.50 0 1.00 1 1.50 2 2.00 3 2.50 4 3.00 5
  • 37.
    Market supply refersto the sum of all individual supplies for all sellers of a particular good or service. Graphically, individual supply curves are summed horizontally to obtain the market supply curve.
  • 38.
    Change in QuantitySupplied Movement along the supply curve. Caused by a change in the market price of the product.
  • 39.
    1 5 Price of Ice-Cream Cone Quantityof Ice-Cream Cones 0 S 1.00 A C Rs3.00 A rise in the price of ice cream cones results in a movement along the supply curve.
  • 40.
    Change in Supply Ashift in the supply curve, either to the left or right. Caused by a change in a determinant other than price.
  • 41.
    Price of Ice-Cream Cone Quantity of Ice-Cream Cones 0 S1S2 S3 Increase in Supply Decrease in Supply
  • 42.
    Market Equilibrium  MarketEquilibrium comes at that price and quantity where the forces of supply and demand are in balance.  The equilibrium price is also called the market-clearing price.
  • 43.
    Equilibrium Price The pricethat balances supply and demand. On a graph, it is the price at which the supply and demand curves intersect. Equilibrium Quantity The quantity that balances supply and demand. On a graph it is the quantity at which the supply and demand curves intersect.
  • 44.
    Price Quantity Rs0.00 0 0.500 1.00 1 1.50 4 2.00 7 2.50 10 3.00 13 Price Quantity Rs0.00 19 0.50 16 1.00 13 1.50 10 2.00 7 2.50 4 3.00 1 Demand Schedule Supply Schedule At Rs.2.00, the quantity demanded is equal to the quantity supplied!
  • 45.
    Supply Demand Price of Ice-Cream Cone Quantity of Ice-Cream Cones 213 4 5 6 7 8 9 10 12110 Rs3.0 0 2.50 2.00 1.50 1.00 0.50 Equilibrium
  • 46.
    Price of Ice-Cream Cone Quantity of Ice-Cream Cones 213 4 5 6 7 8 9 10 12110 Rs3.0 0 2.50 2.00 1.50 1.00 0.50 Supply Demand Surplus
  • 47.
    When the priceis above the equilibrium price, the quantity supplied exceeds the quantity demanded. There is excess supply or a surplus. Suppliers will lower the price to increase sales, thereby moving toward equilibrium.
  • 48.
    Quantity of Ice-Cream Cones Priceof Ice-Cream Cone Rs2.00 0 1 2 3 4 5 6 7 8 9 10 11 12 13 Supply Demand Rs1.50 Shortage
  • 49.
    When the priceis below the equilibrium price, the quantity demanded exceeds the quantity supplied. There is excess demand or a shortage. Suppliers will raise the price due to too many buyers chasing too few goods, thereby moving toward equilibrium.
  • 50.
    Price of Ice-Cream Cone 2.00 0 7Quantity of Ice-Cream Cones Supply Initial equilibrium D1 1. Hot weather increases the demand for ice cream... D2 2. ...resulting in a higher price... Rs2.50 10 3. ...and a higher quantity sold. New equilibrium
  • 51.
    A shift inthe supply curve is called a change in supply. A movement along a fixed supply curve is called a change in quantity supplied. A shift in the demand curve is called a change in demand. A movement along a fixed demand curve is called a change in quantity demanded.
  • 52.
    S2 Price of Ice-Cream Cone 2.00 0 12 3 4 7 8 9 11 12 Quantity of Ice-Cream Cones 13 Demand Initial equilibrium S1 10 1. Increase in the price of inputs reduces the supply of ice cream... New equilibrium 2. ...resulting in a higher price... Rs2.50 3. ...and a lower quantity sold.