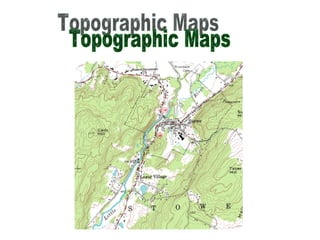
Topographic maps show physical characteristics of an area such as rivers, streams, mountains, roads, and man-made structures. They use contour lines to indicate elevation and slope of the land, with closer lines representing a steeper slope. Elevation is noted in feet or meters and contour intervals show the change in elevation between lines. Features such as hills, summits, and depressions are represented symbolically.
2. Topographic Maps: Map that shows the physical characteristics of an area. Natural : rivers, streams, mountains Man-made : roads, railroad tracks, bridges and buildings
3.
4.
5. 1:250,000 scale, 1 inch represents about 4 miles 1:100,000 scale, 1 inch represents about 1.6 miles 7.5 minute 1:24,000 scale, 1 inch represents 2,000 feet
6.
7.
8. Contour line: line that connects points of the same elevation Elevation: height above sea level
9.
10. Contour interval: shows the same change in elevation from contour line to contour line (represented by a number) Index contour: typically every 5th contour line, usually bolder or darker and it will have a number
14. The slope of land is shown by the closeness of the contour lines. Lines close together: steep slope; lines far apart; gentle slope
15.
16. Full circle : shows the top of a hill, highest point; called the “summit” Often an “X” represents the actual elevation at that point
17.
18. Full circle with short lines in it (hachures) represents a “depression” (downward change in elevation)
19.
20.
21.
22.
23.
24.
25. Color map: Green: land Blue: water Black: anything man made (buildings, roads, bridges, railroad tracks) Pink: areas of high density White : uninhabited areas