Downloaded 1,193 times
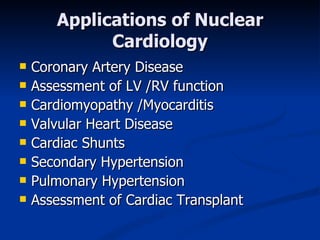
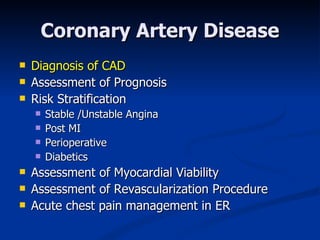
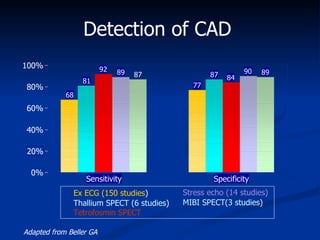
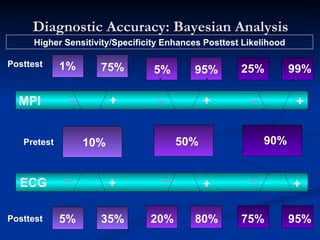
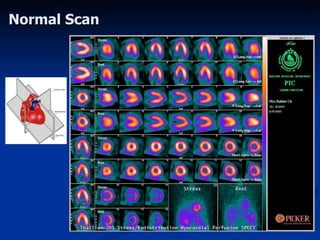
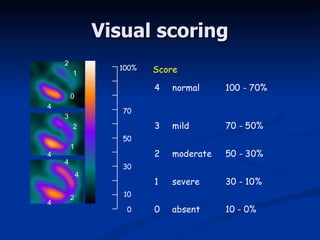
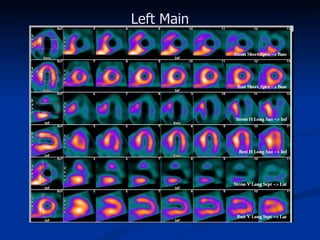
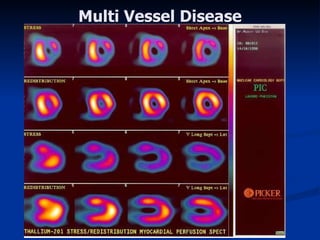
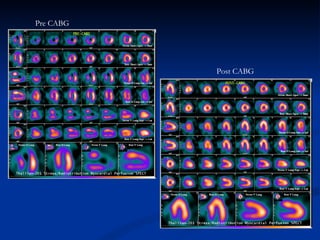
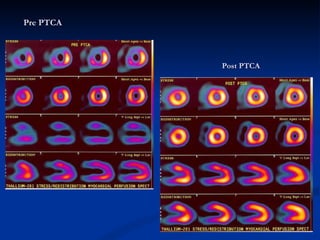
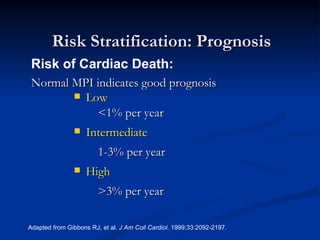
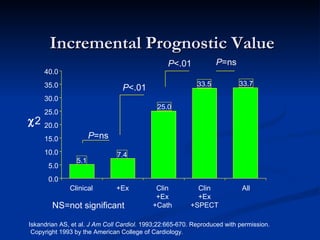
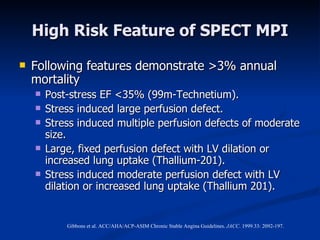
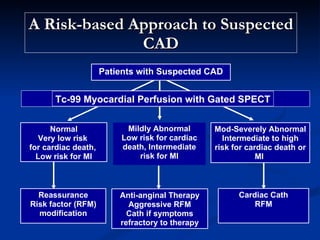
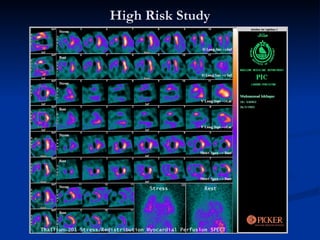
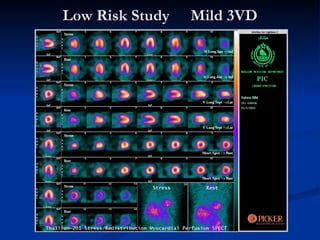
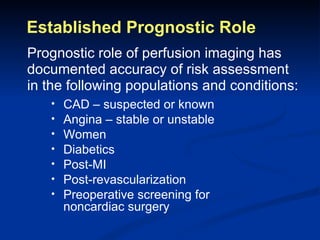
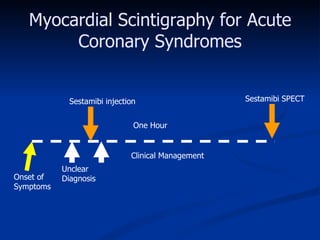
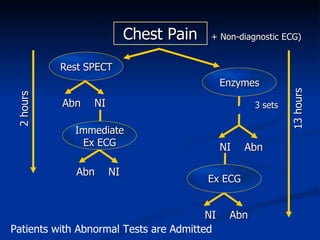
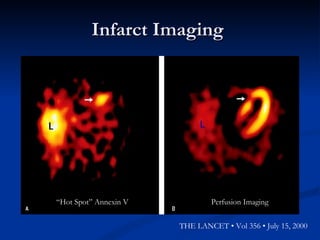
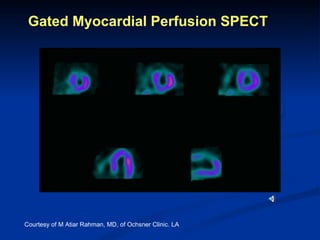
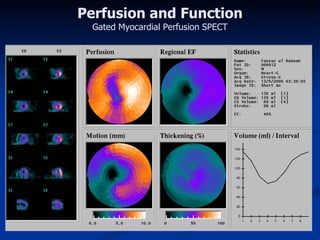
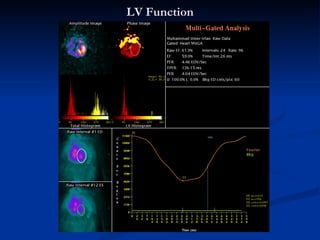
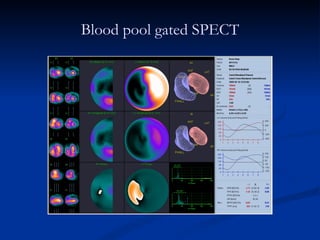
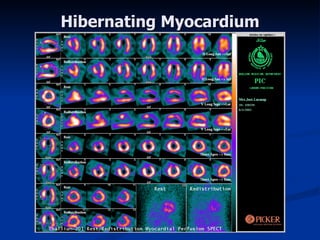
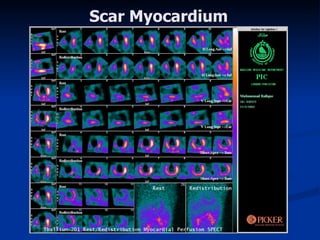
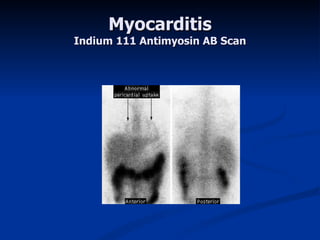
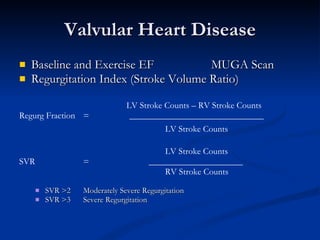
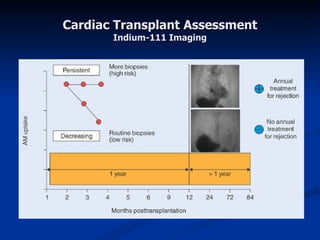


Nuclear imaging techniques have various applications in cardiology, including assessing coronary artery disease, left ventricular function, cardiomyopathy, valvular heart disease, cardiac shunts, pulmonary hypertension, and more. Myocardial perfusion imaging can accurately diagnose and assess the prognosis of coronary artery disease, viability after myocardial infarction, and effectiveness of revascularization procedures. Gated SPECT allows evaluation of both cardiac function and perfusion simultaneously. Other nuclear techniques help evaluate conditions like myocarditis, pulmonary embolism, and secondary causes of hypertension.


