Business at a glance may 2018 Circulo de Empresarios
•
0 likes•83 views

Monthly summary of the state of the Spanish company and internatiomal

Recommended
Recommended
More Related Content
What's hot
What's hot (20)
Similar to Business at a glance may 2018 Circulo de Empresarios
Similar to Business at a glance may 2018 Circulo de Empresarios (20)
More from Círculo de Empresarios
More from Círculo de Empresarios (20)
Recently uploaded
Recently uploaded (20)
Business at a glance may 2018 Circulo de Empresarios
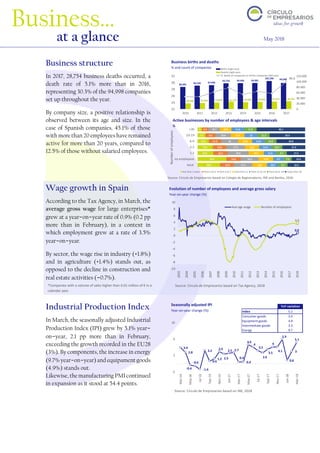
- 1. 3.9 2.8 -0.4 -0.6 -1.4 3.2 0.6 1.2 2.9 2.3 2.5 2.7 0.4 0.4 4.6 4 3.2 2.6 3.5 4 4.1 5.9 0.8 3 5.1 -2 2 6 10 Mar-16 May-16 Jul-16 Sep-16 Nov-16 Jan-17 Mar-17 May-17 Jul-17 Sep-17 Nov-17 Jan-18 Mar-18 YoY variation Index 5.1 Consumer goods 3.4 Equipment goods 4.9 Intermediate goods 3.3 Energy 9.7 80,481 85,220 87,606 93,756 94,606 94,981 102,396 94,998 20,708 21,944 23,823 26,720 24,980 26,026 27,357 28,754 30.3 0 20.000 40.000 60.000 80.000 100.000 120.000 22 24 26 28 30 32 2010 2011 2012 2013 2014 2015 2016 2017 Births (right axis) Deaths (right axis) % death of companies on births companies (left axis) 20.8 26.8 14.6 14.1 10.5 7.3 4 12.9 13.4 13.3 12.6 11.3 9.3 6.2 17.2 16.5 19.6 17.3 16 14.4 10.7 13.6 13.6 14.1 13.2 12.8 12.7 10.6 10.5 9.7 11.6 11.4 11.8 12 11.6 8.7 7.5 9.7 10.2 10.9 11.3 11.8 16.3 12.5 17.2 21.3 26.8 32.9 45.1 total no employees 1-2 3-5 6-9 10-19 +20 less than 2 years from 2 to 3 from 4 to 7 from 8 to 11 from 12 to 15 from 16 to 19 more than 20 Business structure In 2017, 28,754 business deaths occurred, a death rate of 5.1% more than in 2016, representing 30.3% of the 94,998 companies set up throughout the year. By company size, a positive relationship is observed between its age and size. In the case of Spanish companies, 45.1% of those with more than 20 employees have remained active for more than 20 years, compared to 12.5% of those without salaried employees. Wage growth in Spain According to the Tax Agency, in March, the average gross wage for large enterprises* grew at a year-on-year rate of 0.9% (0.2 pp more than in February), in a context in which employment grew at a rate of 3.5% year-on-year. By sector, the wage rise in industry (+1.8%) and in agriculture (+1.4%) stands out, as opposed to the decline in construction and real estate activities (-0.7%). Industrial Production Index In March, the seasonally adjusted Industrial Production Index (IPI) grew by 5.1% year- on-year, 2.1 pp more than in February, exceeding the growth recorded in the EU28 (3%). By components, the increase in energy (9.7% year-on-year) and equipament goods (4.9%) stands out. Likewise, the manufacturing PMI continued in expansion as it stood at 54.4 points. 0.9 3.5 -10 -8 -6 -4 -2 0 2 4 6 8 10 2003 2004 2005 2006 2007 2008 2009 2010 2011 2012 2013 2014 2015 2016 2017 2018 Evolucióndel nº de empleados y el salariomediobruto variación interanual (%) Average wage Number of employees Business… at a glance May 2018 Source: Círculo de Empresarios based on Tax Agency, 2018 Active businesses by number of employees & age intervals % Business births and deaths % and count of companies Source: Círculo de Empresarios based on Colegio de Registradores, INE and Bankia, 2018 Evolution of number of employees and average gross salary Year-on-year change (%) Seasonally adjusted IPI Year-on-year change (%) Source: Círculo de Empresarios based on INE, 2018 *Companies with a volume of sales higher than 6.01 million of € in a calendar year Numberofemployees
- 2. ‘Business at a glance’, a publication of the Círculo de Empresarios produced by its Department of the Economy, contains information and opinion from reliable sources. However, the Círculo de Empresarios does not guarantee its accuracy and does not take responsibility for any errors or omissions. This document is merely informative. As a result, the Círculo de Empresarios is not responsible for any uses that may be made of the publication. The opinions and estimates of the Department can be modified without prior warning. www.circulodeempresarios.org 46.5 29.7 0 10 20 30 40 50 2005 2006 2007 2008 2009 2010 2011 2012 2013 2014 2015 2016 2017 Chinese FDI in US US FDI in China Restrictions of Chinese authorities Trade with the UK In 2017, the United Kingdom was the fifth largest trading partner of Spain representing 7% of total exports of goods and 9.4% of goods and services. A quarter of the Spanish export companies have the United Kingdom as their main commercial destination. In addition, between 2012 and 2017, their count increased by 8% to 11,695 companies, of which 14% are regular* exporters. However, since the Brexit, the number of exporting companies has fallen by 0.8% and the value of its exports of goods by 6%. S&P 500 In Q1 2018, S&P 500 companies recorded a year-on-year increase in profits of 24.9% (the highest level since Q3 2010). By sectors, the greatest increase was recorded in energy (+95% year-on-year), raw materials (+44.1%), information technology (+33%), and in the financial sector (+29.6%). This development took place in an environment in which the S&P 500’s annualised volatility in the first 90 days of the year was 18.6%, 12.1 pp higher than in the same period of 2017. Chinese FDI in the US In 2017, China's foreign direct investment (FDI) in the US, after reaching its record high in 2016, dropped by 36% to $ 29.7 billion (0.15% of US GDP), due in part to restrictions imposed by the Chinese authorities on the outflow of capital. Currently, the lion’s share of Chinese FDI is primarily concentrated in the real estate sector and the US infrastructure sector. -10 -5 0 5 10 15 2012 2013 2014 2015 2016 2017 Valor exportaciones variación interanual (%) 0 3 6 9 2012 2013 2014 2015 2016 2017 Empresas exportadoras % del total Big enterprises SMEs Total 22.7 6.4 24.9 8.2 29.6 13.1 Earnings Revenue S&P 500 ingresos y beneficios en el 1T de 2018 % crecimiento interanual S&P 500 > 50% of sales in US All S&P 500 companies S&P 500 < 50% of sales in US 95 44.1 33 29.6 24.9 Energy Materials Tecnology Financial Sector Average 11 sectors Evolución de los beneficios % crecimiento interanual Source: Círculo de Empresarios based on Factset, 2018 S&P 500 Earnings and Revenues, Q1 2018 Year-on-year change (%) S&P 500 Earnings Q1 2018 Year-on-year change (%) Source: Círculo de Empresarios based on Bank of Spain and ICEX, 2018 Value of exports of goods to the United Kingdom Year-on-year change (%) Companies that export to the United Kingdom % over the total number of companies Foreign Direct Investment (FDI) Billions of $ Note: ‘Other sectors’ includes consumer and product services and electronic equipment Breakdown of FDI by sectors (% over the total) *Companies that have exported over the past four years in a row Note: with 91% of companies in the S&P 500 reporting results Source: Círculo de Empresarios based on Caixabank Research and Rodium Group, 2018 36.5 37.3 35 13 28.5 48.7 2017 2016 Real Estate Transport and Infrastructure Others sectors