Economy at a glance... December 2023
•
0 likes•17 views

Foreign trade of goods Spain Public debt Spain Quarterly labour cost survey Unfilled job vacancies in Europe CPI Eurozone Economic forecasts China

Recommended
Recommended
More Related Content
Similar to Economy at a glance... December 2023
Similar to Economy at a glance... December 2023 (20)
More from Círculo de Empresarios
More from Círculo de Empresarios (20)
Recently uploaded
Recently uploaded (20)
Economy at a glance... December 2023
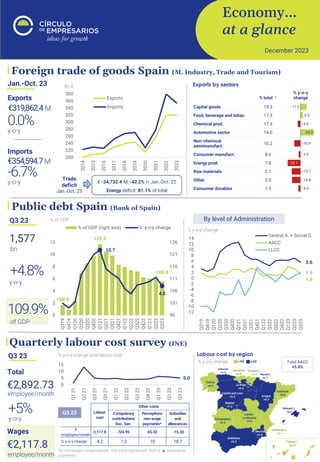
- 1. Economy… at a glance December 2023 5.0 0 5 10 15 Q1 21 Q2 21 Q3 21 Q4 21 Q1 22 Q2 22 Q3 22 Q4 22 Q1 23 Q2 23 Q3 23 100.2 125.3 109.9 10.7 4.8 96 101 106 111 116 121 126 0 2 4 6 8 10 12 Q319 Q419 Q120 Q220 Q320 Q420 Q121 Q221 Q321 Q421 Q122 Q222 Q322 Q422 Q123 Q223 Q323 % of GDP (right axis) % y-o-y change 200 220 240 260 280 300 320 340 360 380 2014 2015 2016 2017 2018 2019 2020 2021 2022 2023 Exports Imports Quarterly labour cost survey (INE) Q3 23 y-o-y +5% By level of Administration Public debt Spain (Bank of Spain) Q3 23 of GDP 109.9% % of GDP % y-o-y change y-o-y +4.8% 1,577 bn €2,892.73 employee/month Total €2,117.8 employee/month Wages % y-o-y change total labour cost *In non-wage compensation, the most significant item is ▲ severance payments Q3 23 Foreign trade of goods Spain (M. Industry, Trade and Tourism) Jan.-Oct. 23 €319,862.4 M Imports Exports €354,594.7M y-o-y 0.0% y-o-y -6.7% Exports by sectors Bn € Trade deficit Jan.-Oct. 23 € -34,732.4 M, -42.2% r/ Jan.-Oct. 22 Energy deficit: 81.1% of total 5.6 1.6 1.9 -12 -10 -8 -6 -4 -2 0 2 4 6 8 10 12 14 Q319 Q419 Q120 Q220 Q320 Q420 Q121 Q221 Q321 Q421 Q122 Q222 Q322 Q422 Q123 Q223 Q323 Central A. + Social S. AACC LLCC % y-o-y change Labour cost by region Total AACC +5.0% Compulsory contributions Soc. Sec. Perceptions non-wage payments* Subsidies and allowances € employee/month 2,117.8 724.95 65.33 -15.33 % y-o-y change 4.2 7.2 10 18.7 Labour cost Other costs
- 2. 2 Economy… at a glance, a publication of the “Círculo de Empresarios” produced by its Department of Economy, contains information and opinion from reliable sources. However, the “Círculo de Empresarios” does not guarantee its accuracy and does not take responsibility for any errors or omissions. This document is merely informative. As a result, the “Círculo de Empresarios” is not responsible for any uses that may be made of the publication. The opinions and estimates of the Department can be modified without prior warning. CPI Eurozone (Eurostat and ECB) Economic forecasts China (Oxford Economics) Unfilled job vacancies in Europe (Eurostat) Q3 23 Eurozone 2.9% % total number of jobs offered EU 27 2.6% % y-o-y -0.2pp y-o-y -0.3pp By countries 14/12/23 → ECB maintains official interest rates • Principal financing operations: 4.5% • Marginal credit facility: 4.75% • Deposit facility: 4% ECB inflation forecast % y-o-y change y-o-y 2.4% Nov. 23 GDP 2023 Inflation 0.4% y-o-y 5.2% y-o-y 2023-26 % y-o-y change * Forecasts % y-o-y change GDP demand components ** Exc. Energy and food General CPI y-o-y 4.2% Core* * Exc. Energy and unprocessed food % y-o-y change General CPI -0.3 Nov. 23 10.1 2.4 Nov. 20 Nov. 22 2.1 3.0 2.6 2.2 3.2 2.9 0.7 0.9 0.9 0 1 2 3 4 Q3 19 Q4 19 Q1 20 Q2 20 Q3 20 Q4 20 Q1 21 Q2 21 Q3 21 Q4 21 Q1 22 Q2 22 Q3 22 Q4 22 Q1 23 Q2 23 Q3 23 EU 27 Eurozone Spain 5.4 2.7 2.1 1.9 5.0 2.7 2.3 2.1 2023 2024 2025 2026 General Core** 0.9 2.0 0.4 1.5 2.4 2.3 8.5 3.0 5.2 4.4 4.0 3.9 0 3 6 9 2021 2022 2023* 2024* 2025* 2026* Inflation GDP