Download as PDF, PPTX
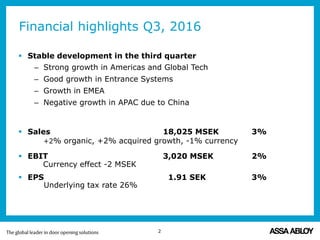
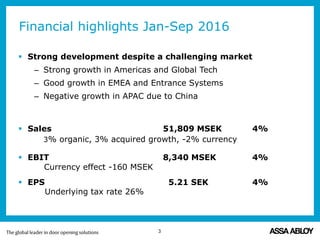
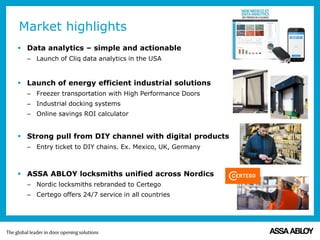
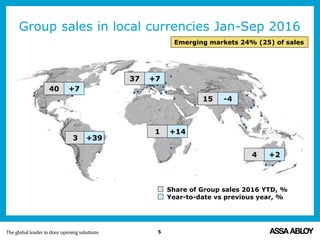

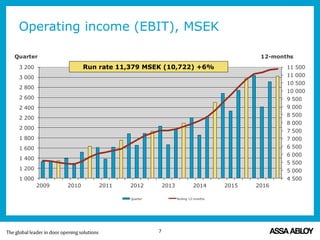
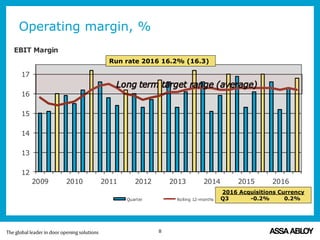
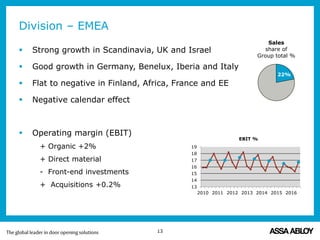
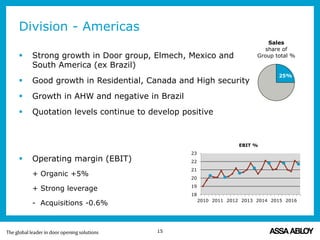
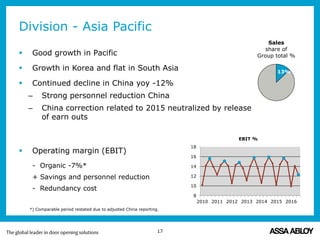
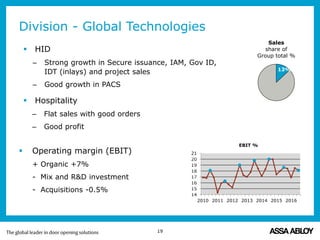
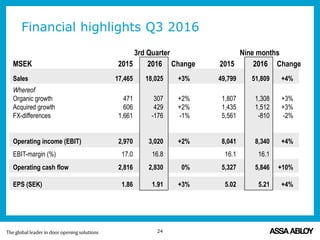

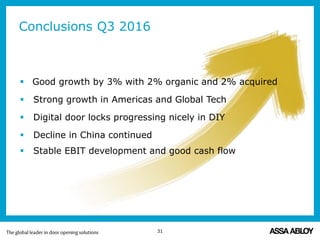


Assa Abloy's Q3 2016 report highlights a 3% increase in sales, driven by strong growth in the Americas and global tech, though the Asia Pacific region saw negative growth due to challenges in China. The company's EBIT margin was stable at 16.8%, with notable advancements in digital products and energy-efficient industrial solutions. The report also notes positive cash flow and continued growth in the DIY segment, despite ongoing difficulties in certain international markets.


