Economy at a glance... April 2024 Círculo de Empresarios
•
0 likes•4 views

Labour market Spain International tourist arrivals Spain Private sector financing Spain Manufacturing PMIs US-Eurozone Global trade World labour productivity growth

Recommended
More Related Content
Similar to Economy at a glance... April 2024 Círculo de Empresarios
Similar to Economy at a glance... April 2024 Círculo de Empresarios (20)
More from Círculo de Empresarios
More from Círculo de Empresarios (20)
Recently uploaded
Recently uploaded (20)
Economy at a glance... April 2024 Círculo de Empresarios
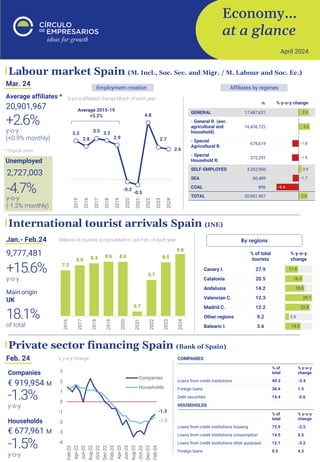
- 1. Economy… at a glance April 2024 Private sector financing Spain (Bank of Spain) Feb. 24 International tourist arrivals Spain (INE) +15.6% Jan.- Feb.24 y-o-y Millions of tourists accumulated in Jan-Feb. of each year 9,777,481 By regions Mar. 24 20,901,967 y-o-y (+0.9% monthly) +2.6% Average affiliates * 2,727,003 y-o-y (-1.2% monthly) -4.7% Unemployed * Original series % y-o-y affiliated change March of each year Employment creation Labour market Spain (M. Incl., Soc. Sec. and Migr. / M. Labour and Soc. Ec.) -1.3% y-o-y Companies -1.5% y-o-y Households % y-o-y change € 919,954 M € 677,961 M 18.1% of total Main origin UK 3.3 2.8 3.5 3.3 2.9 -0.2 -0.5 4.8 2.7 2.6 2015 2016 2017 2018 2019 2020 2021 2022 2023 2024 Average 2015-19 +3.2% Affiliates by regimes 7.2 8.0 8.3 8.6 8.6 0.7 5.7 8.5 9.8 2016 2017 2018 2019 2020 2021 2022 2023 2024 -1.3 -1.5 -4 -3 -2 -1 0 1 2 3 Feb-22 Apr-22 Jun-22 Aug-22 Oct-22 Dec-22 Feb-23 Apr-23 Jun-23 Aug-23 Oct-23 Dec-23 Feb-24 Companies Households
- 2. Economy… at a glance, a publication of the “Círculo de Empresarios” produced by its Department of Economy, contains information and opinion from reliable sources. However, the “Círculo de Empresarios” does not guarantee its accuracy and does not take responsibility for any errors or omissions. This document is merely informative. As a result, the “Círculo de Empresarios” is not responsible for any uses that may be made of the publication. The opinions and estimates of the Department can be modified without prior warning. Manufacturing PMIs US-Eurozone (Investing) Mar. 24 Value ≥ 50: expansion of economic activity; < 50 = contraction r/Mar. 23 +2.7 51.9 points US r/Mar. 23 -1.2 46.1 points Eurozone Main European economies Value ≥ 50: expansion of economic activity; < 50 = contraction Annual growth in trade in goods. Major economies % change Global trade (UNCTAD) 2023* y-o-y -3.0% Goods y-o-y -5.0% Services y-o-y +8.0% $ 31 tr * Preliminary figures % quarterly global trade value change World labour productivity growth (McKinsey) 1997-2022 +2.3% global average compound annual growth % compound annual growth rate (CAGR) 50% of growth India and China Global average CAGR 2.3% China and India Other emerging economies Advanced economies Contribution to growth %, weighted by GDP 37 11 4 6 8 6 13 4 1 7 3 51.9 46.1 42 44 46 48 50 52 54 56 58 60 62 64 Mar-21 Jun-21 Sep-21 Dec-21 Mar-22 Jun-22 Sep-22 Dec-22 Mar-23 Jun-23 Sep-23 Dec-23 Mar-24 US Eurozone Mar.21 – Mar. 24 -4% -3% -2% -1% 0% 1% 2% 3% 4% 5% 6% Q1 22 Q2 22 Q3 22 Q4 22 Q1 23 Q2 23 Q3 23 Q4 23* Q1 24* Services Goods ** Estimates