Business... at a glance September 2019
•
0 likes•50 views

Monthly summary of the status of the Spanish and international company

Recommended
Recommended
More Related Content
What's hot
What's hot (20)
Similar to Business... at a glance September 2019
Similar to Business... at a glance September 2019 (20)
More from Círculo de Empresarios
More from Círculo de Empresarios (20)
Recently uploaded
Recently uploaded (20)
Business... at a glance September 2019
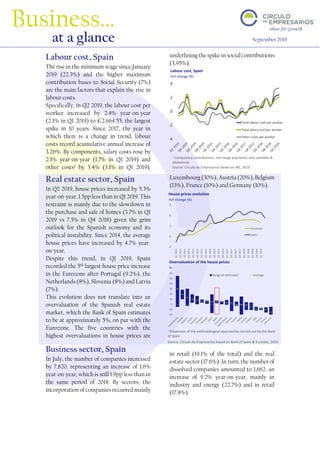
- 1. -4 -2 0 2 4 Total labour cost per worker Total salary cost per worker Other costs per worker -20 -10 0 10 20 30 40 50 60 Range of estimates Average2 -3 0 3 6 9 Q12014 Q22014 Q32014 Q42014 Q12015 Q22015 Q32015 Q42015 Q12016 Q22016 Q32016 Q42016 Q12017 Q22017 Q32017 Q42017 Q12018 Q22018 Q32018 Q42018 Q12019 Eurozone Spain Labour cost, Spain The rise in the minimum wage since January 2019 (22.3%) and the higher maximum contribution bases to Social Security (7%) are the main factors that explain the rise in labour costs. Specifically, in Q2 2019, the labour cost per worker increased by 2.4% year-on-year (2.1% in Q1 2019) to €2,664.55, the largest spike in 10 years. Since 2017, the year in which there is a change in trend, labour costs record acumulative annual increase of 3.26%. By components, salary costs rose by 2.1% year-on-year (1.7% in Q1 2019) and other costs1 by 3.4% (3.1% in Q1 2019), underlining the spike in social contributions (3,95%). Real estate sector, Spain In Q2 2019, house prices increased by 5.3% year-on-year, 1.5pp less than in Q1 2019. This restraint is mainly due to the slowdown in the purchase and sale of homes (3.7% in Q1 2019 vs 7.5% in Q4 2018) given the grim outlook for the Spanish economy and its political instability. Since 2014, the average house prices have increased by 4.7% year- on-year. Despite this trend, in Q1 2019, Spain recorded the 5th largest house price increase in the Eurozone after Portugal (9.2%), the Netherlands (8%), Slovenia (8%) and Latvia (7%). This evolution does not translate into an overvaluation of the Spanish real estate market, which the Bank of Spain estimates to be at approximately 5%, on par with the Eurozone. The five countries with the highest overvaluations in house prices are Luxembourg (30%), Austria (20%), Belgium (13%), France (10%) and Germany (10%). Business sector, Spain In July, the number of companies increased by 7,820, representing an increase of 1.6% year-on-year, which is still 1.9pp less than in the same period of 2018. By sectors, the incorporation of companies occurred mainly in retail (19.1% of the total) and the real estate sector (17.6%). In turn, the number of dissolved companies amounted to 1,662, an increase of 9.2% year-on-year, mainly in industry and energy (22.7%) and in retail (17.8%). Business… at a glance September 2019 Labour cost, Spain YoY change (%) v Source: Círculo de Empresarios based on INE, 2019 Source: Círculo de Empresarios based on Bank of Spain & Eurostat, 2019 1 Compulsory contributions, non-wage payments, and subsidies & allowances House prices evolution YoY change (%) v Overvaluation of the house prices % v 2 Dispersion of the methodological approaches carried out by the Bank of Spain
- 2. ‘Business at a glance’, a publication of the Círculo de Empresarios produced by its Department of the Economy, contains information and opinion from reliable sources. However, the Círculo de Empresarios does not guarantee its accuracy and does not take responsibility for any errors or omissions. This document is merely informative. As a result, the Círculo de Empresarios is not responsible for any uses that may be made of the publication. The opinions and estimates of the Department can be modified without prior warning. www.circulodeempresarios.org 48.7 24.9 5 4.8 16.6 US China United Kingdom India Rest -20 -10 0 10 20 30 Aug-01 Aug-02 Aug-03 Aug-04 Aug-05 Aug-06 Aug-07 Aug-08 Aug-09 Aug-10 Aug-11 Aug-12 Aug-13 Aug-14 Aug-15 Aug-16 Aug-17 Aug-18 Aug-19 US China Eurozone Jan-19 Feb-19 Mar-19 Apr-19 May-19 Jun-19 Jul-19 Aug-19 China 49.5 49.2 50.5 50.1 49.4 49.4 49.7 49.5 Eurozone 50.5 49.3 47.5 47.9 47.7 47.6 46.5 47 US 56.6 54.2 55.3 52.8 52.1 51.7 51.2 49.1 Industrial production In a context of global economic slowdown with mounting geopolitical risks (tensions in Saudi Arabia, Iran and Hong Kong), the industrial sector continues to show signs of fragility not only in the Eurozone but also in the US and China. Eurozone In July, the industrial production in the Eurozone fell by 2% year-on-year for the sixth consecutive month. Among its main economies, Germany reported the largest contraction (–5.3%), 5pp and 4.6pp more than in Italy and France, respectively. As for Spain, its industrial production rose at a moderate 0.3% year-on-year, compared with an average of 1.3% in Q2 2019. Among the leading indicators of the sector, since February, the Eurozone manufacturing PMI remains in the contraction zone, currently standing at 47 points. This evolution confirms the feebleness of production, demand for new orders, and business confidence, which are at record lows since November 2012. US In August, the US industrial production rose at a moderate 0.4% year-on-year, compared with 5.3% in the same month of 2018. Whereas, the manufacturing PMI slipped into the contraction zone with 49.6 points for the first time since 2016. China In August, China's industrial production rose by 4.4% year-on-year, its lowest rate since 2002, well below the forecasted range between 5.2% and 5.5%. The Purchasing Managers' Index (PMI) of the Chinese manufacturing sector dropped to 49.51 points, remaining for the fourth consecutive month in the contraction zone, mainly due to the fall in new orders and the shaky external demand. “Unicorn companies” Currently, the number of unicorn companies3 worldwide amounts to 401 companies, 54% more than in 2018, reaching a total value of $1.2 trillion (1.4% of world GDP). By countries, the US accounts for 48.7% of the total, and China for 24.9%. In Europe, the United Kingdom is the country with the most unicorn companies, while Spain only has one. Thesectorswiththemostunicornsare:Fintech (11.8% of total companies), e-commerce (11.8%), software and internet services (11.6%), and artificial intelligence(11.1%). Industrial output evolution YoY change (%) v Manufacturing PMIs Points v Source: Círculo de Empresarios based on Markit, 2019 Source: Círculo de Empresarios based on CB Insights, 2019 Note: A PMI above 50 represents an expansion and a PMI reading un- der 50 represents a contraction Source: Círculo de Empresarios based on Bloomberg, 2019 “Unicorn companies” by countries, 2019 % of total v 2017 2018 2019 214 260 401 +21% +54% 3 A unicorn is a privately held startup company valued at over $1 billion. Number of “unicorn companies”