Economy at a glance... January 2024
•
0 likes•6 views

Foreign trade of goods Spain Private sector doubtful loans Spain Business turnover Spain Public debt Eurozone China population

Recommended
More Related Content
Similar to Economy at a glance... January 2024
Similar to Economy at a glance... January 2024 (20)
More from Círculo de Empresarios
More from Círculo de Empresarios (20)
Recently uploaded
Recently uploaded (20)
Economy at a glance... January 2024
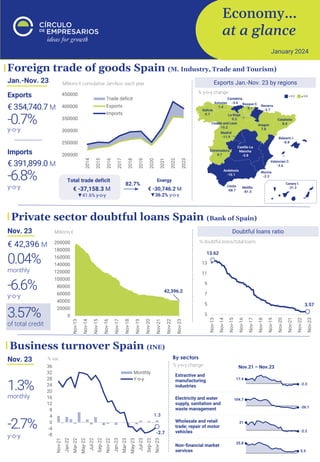
- 1. Economy… at a glance January 2024 1.3 -2.7 -8 -4 0 4 8 12 16 20 24 28 32 36 Nov-21 Jan-22 Mar-22 May-22 Jul-22 Sep-22 Nov-22 Jan-23 Mar-23 May-23 Jul-23 Sep-23 Nov-23 Monthly Y-o-y % y-o-y change Business turnover Spain (INE) Nov. 23 y-o-y -2.7% 1.3% monthly Foreign trade of goods Spain (M. Industry, Trade and Tourism) Jan.-Nov. 23 € 354,740.7 M Imports Exports € 391,899.0 M y-o-y -0.7% y-o-y -6.8% Millions € cumulative Jan-Nov. each year Total trade deficit € -37,158.3 M ▼41.6% y-o-y Energy € -30,746.2 M ▼36.2% y-o-y 82.7% Exports Jan.-Nov. 23 by regions % var. By sectors % y-o-y change Private sector doubtful loans Spain (Bank of Spain) Nov. 23 of total credit 3.57% 0.04% monthly -6.6% y-o-y € 42,396 M % doubtful loans/total loans 13.62 3.57 3 5 7 9 11 13 Nov-13 Nov-14 Nov-15 Nov-16 Nov-17 Nov-18 Nov-19 Nov-20 Nov-21 Nov-22 Nov-23 42,396.2 0 20000 40000 60000 80000 100000 120000 140000 160000 180000 200000 Nov-13 Nov-14 Nov-15 Nov-16 Nov-17 Nov-18 Nov-19 Nov-20 Nov-21 Nov-22 Nov-23 Doubtful loans ratio Millions € 200000 250000 300000 350000 400000 450000 2014 2015 2016 2017 2018 2019 2020 2021 2022 2023 Trade deficit Exports Imports Nov.21 – Nov.23
- 2. Economy… at a glance, a publication of the “Círculo de Empresarios” produced by its Department of Economy, contains information and opinion from reliable sources. However, the “Círculo de Empresarios” does not guarantee its accuracy and does not take responsibility for any errors or omissions. This document is merely informative. As a result, the “Círculo de Empresarios” is not responsible for any uses that may be made of the publication. The opinions and estimates of the Department can be modified without prior warning. 1º 2º 3º 84.1 99.5 89.9 83 84 85 86 87 88 89 90 91 92 93 94 95 96 97 98 99 100 Q4 19 Q1 20 Q2 20 Q3 20 Q4 20 Q1 21 Q2 21 Q3 21 Q4 21 Q1 22 Q2 22 Q3 22 Q4 22 Q1 23 Q2 23 Q3 23 € 12.7 tr 10 11 12 13 Q4 19 Q1 20 Q2 20 Q3 20 Q4 20 Q1 21 Q2 21 Q3 21 Q4 21 Q1 22 Q2 22 Q3 22 Q4 22 Q1 23 Q2 23 Q3 23 Millions of people (data Oxford Economics 2023 excep. China) China population (Statista and Oxford Economics) 2023 1,409 million % y-o-y change and billions of people Exc. Hong Kong and Macao * Statista forecasts -0.15% y-o-y 2028* 1,405 million Public debt Eurozone (Eurostat) € 12.72 tr of GDP 89.9% Q3 23 +4.0% y-o-y +0.9% quarterly ▼ in debt to GDP ratio due to ▲ in GDP greater than ▲ in debt in absolute terms % GDP Tr € % GDP +25.6% By countries Q3 23 Difference in pp Debt as % of GDP r/ Q4 19 (pre-pandemic) 0,8 0,9 1,0 1,1 1,2 1,3 1,4 1,5 -0,2 0,0 0,2 0,4 0,6 0,8 1,0 1,2 1,4 1,6 1980 1990 2000 2010 2020 2021 2022 2023 2024* 2025* 2026* 2027* 2028* bn (right axis) % y-o-y change Spain, 2nd economy with the highest ▲ of % debt/GDP since Q4 19 after France Debt % GDP