1. 3,0
3,5
4,0
4,5
5,0
Jan Feb Mar Apr May Jun Jul Aug Sep Oct Nov Dec
2014 2015 2016 2017 2018 2019
17,5
18,0
18,5
19,0
2
3
4
Affiliations to the Social Security (right axis) YoY change (left axis)
45.2 44
36.4
33.8
26.7
23.7 21.6
9.1
0
10
20
30
40
50
60
Iceland France Italy Germany EU28 Spain Portugal Greece
H1 2018 H2 2018
2.9
5.6
-100
-80
-60
-40
-20
0
20
40
60
-30
-20
-10
0
10
20
2009 2010 2011 2012 2013 2014 2015 2016 2017 2018
Exports (left axis) Imports (left axis)
Trade balance (right axis)
Spain’s Balance of trade
In 2018, Spain's trade deficit widened by
36.6% due to an increase in imports of goods
(5.6%), and are 2.7pp higher than the
increase in exports (2.9%).
The lower dynamism of our exports is
mainly explained by the deceleration of the
main European economies and global trade
tensions.
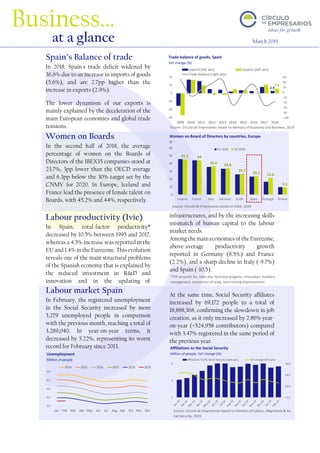
Women on Boards
In the second half of 2018, the average
percentage of women on the Boards of
Directors of the IBEX35 companies stood at
23.7%, 3pp lower than the OECD average
and 6.3pp below the 30% target set by the
CNMV for 2020. In Europe, Iceland and
France lead the presence of female talent on
Boards, with 45.2% and 44%, respectively.
Labour productivity (Ivie)
In Spain, total-factor productivity*
decreased by 10.5% between 1995 and 2017,
whereas a 4.5% increase was reported in the
EU and 1.4% in the Eurozone. This evolution
reveals one of the main structural problems
of the Spanish economy that is explained by
the reduced investment in R&D and
innovation and in the updating of
infrastructures, and by the increasing skills
mismatch of human capital to the labour
market needs.
Among the main economies of the Eurozone,
above-average productivity growth
reported in Germany (8.5%) and France
(2.2%), and a sharp decline in Italy (-9.7%)
and Spain (-10.5).
Labour market Spain
In February, the registered unemployment
in the Social Security increased by more
3,279 unemployed people in comparison
with the previous month, reaching a total of
3,289,040. In year-on-year terms, it
decreased by 5.22%, representing its worst
record for February since 2013.
At the same time, Social Security affiliates
increased by 69,172 people to a total of
18,888,368, confirming the slowdown in job
creation, as it only increased by 2.86% year-
on-year (+524,958 contributors) compared
with 3.47% registered in the same period of
the previous year.
Business…
at a glance March 2019
Source: Círculo de Empresarios based on Ministry of Economy and Business, 2019
Source: Círculo de Empresarios based on EIGE, 2019
Trade balance of goods, Spain
YoY change (%)
v
Women on Board of Directors by countries, Europe
%
Source: Círculo de Empresarios based on Ministry of Labour, Migrations & So-
cial Security, 2019
Affiliations to the Social Security
Million of people, YoY change (%)Unemployment
Million of people
*TFP accounts for, inter alia, technical progress, innovation, business
management, economies of scale, and training improvements
2. ‘Business at a glance’, a publication of the Círculo de Empresarios produced by its Department of the Economy, contains information and opinion from reliable sources. However,
the Círculo de Empresarios does not guarantee its accuracy and does not take responsibility for any errors or omissions. This document is merely informative. As a result, the
Círculo de Empresarios is not responsible for any uses that may be made of the publication. The opinions and estimates of the Department can be modified without prior warning.
www.circulodeempresarios.org
60.6
49.3
49.9
35
40
45
50
55
60
Jun-12
Oct-12
Feb-13
Jun-13
Oct-13
Feb-14
Jun-14
Oct-14
Feb-15
Jun-15
Oct-15
Feb-16
Jun-16
Oct-16
Feb-17
Jun-17
Oct-17
Feb-18
Jun-18
Oct-18
Feb-19
Eurozone Spain
Economic
expansion
Economic
contraction
-
Greece Ireland Netherlands Austria France Spain Eurozone Italy Germany
54.2 54 52.7 51.8 51.5 49.9 49.3 47.7 47.6
max 9
months
max 2
months
min 32
months
min 37
months
max 5
months
min 62
months
min 69
months
min 69
months
min 74
months
93.5
22.2
15.7 14.7 13.1 12.8 10
Energy Communication
services
Consumer
discretionary
Industrials S&P500
(11 sectors)
Heath care Real Estate
12.95
10.17
2.78
5.81
2.82
1.72
0
5
10
15
Global Advanced Emerging US Europe China
1998 2008 2018
Manufacturing PMI
The Manufacturing PMI of the Eurozone
entered the contraction zone* in February,
reaching 49.3 points (record low in 69
months), mainly due to thefalling number of
orders and slower progress in industrial
production.
Among the largest economies in the
Eurozone, the worst data was recorded in
Germany (47.6 points) and Italy (47.7),
while France remained in the expansion
zone.
As for Spain, its Manufacturing PMI fell to
49.9 points (albeit 0.6 points above the
Eurozone), the worst record since 2013,
substantiating the slowdown in Spain’s
economy.
Services PMI UK
In February, the Services PMI of the United
Kingdom rose to 51.3 points, up from 50.6
this January (its lowest level since August
2016). Despite this slight improvement,
business confidence remains at record lows,
and job creation in the services sector
recorded its worst progress since November
2011. With the confirmation of this
evolution, the quarterly growth in Q1 2019
will be 0.1%, down from 0.2% in Q4 2018.
Earnings S&P 500
The Q4 2018 forecast for earnings growth of
the S&P 500 companies is 13.1%* year-on-
year, 2.1pp lower than that of Q4 2017,
confirming the moderation of business
activity in the US.
By sectors, in year-on-year terms, the
greatest increases are foreseen in energy
(93.5%), telecommunications (22.2%), and
consumption (15.7%).
Corporate debt
In 2018, global corporate debt issued by non-
financial companies reached $12.95 trillion
(16% of world GDP), representing an
increase of 100% compared with 2008.
This rise stems from the low interest rates
and monetary stimulus programs designed
by the main central banks.
The advanced economies concentrated
78.5% of the total volume, having taken on
70% in the last decade. The US represents
44.9% of the global issuance or 57.1% of the
advanced economies.
Whereas, emerging countries issued $2.78
trillion (21.5% of the total), of which 61.9%
corresponds to China (395% more than in
2008).
Manufacturing PMI
Points
Source: Círculo de Empresarios based on Markit, 2019
Source: Círculo de Empresarios based on OECD, 2019
*PMI below 50 points
Corporate bonds issued by non-financial companies
$ trillion
v
*With 96% of the companies in the S&P 500 reporting actual results for the quarter
S&P 500 Earnings Q4 2018
YoY change (%)
Source: Círculo de Empresarios based on Facset, 2019