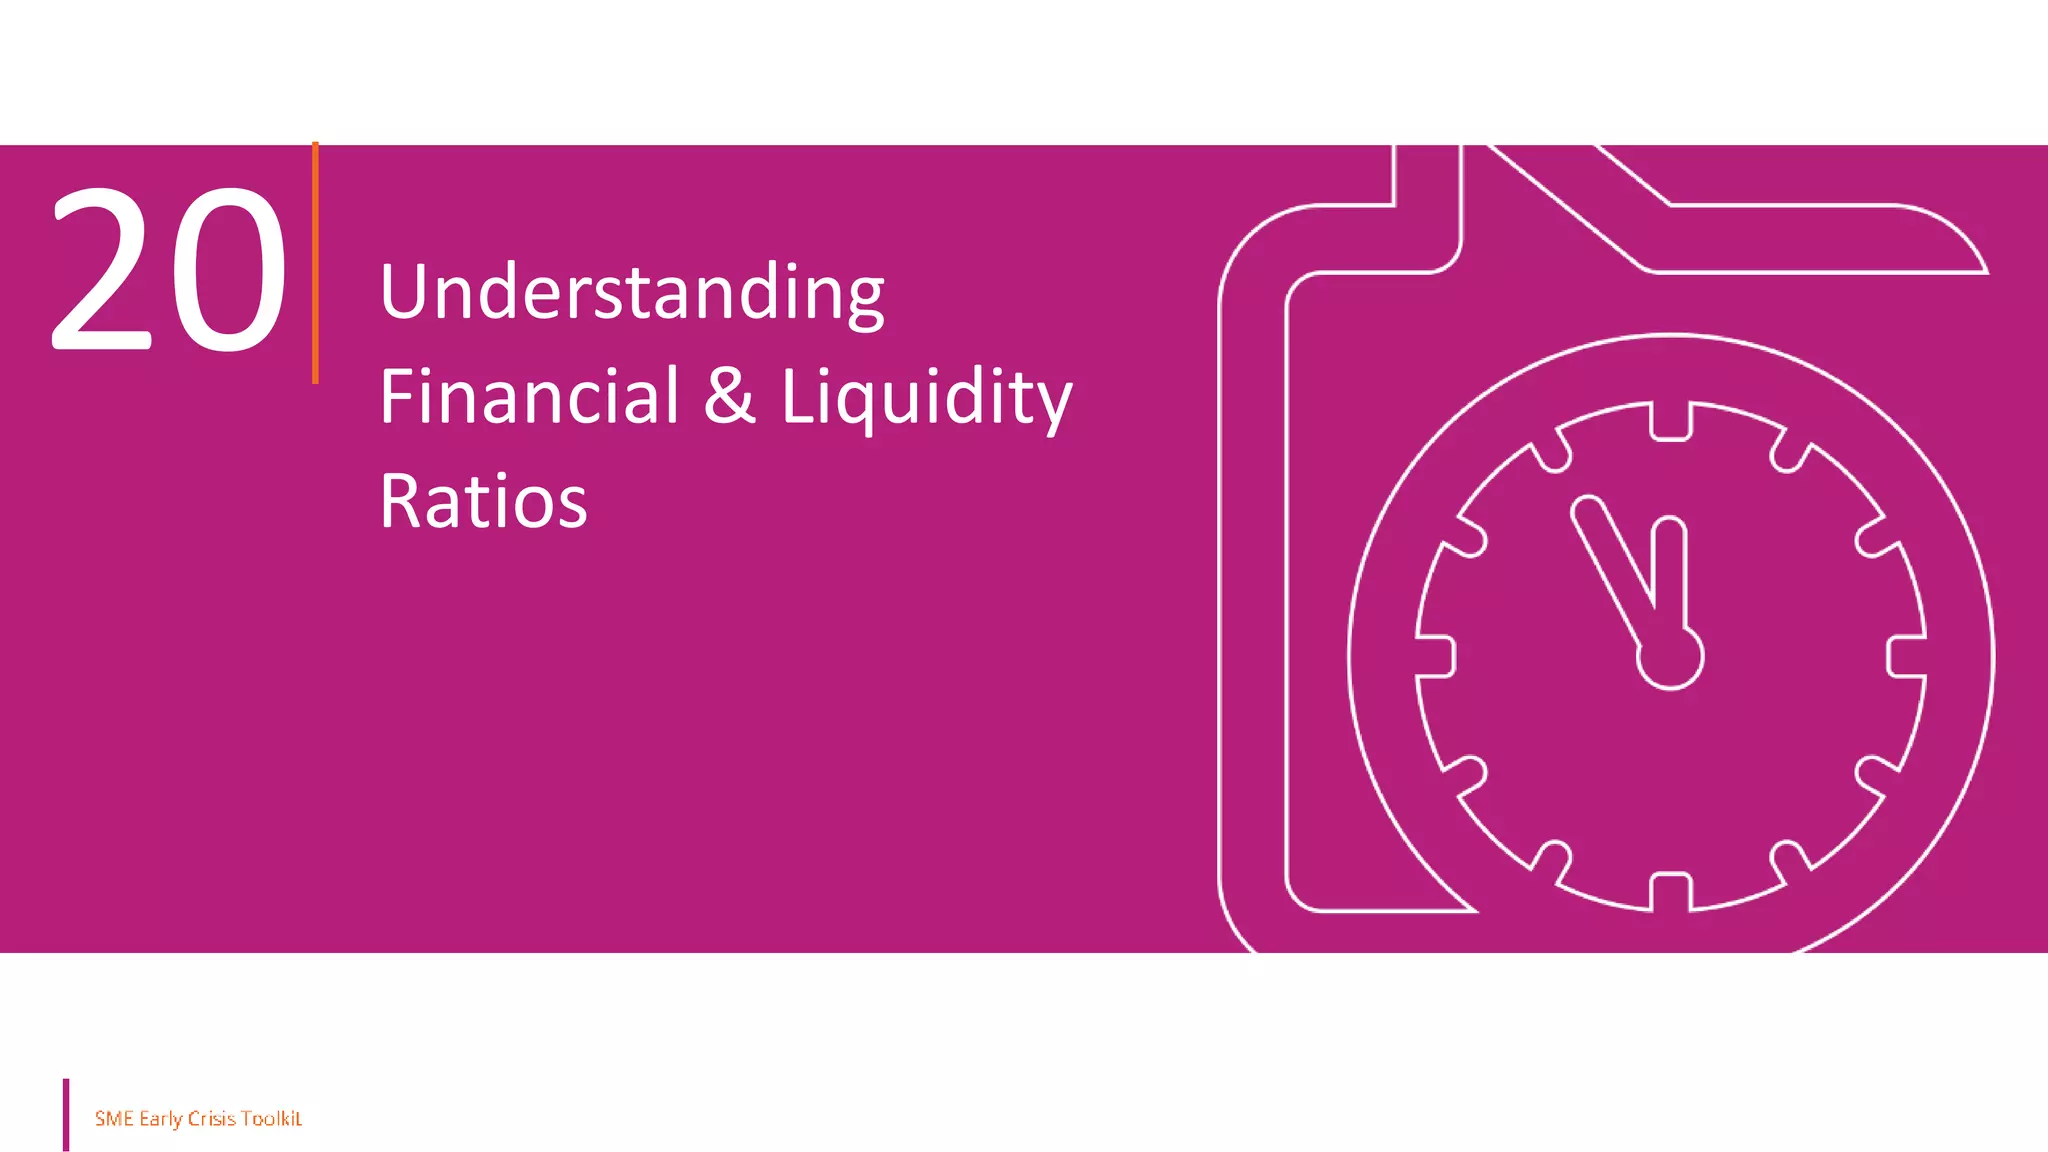
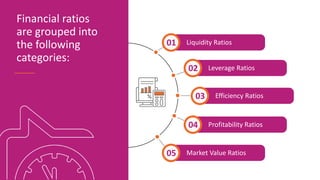
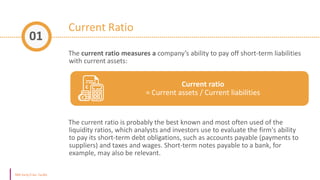
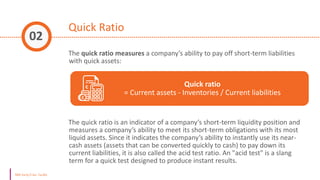
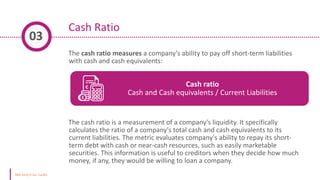
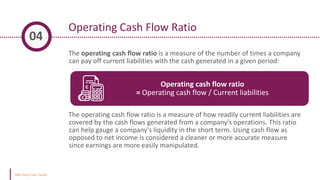
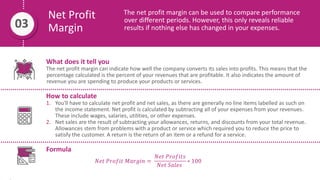
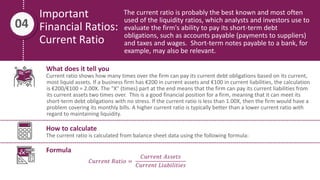
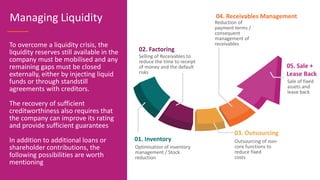
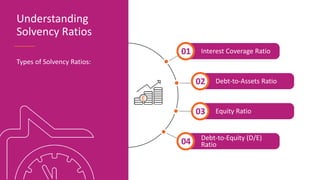
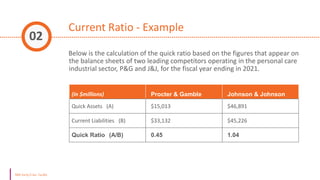
SlideShare a Scribd company logo
1 of 25
Understanding
Financial & Liquidity
Ratios
20
Financial ratios are created with the use
of numerical values taken from financial
statements to gain meaningful
information about a company. The
numbers found on a company’s financial
statements – balance sheet, income
statement, and cash flow statement – are
used to perform quantitative analysis and
assess a company’s liquidity, leverage,
growth, margins, profitability, rates of
return, valuation, and more.
Understanding
Financial Ratios
Liquidity Ratios
01
Leverage Ratios
02
Profitability Ratios
04
Efficiency Ratios
03
Market Value Ratios
05
Financial ratios
are grouped into
the following
categories:
• Liquidity ratios are financial ratios that
measure a company’s ability to repay
both short- and long-term obligations.
• The liquidity ratios are a result of
dividing cash and other liquid assets by
short-term borrowings and current
liabilities. They show the number of
times the short-term debt obligations
are covered by the cash and liquid
assets. If the value is greater than 1, it
means the short-term obligations are
fully covered.
1. Understanding
Liquidity Ratios
Types of Liquidity Ratios
Current
Ratio
Quick
Ratio
Cash
Ratio
Operating
Cash Flow
Ratio
01
02 03
04
Current Ratio
The current ratio measures a company’s ability to pay off short-term liabilities
with current assets:
The current ratio is probably the best known and most often used of the
liquidity ratios, which analysts and investors use to evaluate the firm's ability
to pay its short-term debt obligations, such as accounts payable (payments to
suppliers) and taxes and wages. Short-term notes payable to a bank, for
example, may also be relevant.
01
Current ratio
= Current assets / Current liabilities
Quick Ratio
The quick ratio measures a company’s ability to pay off short-term liabilities
with quick assets:
The quick ratio is an indicator of a company’s short-term liquidity position and
measures a company’s ability to meet its short-term obligations with its most
liquid assets. Since it indicates the company’s ability to instantly use its near-
cash assets (assets that can be converted quickly to cash) to pay down its
current liabilities, it is also called the acid test ratio. An "acid test" is a slang
term for a quick test designed to produce instant results.
02
Quick ratio
= Current assets - Inventories / Current liabilities
Cash Ratio
The cash ratio measures a company’s ability to pay off short-term liabilities
with cash and cash equivalents:
The cash ratio is a measurement of a company's liquidity. It specifically
calculates the ratio of a company's total cash and cash equivalents to its
current liabilities. The metric evaluates company's ability to repay its short-
term debt with cash or near-cash resources, such as easily marketable
securities. This information is useful to creditors when they decide how much
money, if any, they would be willing to loan a company.
03
Cash ratio
Cash and Cash equivalents / Current Liabilities
Operating Cash Flow Ratio
The operating cash flow ratio is a measure of the number of times a company
can pay off current liabilities with the cash generated in a given period:
The operating cash flow ratio is a measure of how readily current liabilities are
covered by the cash flows generated from a company's operations. This ratio
can help gauge a company's liquidity in the short term. Using cash flow as
opposed to net income is considered a cleaner or more accurate measure
since earnings are more easily manipulated.
04
Operating cash flow ratio
= Operating cash flow / Current liabilities
Additional Financial Ratios
Gross
Profit
Margin
Operating
Profit Margin
Net Profit
Margin
Important
Financial
Ratios:
Current Ratio
01
02 03
04
Gross Profit
Margin
Gross profit margin is metric analysts use to assess a
company's financial health by calculating the amount of
money left over from product sales after subtracting the cost
of goods sold (COGS). Sometimes referred to as the gross
margin ratio, the gross profit margin is frequently expressed as
a percentage of sales.
01
What does it tell you
If a company's gross profit margin wildly fluctuates, this may signal poor management practices and/or
inferior products. Such fluctuations may be justified in cases where a company makes sweeping operational
changes to its business model, in which case temporary volatility should be no cause for alarm. E.g. if a
company decides to automate certain supply chain functions, the initial investment may be high, but the
cost of goods ultimately decreases due to the lower labour costs.
How to calculate
A company's gross profit margin percentage is calculated by first subtracting the cost of goods sold (COGS)
from net sales (gross revenues minus returns, allowances, and discounts). This figure is then divided by net
sales, to calculate the gross profit margin in percentage terms.
Formula
𝐺𝑟𝑜𝑠𝑠 𝑃𝑟𝑜𝑓𝑖𝑡 𝑀𝑎𝑟𝑔𝑖𝑛 =
𝑁𝑒𝑡 𝑆𝑎𝑙𝑒𝑠 − 𝐶𝑂𝐺𝑆
𝑁𝑒𝑡 𝑆𝑎𝑙𝑒𝑠
Operating
Profit
Margin
A slightly more complex metric, operating profit also takes into
account all overhead, operating, administrative and sales expenses
necessary to run the business on a day-to-day basis. While this figure
still excludes debts, taxes, and other non-operational expenses, it
does include the amortization and depreciation of assets.
02
What does it tell you
A company's operating profit margin ratio tells you how well the company's operations contribute to its
profitability. A company with a substantial profit margin ratio makes more money on each EURO of sales than
a company with a narrow profit margin.
How to calculate
1.Find the operating income (EBIT) by subtracting its operational expenses, allocated depreciation, and
amortization amounts from gross income.
2.Find the net sales revenue. This requires no calculation because the sales shown on the company's income
statement are net sales. If that figure is unavailable, you can calculate net sales by taking the company's
gross sales and subtracting its sales returns, allowances for damaged goods, and any discounts offered.
3.Calculate the operating profit margin ratio by dividing the figure from step one (operating income) by the
figure from step two (net sales).
Formula
𝑂𝑝𝑒𝑟𝑎𝑡𝑖𝑛𝑔 𝑃𝑟𝑜𝑓𝑖𝑡 𝑀𝑎𝑟𝑔𝑖𝑛 =
𝑂𝑝𝑒𝑟𝑎𝑡𝑖𝑛𝑔 𝐼𝑛𝑐𝑜𝑚𝑒
𝑅𝑒𝑣𝑒𝑛𝑢𝑒
∗ 100
Net Profit
Margin
The net profit margin can be used to compare performance
over different periods. However, this only reveals reliable
results if nothing else has changed in your expenses.
03
What does it tell you
The net profit margin can indicate how well the company converts its sales into profits. This means that the
percentage calculated is the percent of your revenues that are profitable. It also indicates the amount of
revenue you are spending to produce your products or services.
How to calculate
1. You'll have to calculate net profit and net sales, as there are generally no line items labelled as such on
the income statement. Net profit is calculated by subtracting all of your expenses from your revenues.
These include wages, salaries, utilities, or other expenses.
2. Net sales are the result of subtracting your allowances, returns, and discounts from your total revenue.
Allowances stem from problems with a product or service which required you to reduce the price to
satisfy the customer. A return is the return of an item or a refund for a service.
Formula
𝑁𝑒𝑡 𝑃𝑟𝑜𝑓𝑖𝑡 𝑀𝑎𝑟𝑔𝑖𝑛 =
𝑁𝑒𝑡 𝑃𝑟𝑜𝑓𝑖𝑡𝑠
𝑁𝑒𝑡 𝑆𝑎𝑙𝑒𝑠
∗ 100
Important
Financial Ratios:
Current Ratio
The current ratio is probably the best known and most often
used of the liquidity ratios, which analysts and investors use to
evaluate the firm's ability to pay its short-term debt
obligations, such as accounts payable (payments to suppliers)
and taxes and wages. Short-term notes payable to a bank, for
example, may also be relevant.
04
What does it tell you
Current ratio shows how many times over the firm can pay its current debt obligations based on its current,
most liquid assets. If a business firm has €200 in current assets and €100 in current liabilities, the calculation
is €200/€100 = 2.00X. The "X" (times) part at the end means that the firm can pay its current liabilities from
its current assets two times over. This is a good financial position for a firm, meaning that it can meet its
short-term debt obligations with no stress. If the current ratio is less than 1.00X, then the firm would have a
problem covering its monthly bills. A higher current ratio is typically better than a lower current ratio with
regard to maintaining liquidity.
How to calculate
The current ratio is calculated from balance sheet data using the following formula:
Formula
𝐶𝑢𝑟𝑟𝑒𝑛𝑡 𝑅𝑎𝑡𝑖𝑜 =
𝐶𝑢𝑟𝑟𝑒𝑛𝑡 𝐴𝑠𝑠𝑒𝑡𝑠
𝐶𝑢𝑟𝑟𝑒𝑛𝑡 𝐿𝑖𝑎𝑏𝑖𝑙𝑖𝑡𝑖𝑒𝑠
Optimisation of inventory
management / Stock
reduction
01. Inventory
Selling of Receivables to
reduce the time to receipt
of money and the default
risks
02. Factoring
Reduction of
payment terms /
consequent
management of
receivables
04. Receivables Management
Outsourcing of non-
core functions to
reduce fixed
costs
03. Outsourcing
Sale of fixed
assets and
lease back
05. Sale +
Lease Back
Managing Liquidity
To overcome a liquidity crisis, the
liquidity reserves still available in the
company must be mobilised and any
remaining gaps must be closed
externally, either by injecting liquid
funds or through standstill
agreements with creditors.
The recovery of sufficient
creditworthiness also requires that
the company can improve its rating
and provide sufficient guarantees
In addition to additional loans or
shareholder contributions, the
following possibilities are worth
mentioning
It is extremely difficult to acquire outside capital in advanced crisis
phases. Banks are often no longer able to become active due to risk
regulations. In principle, financiers in a crisis demand plausible restructuring
concepts, sufficient securities, and higher interest rates.
Managing
Liquidity
Leasing
Loans from Customers
advance payments
New loans from Financiers
(seasonal loans / bridging loans)
Supplier Credit
Deferment and Waiver
by third parties
Factoring
Shareholder Loan (Equity)
DEBT
CAPITAL
04
02
03
01
05
06
07
A solvency ratio is a key metric used
to measure an enterprise’s ability to
meet its long-term debt obligations
and is used often by prospective
business lenders. A solvency ratio
indicates whether a company’s cash
flow is sufficient to meet its long-
term liabilities and thus is a measure
of its financial health. An
unfavorable ratio can indicate some
likelihood that a company will
default on its debt obligations.
2. Understanding
Solvency Ratios
Interest Coverage Ratio
01
Debt-to-Assets Ratio
02
Debt-to-Equity (D/E)
Ratio
04
Equity Ratio
03
Understanding
Solvency Ratios
Types of Solvency Ratios:
• Solvency ratios and liquidity ratios are similar but have
some important differences. Both of these categories
of financial ratios will indicate the health of a company.
The main difference is that solvency ratios offer a longer-
term outlook on a company whereas liquidity ratios focus
on the shorter term.
• Solvency ratios look at all assets of a company, including
long-term debts such as bonds with maturities longer
than a year. Liquidity ratios, on the other hand, look at
just the most liquid assets, such as cash and marketable
securities, and how those can be used to cover upcoming
obligations in the near term.
Solvency Ratios vs. Liquidity Ratios
Source: Investopedia
Solvency Ratios vs.
Liquidity Ratios
WATCH.
To better determine the difference
between liquidity and solvency.
Examples Using Liquidity Ratios
Current
Ratio -
Example
Quick Ratio -
Example
Cash
Ratio
Example
01
02 03
Current Ratio - Example
We have two companies – Company X and Company Y and both have the
same current ratio of 1.00.
Over time, company X is running into too much debt or is running out of cash.
If it gets worse, both can turn into solvency issues. On the other hand,
consequently, company Y is seen in a positive trend, which may indicate faster
turnover, better paybacks, or that the company was able to reduce debt.
Another factor to consider is that if the current ratio of a company – let’s say
company X, in this case, is more volatile, and shifts from 1.35 to 1.05 in a year,
it indicates increased operational risk and can undermine the value of the
company.
01
Current Ratio - Example
Below is the calculation of the quick ratio based on the figures that appear on
the balance sheets of two leading competitors operating in the personal care
industrial sector, P&G and J&J, for the fiscal year ending in 2021.
02
(in $millions) Procter & Gamble Johnson & Johnson
Quick Assets (A) $15,013 $46,891
Current Liabilities (B) $33,132 $45,226
Quick Ratio (A/B) 0.45 1.04
Current Ratio - Example
With a quick ratio of over 1.0, Johnson &
Johnson appears to be in a decent position to
cover its current liabilities as its liquid assets are
greater than the total of its short-term debt
obligations. Procter & Gamble, on the other
hand, may not be able to pay off its current
obligations using only quick assets as its quick
ratio is well below 1, at 0.45.
This shows that disregarding profitability or
income, Johnson & Johnson appears to be in
better short-term financial health with respect
to being able to meet its short-term debt
requirements.
02
Cash Ratio - Example
Company A’s balance sheet lists the following items:
• Cash: €10,000
• Cash equivalents: €20,000
• Accounts receivable: €5,000
• Inventory: €30,000
• Property & equipment: €50,000
• Accounts payable: €12,000
• Short-term debt: € 10,000
• Long-term debt: € 20,000
CASH RATIO = €10,000 + €20,000 = 1.36
€12,000 + €10,000
03
The figure above
indicates that
Company A possesses
enough cash and cash
equivalents to pay off
136% of its current
liabilities. Company A
is highly liquid and
can easily fund its
debt.

More Related Content

What's hot

The language of new media
The language of new mediaThe language of new media
The language of new mediasshad
 
LITERATURE AND AN OVERVIEW OF THE PHILIPPINE LITERATURE.pptx
LITERATURE AND AN OVERVIEW OF THE PHILIPPINE LITERATURE.pptxLITERATURE AND AN OVERVIEW OF THE PHILIPPINE LITERATURE.pptx
LITERATURE AND AN OVERVIEW OF THE PHILIPPINE LITERATURE.pptxAUGUSTMILBERTDRAMILO
 
EAPP_Paraphrasing and Summarizing
EAPP_Paraphrasing and SummarizingEAPP_Paraphrasing and Summarizing
EAPP_Paraphrasing and SummarizingTine Lachica
 
Media and Information Literacy (MIL) Types of Media (Part 2)- Mass Media and ...
Media and Information Literacy (MIL) Types of Media (Part 2)- Mass Media and ...Media and Information Literacy (MIL) Types of Media (Part 2)- Mass Media and ...
Media and Information Literacy (MIL) Types of Media (Part 2)- Mass Media and ...Arniel Ping
 
Lesson hypertext and intertext
Lesson hypertext and intertextLesson hypertext and intertext
Lesson hypertext and intertextCristinaGrumal
 
2.-The-Evolution-of-Traditional-Media-to-New-Media.pptx
2.-The-Evolution-of-Traditional-Media-to-New-Media.pptx2.-The-Evolution-of-Traditional-Media-to-New-Media.pptx
2.-The-Evolution-of-Traditional-Media-to-New-Media.pptxYuri Kazui
 
Topic 14 on happiness
Topic 14 on happinessTopic 14 on happiness
Topic 14 on happinessdan_maribao
 
Media Literacy Key Concepts In Media Analyzing Formative Assessment.pptx
Media Literacy Key Concepts In Media Analyzing Formative Assessment.pptxMedia Literacy Key Concepts In Media Analyzing Formative Assessment.pptx
Media Literacy Key Concepts In Media Analyzing Formative Assessment.pptxMagdaLo1
 
Reading and Writing Skills Q3 M2.docx
Reading and Writing Skills Q3 M2.docxReading and Writing Skills Q3 M2.docx
Reading and Writing Skills Q3 M2.docxBlueBarrido
 
rws-q3-module-1-shs-reading-and-writing-skills.pdf
rws-q3-module-1-shs-reading-and-writing-skills.pdfrws-q3-module-1-shs-reading-and-writing-skills.pdf
rws-q3-module-1-shs-reading-and-writing-skills.pdfKeirstine Claire Areja
 

What's hot (20)

Intertext
IntertextIntertext
Intertext
 
The language of new media
The language of new mediaThe language of new media
The language of new media
 
LITERATURE AND AN OVERVIEW OF THE PHILIPPINE LITERATURE.pptx
LITERATURE AND AN OVERVIEW OF THE PHILIPPINE LITERATURE.pptxLITERATURE AND AN OVERVIEW OF THE PHILIPPINE LITERATURE.pptx
LITERATURE AND AN OVERVIEW OF THE PHILIPPINE LITERATURE.pptx
 
EAPP-TEXT-STRUCTURE.ppt
EAPP-TEXT-STRUCTURE.pptEAPP-TEXT-STRUCTURE.ppt
EAPP-TEXT-STRUCTURE.ppt
 
Principles of delivering speech
Principles of delivering speechPrinciples of delivering speech
Principles of delivering speech
 
EAPP_Paraphrasing and Summarizing
EAPP_Paraphrasing and SummarizingEAPP_Paraphrasing and Summarizing
EAPP_Paraphrasing and Summarizing
 
Creative Non-fiction
Creative Non-fictionCreative Non-fiction
Creative Non-fiction
 
Media and Information Literacy (MIL) Types of Media (Part 2)- Mass Media and ...
Media and Information Literacy (MIL) Types of Media (Part 2)- Mass Media and ...Media and Information Literacy (MIL) Types of Media (Part 2)- Mass Media and ...
Media and Information Literacy (MIL) Types of Media (Part 2)- Mass Media and ...
 
People media
People mediaPeople media
People media
 
Online platforms and applications
Online platforms and applicationsOnline platforms and applications
Online platforms and applications
 
hypertextuality
hypertextualityhypertextuality
hypertextuality
 
Lesson hypertext and intertext
Lesson hypertext and intertextLesson hypertext and intertext
Lesson hypertext and intertext
 
News Values
News ValuesNews Values
News Values
 
2.-The-Evolution-of-Traditional-Media-to-New-Media.pptx
2.-The-Evolution-of-Traditional-Media-to-New-Media.pptx2.-The-Evolution-of-Traditional-Media-to-New-Media.pptx
2.-The-Evolution-of-Traditional-Media-to-New-Media.pptx
 
Grammar for Journalists
Grammar for JournalistsGrammar for Journalists
Grammar for Journalists
 
Topic 14 on happiness
Topic 14 on happinessTopic 14 on happiness
Topic 14 on happiness
 
Media Literacy Key Concepts In Media Analyzing Formative Assessment.pptx
Media Literacy Key Concepts In Media Analyzing Formative Assessment.pptxMedia Literacy Key Concepts In Media Analyzing Formative Assessment.pptx
Media Literacy Key Concepts In Media Analyzing Formative Assessment.pptx
 
Appeal to force
Appeal to forceAppeal to force
Appeal to force
 
Reading and Writing Skills Q3 M2.docx
Reading and Writing Skills Q3 M2.docxReading and Writing Skills Q3 M2.docx
Reading and Writing Skills Q3 M2.docx
 
rws-q3-module-1-shs-reading-and-writing-skills.pdf
rws-q3-module-1-shs-reading-and-writing-skills.pdfrws-q3-module-1-shs-reading-and-writing-skills.pdf
rws-q3-module-1-shs-reading-and-writing-skills.pdf
 

Similar to Module 20 - Understanding Financial & Liquidity Ratios.pptx

Topic 2 tools techniques of managing of inventories
Topic   2 tools   techniques of managing of inventoriesTopic   2 tools   techniques of managing of inventories
Topic 2 tools techniques of managing of inventoriesRAJKAMAL282
 
Ratios and Formulas in Customer Financial AnalysisFinancial stat.docx
Ratios and Formulas in Customer Financial AnalysisFinancial stat.docxRatios and Formulas in Customer Financial AnalysisFinancial stat.docx
Ratios and Formulas in Customer Financial AnalysisFinancial stat.docxcatheryncouper
 
accounting important regarding the importance of accounting in accounts
accounting important regarding the importance of accounting in accountsaccounting important regarding the importance of accounting in accounts
accounting important regarding the importance of accounting in accountsbalckstone358
 
Prepare a witten financial analysis. .This should include calculation.pdf
Prepare a witten financial analysis. .This should include calculation.pdfPrepare a witten financial analysis. .This should include calculation.pdf
Prepare a witten financial analysis. .This should include calculation.pdfarrowit1
 
Chapter 6_Interpretation of Financial Statement
Chapter 6_Interpretation of Financial StatementChapter 6_Interpretation of Financial Statement
Chapter 6_Interpretation of Financial StatementPresana1
 
1. key financial terms
1. key financial terms1. key financial terms
1. key financial termsKaran Tikku
 
small business & epreneurship development U4.pdf
small business & epreneurship development U4.pdfsmall business & epreneurship development U4.pdf
small business & epreneurship development U4.pdfkittustudy7
 
Accounting Concepts and Principles
Accounting Concepts and PrinciplesAccounting Concepts and Principles
Accounting Concepts and Principlesariftokymc
 
Sip 2013 15 main report-kiran mankumbre 110914
Sip 2013 15 main report-kiran mankumbre 110914Sip 2013 15 main report-kiran mankumbre 110914
Sip 2013 15 main report-kiran mankumbre 110914Kiran Mankumbre
 
Ratio analysis advantages and limitations (Complete Chapter)
Ratio analysis advantages and limitations (Complete Chapter)Ratio analysis advantages and limitations (Complete Chapter)
Ratio analysis advantages and limitations (Complete Chapter)Syed Mahmood Ali
 
No More Smoke and Mirrors: Knowing and Demonstrating Business Numbers
No More Smoke and Mirrors: Knowing and Demonstrating Business NumbersNo More Smoke and Mirrors: Knowing and Demonstrating Business Numbers
No More Smoke and Mirrors: Knowing and Demonstrating Business NumbersTheIdeaVillage
 
98C H A P T E R3 Measuring Business IncomeI ncome, o.docx
98C H A P T E R3 Measuring Business IncomeI ncome, o.docx98C H A P T E R3 Measuring Business IncomeI ncome, o.docx
98C H A P T E R3 Measuring Business IncomeI ncome, o.docxevonnehoggarth79783
 

Similar to Module 20 - Understanding Financial & Liquidity Ratios.pptx (20)

Topic 2 tools techniques of managing of inventories
Topic   2 tools   techniques of managing of inventoriesTopic   2 tools   techniques of managing of inventories
Topic 2 tools techniques of managing of inventories
 
RATIO ANALYSIS.pptx
RATIO ANALYSIS.pptxRATIO ANALYSIS.pptx
RATIO ANALYSIS.pptx
 
Ratios and Formulas in Customer Financial AnalysisFinancial stat.docx
Ratios and Formulas in Customer Financial AnalysisFinancial stat.docxRatios and Formulas in Customer Financial AnalysisFinancial stat.docx
Ratios and Formulas in Customer Financial AnalysisFinancial stat.docx
 
Ratios
RatiosRatios
Ratios
 
accounting important regarding the importance of accounting in accounts
accounting important regarding the importance of accounting in accountsaccounting important regarding the importance of accounting in accounts
accounting important regarding the importance of accounting in accounts
 
Prepare a witten financial analysis. .This should include calculation.pdf
Prepare a witten financial analysis. .This should include calculation.pdfPrepare a witten financial analysis. .This should include calculation.pdf
Prepare a witten financial analysis. .This should include calculation.pdf
 
Chapter 6_Interpretation of Financial Statement
Chapter 6_Interpretation of Financial StatementChapter 6_Interpretation of Financial Statement
Chapter 6_Interpretation of Financial Statement
 
Ratio analysis
Ratio analysisRatio analysis
Ratio analysis
 
Assignment accounts
Assignment  accountsAssignment  accounts
Assignment accounts
 
1. key financial terms
1. key financial terms1. key financial terms
1. key financial terms
 
Ratio analysis
Ratio analysisRatio analysis
Ratio analysis
 
Financial statement
Financial statementFinancial statement
Financial statement
 
small business & epreneurship development U4.pdf
small business & epreneurship development U4.pdfsmall business & epreneurship development U4.pdf
small business & epreneurship development U4.pdf
 
Accounting Concepts and Principles
Accounting Concepts and PrinciplesAccounting Concepts and Principles
Accounting Concepts and Principles
 
Sip 2013 15 main report-kiran mankumbre 110914
Sip 2013 15 main report-kiran mankumbre 110914Sip 2013 15 main report-kiran mankumbre 110914
Sip 2013 15 main report-kiran mankumbre 110914
 
Ratio analysis advantages and limitations (Complete Chapter)
Ratio analysis advantages and limitations (Complete Chapter)Ratio analysis advantages and limitations (Complete Chapter)
Ratio analysis advantages and limitations (Complete Chapter)
 
Ratio analysis1
Ratio analysis1Ratio analysis1
Ratio analysis1
 
frsa_MINI PROJECT.ppt
frsa_MINI PROJECT.pptfrsa_MINI PROJECT.ppt
frsa_MINI PROJECT.ppt
 
No More Smoke and Mirrors: Knowing and Demonstrating Business Numbers
No More Smoke and Mirrors: Knowing and Demonstrating Business NumbersNo More Smoke and Mirrors: Knowing and Demonstrating Business Numbers
No More Smoke and Mirrors: Knowing and Demonstrating Business Numbers
 
98C H A P T E R3 Measuring Business IncomeI ncome, o.docx
98C H A P T E R3 Measuring Business IncomeI ncome, o.docx98C H A P T E R3 Measuring Business IncomeI ncome, o.docx
98C H A P T E R3 Measuring Business IncomeI ncome, o.docx
 

More from caniceconsulting

Module 1 - Identifying Common Stereotypes.pptx
Module 1 - Identifying Common Stereotypes.pptxModule 1 - Identifying Common Stereotypes.pptx
Module 1 - Identifying Common Stereotypes.pptxcaniceconsulting
 
PROSPER - Module 4 Unit 3 (v2).pptx
PROSPER - Module 4 Unit 3 (v2).pptxPROSPER - Module 4 Unit 3 (v2).pptx
PROSPER - Module 4 Unit 3 (v2).pptxcaniceconsulting
 
PROSPER - Module 4 Unit 2(v2).pptx
PROSPER - Module 4 Unit 2(v2).pptxPROSPER - Module 4 Unit 2(v2).pptx
PROSPER - Module 4 Unit 2(v2).pptxcaniceconsulting
 
PROSPER - Module 4 Unit 1(v2).pptx
PROSPER - Module 4 Unit 1(v2).pptxPROSPER - Module 4 Unit 1(v2).pptx
PROSPER - Module 4 Unit 1(v2).pptxcaniceconsulting
 
PROSPER - Module 2 - Unit 3.pptx
PROSPER - Module 2 - Unit 3.pptxPROSPER - Module 2 - Unit 3.pptx
PROSPER - Module 2 - Unit 3.pptxcaniceconsulting
 
PROSPER - Module 2 - Unit 2_IT.pptx
PROSPER - Module 2 - Unit 2_IT.pptxPROSPER - Module 2 - Unit 2_IT.pptx
PROSPER - Module 2 - Unit 2_IT.pptxcaniceconsulting
 
PROSPER - Module 2 - Unit 1_IT.pptx
PROSPER - Module 2 - Unit 1_IT.pptxPROSPER - Module 2 - Unit 1_IT.pptx
PROSPER - Module 2 - Unit 1_IT.pptxcaniceconsulting
 
PROSPER - Module 3 - Unit 4 - Approcci creativi per una migliore inclusività ...
PROSPER - Module 3 - Unit 4 - Approcci creativi per una migliore inclusività ...PROSPER - Module 3 - Unit 4 - Approcci creativi per una migliore inclusività ...
PROSPER - Module 3 - Unit 4 - Approcci creativi per una migliore inclusività ...caniceconsulting
 
PROSPER - Module 3 - Unit 3 - Sviluppare senso di appartenenza nel mondo ibri...
PROSPER - Module 3 - Unit 3 - Sviluppare senso di appartenenza nel mondo ibri...PROSPER - Module 3 - Unit 3 - Sviluppare senso di appartenenza nel mondo ibri...
PROSPER - Module 3 - Unit 3 - Sviluppare senso di appartenenza nel mondo ibri...caniceconsulting
 
PROSPER - Module 3 - Unit 2 Misurare l_appartenenza digitale_IT.pptx
PROSPER - Module 3 - Unit 2 Misurare l_appartenenza digitale_IT.pptxPROSPER - Module 3 - Unit 2 Misurare l_appartenenza digitale_IT.pptx
PROSPER - Module 3 - Unit 2 Misurare l_appartenenza digitale_IT.pptxcaniceconsulting
 
PROSPER - Module 3 - Unit 1_IT.pptx
PROSPER - Module 3 - Unit 1_IT.pptxPROSPER - Module 3 - Unit 1_IT.pptx
PROSPER - Module 3 - Unit 1_IT.pptxcaniceconsulting
 
PROSPER - Module 2 - Unit 4.pptx
PROSPER - Module 2 - Unit 4.pptxPROSPER - Module 2 - Unit 4.pptx
PROSPER - Module 2 - Unit 4.pptxcaniceconsulting
 
PROSPER - Modulo 1 - Unità 5_IT.pptx
PROSPER - Modulo 1 - Unità 5_IT.pptxPROSPER - Modulo 1 - Unità 5_IT.pptx
PROSPER - Modulo 1 - Unità 5_IT.pptxcaniceconsulting
 
PROSPER - Modulo 1 - Unità 4_IT.pptx
PROSPER - Modulo 1 - Unità 4_IT.pptxPROSPER - Modulo 1 - Unità 4_IT.pptx
PROSPER - Modulo 1 - Unità 4_IT.pptxcaniceconsulting
 
PROSPER - Modulo 1 - Unità 3_IT.pptx
PROSPER - Modulo 1 - Unità 3_IT.pptxPROSPER - Modulo 1 - Unità 3_IT.pptx
PROSPER - Modulo 1 - Unità 3_IT.pptxcaniceconsulting
 
PROSPER - Modulo 1 - Unit 2_IT.pptx
PROSPER - Modulo 1 - Unit 2_IT.pptxPROSPER - Modulo 1 - Unit 2_IT.pptx
PROSPER - Modulo 1 - Unit 2_IT.pptxcaniceconsulting
 
PROSPER - Modulo 1 - Unità 1_IT.pptx
PROSPER - Modulo 1 - Unità 1_IT.pptxPROSPER - Modulo 1 - Unità 1_IT.pptx
PROSPER - Modulo 1 - Unità 1_IT.pptxcaniceconsulting
 
BG PROSPER - Module 4 - Unit 3.pptx
BG PROSPER - Module 4 - Unit 3.pptxBG PROSPER - Module 4 - Unit 3.pptx
BG PROSPER - Module 4 - Unit 3.pptxcaniceconsulting
 
BG PROSPER - Module 4 - Unit 2.pptx
BG PROSPER - Module 4 - Unit 2.pptxBG PROSPER - Module 4 - Unit 2.pptx
BG PROSPER - Module 4 - Unit 2.pptxcaniceconsulting
 
BG PROSPER - Module 4 - Unit 1.pptx
BG PROSPER - Module 4 - Unit 1.pptxBG PROSPER - Module 4 - Unit 1.pptx
BG PROSPER - Module 4 - Unit 1.pptxcaniceconsulting
 

More from caniceconsulting (20)

Module 1 - Identifying Common Stereotypes.pptx
Module 1 - Identifying Common Stereotypes.pptxModule 1 - Identifying Common Stereotypes.pptx
Module 1 - Identifying Common Stereotypes.pptx
 
PROSPER - Module 4 Unit 3 (v2).pptx
PROSPER - Module 4 Unit 3 (v2).pptxPROSPER - Module 4 Unit 3 (v2).pptx
PROSPER - Module 4 Unit 3 (v2).pptx
 
PROSPER - Module 4 Unit 2(v2).pptx
PROSPER - Module 4 Unit 2(v2).pptxPROSPER - Module 4 Unit 2(v2).pptx
PROSPER - Module 4 Unit 2(v2).pptx
 
PROSPER - Module 4 Unit 1(v2).pptx
PROSPER - Module 4 Unit 1(v2).pptxPROSPER - Module 4 Unit 1(v2).pptx
PROSPER - Module 4 Unit 1(v2).pptx
 
PROSPER - Module 2 - Unit 3.pptx
PROSPER - Module 2 - Unit 3.pptxPROSPER - Module 2 - Unit 3.pptx
PROSPER - Module 2 - Unit 3.pptx
 
PROSPER - Module 2 - Unit 2_IT.pptx
PROSPER - Module 2 - Unit 2_IT.pptxPROSPER - Module 2 - Unit 2_IT.pptx
PROSPER - Module 2 - Unit 2_IT.pptx
 
PROSPER - Module 2 - Unit 1_IT.pptx
PROSPER - Module 2 - Unit 1_IT.pptxPROSPER - Module 2 - Unit 1_IT.pptx
PROSPER - Module 2 - Unit 1_IT.pptx
 
PROSPER - Module 3 - Unit 4 - Approcci creativi per una migliore inclusività ...
PROSPER - Module 3 - Unit 4 - Approcci creativi per una migliore inclusività ...PROSPER - Module 3 - Unit 4 - Approcci creativi per una migliore inclusività ...
PROSPER - Module 3 - Unit 4 - Approcci creativi per una migliore inclusività ...
 
PROSPER - Module 3 - Unit 3 - Sviluppare senso di appartenenza nel mondo ibri...
PROSPER - Module 3 - Unit 3 - Sviluppare senso di appartenenza nel mondo ibri...PROSPER - Module 3 - Unit 3 - Sviluppare senso di appartenenza nel mondo ibri...
PROSPER - Module 3 - Unit 3 - Sviluppare senso di appartenenza nel mondo ibri...
 
PROSPER - Module 3 - Unit 2 Misurare l_appartenenza digitale_IT.pptx
PROSPER - Module 3 - Unit 2 Misurare l_appartenenza digitale_IT.pptxPROSPER - Module 3 - Unit 2 Misurare l_appartenenza digitale_IT.pptx
PROSPER - Module 3 - Unit 2 Misurare l_appartenenza digitale_IT.pptx
 
PROSPER - Module 3 - Unit 1_IT.pptx
PROSPER - Module 3 - Unit 1_IT.pptxPROSPER - Module 3 - Unit 1_IT.pptx
PROSPER - Module 3 - Unit 1_IT.pptx
 
PROSPER - Module 2 - Unit 4.pptx
PROSPER - Module 2 - Unit 4.pptxPROSPER - Module 2 - Unit 4.pptx
PROSPER - Module 2 - Unit 4.pptx
 
PROSPER - Modulo 1 - Unità 5_IT.pptx
PROSPER - Modulo 1 - Unità 5_IT.pptxPROSPER - Modulo 1 - Unità 5_IT.pptx
PROSPER - Modulo 1 - Unità 5_IT.pptx
 
PROSPER - Modulo 1 - Unità 4_IT.pptx
PROSPER - Modulo 1 - Unità 4_IT.pptxPROSPER - Modulo 1 - Unità 4_IT.pptx
PROSPER - Modulo 1 - Unità 4_IT.pptx
 
PROSPER - Modulo 1 - Unità 3_IT.pptx
PROSPER - Modulo 1 - Unità 3_IT.pptxPROSPER - Modulo 1 - Unità 3_IT.pptx
PROSPER - Modulo 1 - Unità 3_IT.pptx
 
PROSPER - Modulo 1 - Unit 2_IT.pptx
PROSPER - Modulo 1 - Unit 2_IT.pptxPROSPER - Modulo 1 - Unit 2_IT.pptx
PROSPER - Modulo 1 - Unit 2_IT.pptx
 
PROSPER - Modulo 1 - Unità 1_IT.pptx
PROSPER - Modulo 1 - Unità 1_IT.pptxPROSPER - Modulo 1 - Unità 1_IT.pptx
PROSPER - Modulo 1 - Unità 1_IT.pptx
 
BG PROSPER - Module 4 - Unit 3.pptx
BG PROSPER - Module 4 - Unit 3.pptxBG PROSPER - Module 4 - Unit 3.pptx
BG PROSPER - Module 4 - Unit 3.pptx
 
BG PROSPER - Module 4 - Unit 2.pptx
BG PROSPER - Module 4 - Unit 2.pptxBG PROSPER - Module 4 - Unit 2.pptx
BG PROSPER - Module 4 - Unit 2.pptx
 
BG PROSPER - Module 4 - Unit 1.pptx
BG PROSPER - Module 4 - Unit 1.pptxBG PROSPER - Module 4 - Unit 1.pptx
BG PROSPER - Module 4 - Unit 1.pptx
 

Recently uploaded

GRADE 4 - SUMMATIVE TEST QUARTER 4 ALL SUBJECTS
GRADE 4 - SUMMATIVE TEST QUARTER 4 ALL SUBJECTSGRADE 4 - SUMMATIVE TEST QUARTER 4 ALL SUBJECTS
GRADE 4 - SUMMATIVE TEST QUARTER 4 ALL SUBJECTSJoshuaGantuangco2
 
FILIPINO PSYCHology sikolohiyang pilipino
FILIPINO PSYCHology sikolohiyang pilipinoFILIPINO PSYCHology sikolohiyang pilipino
FILIPINO PSYCHology sikolohiyang pilipinojohnmickonozaleda
 
THEORIES OF ORGANIZATION-PUBLIC ADMINISTRATION
THEORIES OF ORGANIZATION-PUBLIC ADMINISTRATIONTHEORIES OF ORGANIZATION-PUBLIC ADMINISTRATION
THEORIES OF ORGANIZATION-PUBLIC ADMINISTRATIONHumphrey A Beña
 
4.16.24 21st Century Movements for Black Lives.pptx
4.16.24 21st Century Movements for Black Lives.pptx4.16.24 21st Century Movements for Black Lives.pptx
4.16.24 21st Century Movements for Black Lives.pptxmary850239
 
Culture Uniformity or Diversity IN SOCIOLOGY.pptx
Culture Uniformity or Diversity IN SOCIOLOGY.pptxCulture Uniformity or Diversity IN SOCIOLOGY.pptx
Culture Uniformity or Diversity IN SOCIOLOGY.pptxPoojaSen20
 
Judging the Relevance and worth of ideas part 2.pptx
Judging the Relevance  and worth of ideas part 2.pptxJudging the Relevance  and worth of ideas part 2.pptx
Judging the Relevance and worth of ideas part 2.pptxSherlyMaeNeri
 
Like-prefer-love -hate+verb+ing & silent letters & citizenship text.pdf
Like-prefer-love -hate+verb+ing & silent letters & citizenship text.pdfLike-prefer-love -hate+verb+ing & silent letters & citizenship text.pdf
Like-prefer-love -hate+verb+ing & silent letters & citizenship text.pdfMr Bounab Samir
 
Procuring digital preservation CAN be quick and painless with our new dynamic...
Procuring digital preservation CAN be quick and painless with our new dynamic...Procuring digital preservation CAN be quick and painless with our new dynamic...
Procuring digital preservation CAN be quick and painless with our new dynamic...Jisc
 
How to Add Barcode on PDF Report in Odoo 17
How to Add Barcode on PDF Report in Odoo 17How to Add Barcode on PDF Report in Odoo 17
How to Add Barcode on PDF Report in Odoo 17Celine George
 
Earth Day Presentation wow hello nice great
Earth Day Presentation wow hello nice greatEarth Day Presentation wow hello nice great
Earth Day Presentation wow hello nice greatYousafMalik24
 
Global Lehigh Strategic Initiatives (without descriptions)
Global Lehigh Strategic Initiatives (without descriptions)Global Lehigh Strategic Initiatives (without descriptions)
Global Lehigh Strategic Initiatives (without descriptions)cama23
 
ENGLISH 7_Q4_LESSON 2_ Employing a Variety of Strategies for Effective Interp...
ENGLISH 7_Q4_LESSON 2_ Employing a Variety of Strategies for Effective Interp...ENGLISH 7_Q4_LESSON 2_ Employing a Variety of Strategies for Effective Interp...
ENGLISH 7_Q4_LESSON 2_ Employing a Variety of Strategies for Effective Interp...JhezDiaz1
 
Keynote by Prof. Wurzer at Nordex about IP-design
Keynote by Prof. Wurzer at Nordex about IP-designKeynote by Prof. Wurzer at Nordex about IP-design
Keynote by Prof. Wurzer at Nordex about IP-designMIPLM
 
ECONOMIC CONTEXT - PAPER 1 Q3: NEWSPAPERS.pptx
ECONOMIC CONTEXT - PAPER 1 Q3: NEWSPAPERS.pptxECONOMIC CONTEXT - PAPER 1 Q3: NEWSPAPERS.pptx
ECONOMIC CONTEXT - PAPER 1 Q3: NEWSPAPERS.pptxiammrhaywood
 
ENGLISH6-Q4-W3.pptxqurter our high choom
ENGLISH6-Q4-W3.pptxqurter our high choomENGLISH6-Q4-W3.pptxqurter our high choom
ENGLISH6-Q4-W3.pptxqurter our high choomnelietumpap1
 
call girls in Kamla Market (DELHI) 🔝 >༒9953330565🔝 genuine Escort Service 🔝✔️✔️
call girls in Kamla Market (DELHI) 🔝 >༒9953330565🔝 genuine Escort Service 🔝✔️✔️call girls in Kamla Market (DELHI) 🔝 >༒9953330565🔝 genuine Escort Service 🔝✔️✔️
call girls in Kamla Market (DELHI) 🔝 >༒9953330565🔝 genuine Escort Service 🔝✔️✔️9953056974 Low Rate Call Girls In Saket, Delhi NCR
 
HỌC TỐT TIẾNG ANH 11 THEO CHƯƠNG TRÌNH GLOBAL SUCCESS ĐÁP ÁN CHI TIẾT - CẢ NĂ...
HỌC TỐT TIẾNG ANH 11 THEO CHƯƠNG TRÌNH GLOBAL SUCCESS ĐÁP ÁN CHI TIẾT - CẢ NĂ...HỌC TỐT TIẾNG ANH 11 THEO CHƯƠNG TRÌNH GLOBAL SUCCESS ĐÁP ÁN CHI TIẾT - CẢ NĂ...
HỌC TỐT TIẾNG ANH 11 THEO CHƯƠNG TRÌNH GLOBAL SUCCESS ĐÁP ÁN CHI TIẾT - CẢ NĂ...Nguyen Thanh Tu Collection
 
Influencing policy (training slides from Fast Track Impact)
Influencing policy (training slides from Fast Track Impact)Influencing policy (training slides from Fast Track Impact)
Influencing policy (training slides from Fast Track Impact)Mark Reed
 

Recently uploaded (20)

GRADE 4 - SUMMATIVE TEST QUARTER 4 ALL SUBJECTS
GRADE 4 - SUMMATIVE TEST QUARTER 4 ALL SUBJECTSGRADE 4 - SUMMATIVE TEST QUARTER 4 ALL SUBJECTS
GRADE 4 - SUMMATIVE TEST QUARTER 4 ALL SUBJECTS
 
FILIPINO PSYCHology sikolohiyang pilipino
FILIPINO PSYCHology sikolohiyang pilipinoFILIPINO PSYCHology sikolohiyang pilipino
FILIPINO PSYCHology sikolohiyang pilipino
 
THEORIES OF ORGANIZATION-PUBLIC ADMINISTRATION
THEORIES OF ORGANIZATION-PUBLIC ADMINISTRATIONTHEORIES OF ORGANIZATION-PUBLIC ADMINISTRATION
THEORIES OF ORGANIZATION-PUBLIC ADMINISTRATION
 
4.16.24 21st Century Movements for Black Lives.pptx
4.16.24 21st Century Movements for Black Lives.pptx4.16.24 21st Century Movements for Black Lives.pptx
4.16.24 21st Century Movements for Black Lives.pptx
 
Culture Uniformity or Diversity IN SOCIOLOGY.pptx
Culture Uniformity or Diversity IN SOCIOLOGY.pptxCulture Uniformity or Diversity IN SOCIOLOGY.pptx
Culture Uniformity or Diversity IN SOCIOLOGY.pptx
 
Judging the Relevance and worth of ideas part 2.pptx
Judging the Relevance  and worth of ideas part 2.pptxJudging the Relevance  and worth of ideas part 2.pptx
Judging the Relevance and worth of ideas part 2.pptx
 
Like-prefer-love -hate+verb+ing & silent letters & citizenship text.pdf
Like-prefer-love -hate+verb+ing & silent letters & citizenship text.pdfLike-prefer-love -hate+verb+ing & silent letters & citizenship text.pdf
Like-prefer-love -hate+verb+ing & silent letters & citizenship text.pdf
 
Procuring digital preservation CAN be quick and painless with our new dynamic...
Procuring digital preservation CAN be quick and painless with our new dynamic...Procuring digital preservation CAN be quick and painless with our new dynamic...
Procuring digital preservation CAN be quick and painless with our new dynamic...
 
YOUVE GOT EMAIL_FINALS_EL_DORADO_2024.pptx
YOUVE GOT EMAIL_FINALS_EL_DORADO_2024.pptxYOUVE GOT EMAIL_FINALS_EL_DORADO_2024.pptx
YOUVE GOT EMAIL_FINALS_EL_DORADO_2024.pptx
 
How to Add Barcode on PDF Report in Odoo 17
How to Add Barcode on PDF Report in Odoo 17How to Add Barcode on PDF Report in Odoo 17
How to Add Barcode on PDF Report in Odoo 17
 
Earth Day Presentation wow hello nice great
Earth Day Presentation wow hello nice greatEarth Day Presentation wow hello nice great
Earth Day Presentation wow hello nice great
 
Global Lehigh Strategic Initiatives (without descriptions)
Global Lehigh Strategic Initiatives (without descriptions)Global Lehigh Strategic Initiatives (without descriptions)
Global Lehigh Strategic Initiatives (without descriptions)
 
ENGLISH 7_Q4_LESSON 2_ Employing a Variety of Strategies for Effective Interp...
ENGLISH 7_Q4_LESSON 2_ Employing a Variety of Strategies for Effective Interp...ENGLISH 7_Q4_LESSON 2_ Employing a Variety of Strategies for Effective Interp...
ENGLISH 7_Q4_LESSON 2_ Employing a Variety of Strategies for Effective Interp...
 
Keynote by Prof. Wurzer at Nordex about IP-design
Keynote by Prof. Wurzer at Nordex about IP-designKeynote by Prof. Wurzer at Nordex about IP-design
Keynote by Prof. Wurzer at Nordex about IP-design
 
Raw materials used in Herbal Cosmetics.pptx
Raw materials used in Herbal Cosmetics.pptxRaw materials used in Herbal Cosmetics.pptx
Raw materials used in Herbal Cosmetics.pptx
 
ECONOMIC CONTEXT - PAPER 1 Q3: NEWSPAPERS.pptx
ECONOMIC CONTEXT - PAPER 1 Q3: NEWSPAPERS.pptxECONOMIC CONTEXT - PAPER 1 Q3: NEWSPAPERS.pptx
ECONOMIC CONTEXT - PAPER 1 Q3: NEWSPAPERS.pptx
 
ENGLISH6-Q4-W3.pptxqurter our high choom
ENGLISH6-Q4-W3.pptxqurter our high choomENGLISH6-Q4-W3.pptxqurter our high choom
ENGLISH6-Q4-W3.pptxqurter our high choom
 
call girls in Kamla Market (DELHI) 🔝 >༒9953330565🔝 genuine Escort Service 🔝✔️✔️
call girls in Kamla Market (DELHI) 🔝 >༒9953330565🔝 genuine Escort Service 🔝✔️✔️call girls in Kamla Market (DELHI) 🔝 >༒9953330565🔝 genuine Escort Service 🔝✔️✔️
call girls in Kamla Market (DELHI) 🔝 >༒9953330565🔝 genuine Escort Service 🔝✔️✔️
 
HỌC TỐT TIẾNG ANH 11 THEO CHƯƠNG TRÌNH GLOBAL SUCCESS ĐÁP ÁN CHI TIẾT - CẢ NĂ...
HỌC TỐT TIẾNG ANH 11 THEO CHƯƠNG TRÌNH GLOBAL SUCCESS ĐÁP ÁN CHI TIẾT - CẢ NĂ...HỌC TỐT TIẾNG ANH 11 THEO CHƯƠNG TRÌNH GLOBAL SUCCESS ĐÁP ÁN CHI TIẾT - CẢ NĂ...
HỌC TỐT TIẾNG ANH 11 THEO CHƯƠNG TRÌNH GLOBAL SUCCESS ĐÁP ÁN CHI TIẾT - CẢ NĂ...
 
Influencing policy (training slides from Fast Track Impact)
Influencing policy (training slides from Fast Track Impact)Influencing policy (training slides from Fast Track Impact)
Influencing policy (training slides from Fast Track Impact)
 

Module 20 - Understanding Financial & Liquidity Ratios.pptx

  • 2. Financial ratios are created with the use of numerical values taken from financial statements to gain meaningful information about a company. The numbers found on a company’s financial statements – balance sheet, income statement, and cash flow statement – are used to perform quantitative analysis and assess a company’s liquidity, leverage, growth, margins, profitability, rates of return, valuation, and more. Understanding Financial Ratios
  • 3. Liquidity Ratios 01 Leverage Ratios 02 Profitability Ratios 04 Efficiency Ratios 03 Market Value Ratios 05 Financial ratios are grouped into the following categories:
  • 4. • Liquidity ratios are financial ratios that measure a company’s ability to repay both short- and long-term obligations. • The liquidity ratios are a result of dividing cash and other liquid assets by short-term borrowings and current liabilities. They show the number of times the short-term debt obligations are covered by the cash and liquid assets. If the value is greater than 1, it means the short-term obligations are fully covered. 1. Understanding Liquidity Ratios
  • 5. Types of Liquidity Ratios Current Ratio Quick Ratio Cash Ratio Operating Cash Flow Ratio 01 02 03 04
  • 6. Current Ratio The current ratio measures a company’s ability to pay off short-term liabilities with current assets: The current ratio is probably the best known and most often used of the liquidity ratios, which analysts and investors use to evaluate the firm's ability to pay its short-term debt obligations, such as accounts payable (payments to suppliers) and taxes and wages. Short-term notes payable to a bank, for example, may also be relevant. 01 Current ratio = Current assets / Current liabilities
  • 7. Quick Ratio The quick ratio measures a company’s ability to pay off short-term liabilities with quick assets: The quick ratio is an indicator of a company’s short-term liquidity position and measures a company’s ability to meet its short-term obligations with its most liquid assets. Since it indicates the company’s ability to instantly use its near- cash assets (assets that can be converted quickly to cash) to pay down its current liabilities, it is also called the acid test ratio. An "acid test" is a slang term for a quick test designed to produce instant results. 02 Quick ratio = Current assets - Inventories / Current liabilities
  • 8. Cash Ratio The cash ratio measures a company’s ability to pay off short-term liabilities with cash and cash equivalents: The cash ratio is a measurement of a company's liquidity. It specifically calculates the ratio of a company's total cash and cash equivalents to its current liabilities. The metric evaluates company's ability to repay its short- term debt with cash or near-cash resources, such as easily marketable securities. This information is useful to creditors when they decide how much money, if any, they would be willing to loan a company. 03 Cash ratio Cash and Cash equivalents / Current Liabilities
  • 9. Operating Cash Flow Ratio The operating cash flow ratio is a measure of the number of times a company can pay off current liabilities with the cash generated in a given period: The operating cash flow ratio is a measure of how readily current liabilities are covered by the cash flows generated from a company's operations. This ratio can help gauge a company's liquidity in the short term. Using cash flow as opposed to net income is considered a cleaner or more accurate measure since earnings are more easily manipulated. 04 Operating cash flow ratio = Operating cash flow / Current liabilities
  • 10. Additional Financial Ratios Gross Profit Margin Operating Profit Margin Net Profit Margin Important Financial Ratios: Current Ratio 01 02 03 04
  • 11. Gross Profit Margin Gross profit margin is metric analysts use to assess a company's financial health by calculating the amount of money left over from product sales after subtracting the cost of goods sold (COGS). Sometimes referred to as the gross margin ratio, the gross profit margin is frequently expressed as a percentage of sales. 01 What does it tell you If a company's gross profit margin wildly fluctuates, this may signal poor management practices and/or inferior products. Such fluctuations may be justified in cases where a company makes sweeping operational changes to its business model, in which case temporary volatility should be no cause for alarm. E.g. if a company decides to automate certain supply chain functions, the initial investment may be high, but the cost of goods ultimately decreases due to the lower labour costs. How to calculate A company's gross profit margin percentage is calculated by first subtracting the cost of goods sold (COGS) from net sales (gross revenues minus returns, allowances, and discounts). This figure is then divided by net sales, to calculate the gross profit margin in percentage terms. Formula 𝐺𝑟𝑜𝑠𝑠 𝑃𝑟𝑜𝑓𝑖𝑡 𝑀𝑎𝑟𝑔𝑖𝑛 = 𝑁𝑒𝑡 𝑆𝑎𝑙𝑒𝑠 − 𝐶𝑂𝐺𝑆 𝑁𝑒𝑡 𝑆𝑎𝑙𝑒𝑠
  • 12. Operating Profit Margin A slightly more complex metric, operating profit also takes into account all overhead, operating, administrative and sales expenses necessary to run the business on a day-to-day basis. While this figure still excludes debts, taxes, and other non-operational expenses, it does include the amortization and depreciation of assets. 02 What does it tell you A company's operating profit margin ratio tells you how well the company's operations contribute to its profitability. A company with a substantial profit margin ratio makes more money on each EURO of sales than a company with a narrow profit margin. How to calculate 1.Find the operating income (EBIT) by subtracting its operational expenses, allocated depreciation, and amortization amounts from gross income. 2.Find the net sales revenue. This requires no calculation because the sales shown on the company's income statement are net sales. If that figure is unavailable, you can calculate net sales by taking the company's gross sales and subtracting its sales returns, allowances for damaged goods, and any discounts offered. 3.Calculate the operating profit margin ratio by dividing the figure from step one (operating income) by the figure from step two (net sales). Formula 𝑂𝑝𝑒𝑟𝑎𝑡𝑖𝑛𝑔 𝑃𝑟𝑜𝑓𝑖𝑡 𝑀𝑎𝑟𝑔𝑖𝑛 = 𝑂𝑝𝑒𝑟𝑎𝑡𝑖𝑛𝑔 𝐼𝑛𝑐𝑜𝑚𝑒 𝑅𝑒𝑣𝑒𝑛𝑢𝑒 ∗ 100
  • 13. Net Profit Margin The net profit margin can be used to compare performance over different periods. However, this only reveals reliable results if nothing else has changed in your expenses. 03 What does it tell you The net profit margin can indicate how well the company converts its sales into profits. This means that the percentage calculated is the percent of your revenues that are profitable. It also indicates the amount of revenue you are spending to produce your products or services. How to calculate 1. You'll have to calculate net profit and net sales, as there are generally no line items labelled as such on the income statement. Net profit is calculated by subtracting all of your expenses from your revenues. These include wages, salaries, utilities, or other expenses. 2. Net sales are the result of subtracting your allowances, returns, and discounts from your total revenue. Allowances stem from problems with a product or service which required you to reduce the price to satisfy the customer. A return is the return of an item or a refund for a service. Formula 𝑁𝑒𝑡 𝑃𝑟𝑜𝑓𝑖𝑡 𝑀𝑎𝑟𝑔𝑖𝑛 = 𝑁𝑒𝑡 𝑃𝑟𝑜𝑓𝑖𝑡𝑠 𝑁𝑒𝑡 𝑆𝑎𝑙𝑒𝑠 ∗ 100
  • 14. Important Financial Ratios: Current Ratio The current ratio is probably the best known and most often used of the liquidity ratios, which analysts and investors use to evaluate the firm's ability to pay its short-term debt obligations, such as accounts payable (payments to suppliers) and taxes and wages. Short-term notes payable to a bank, for example, may also be relevant. 04 What does it tell you Current ratio shows how many times over the firm can pay its current debt obligations based on its current, most liquid assets. If a business firm has €200 in current assets and €100 in current liabilities, the calculation is €200/€100 = 2.00X. The "X" (times) part at the end means that the firm can pay its current liabilities from its current assets two times over. This is a good financial position for a firm, meaning that it can meet its short-term debt obligations with no stress. If the current ratio is less than 1.00X, then the firm would have a problem covering its monthly bills. A higher current ratio is typically better than a lower current ratio with regard to maintaining liquidity. How to calculate The current ratio is calculated from balance sheet data using the following formula: Formula 𝐶𝑢𝑟𝑟𝑒𝑛𝑡 𝑅𝑎𝑡𝑖𝑜 = 𝐶𝑢𝑟𝑟𝑒𝑛𝑡 𝐴𝑠𝑠𝑒𝑡𝑠 𝐶𝑢𝑟𝑟𝑒𝑛𝑡 𝐿𝑖𝑎𝑏𝑖𝑙𝑖𝑡𝑖𝑒𝑠
  • 15. Optimisation of inventory management / Stock reduction 01. Inventory Selling of Receivables to reduce the time to receipt of money and the default risks 02. Factoring Reduction of payment terms / consequent management of receivables 04. Receivables Management Outsourcing of non- core functions to reduce fixed costs 03. Outsourcing Sale of fixed assets and lease back 05. Sale + Lease Back Managing Liquidity To overcome a liquidity crisis, the liquidity reserves still available in the company must be mobilised and any remaining gaps must be closed externally, either by injecting liquid funds or through standstill agreements with creditors. The recovery of sufficient creditworthiness also requires that the company can improve its rating and provide sufficient guarantees In addition to additional loans or shareholder contributions, the following possibilities are worth mentioning
  • 16. It is extremely difficult to acquire outside capital in advanced crisis phases. Banks are often no longer able to become active due to risk regulations. In principle, financiers in a crisis demand plausible restructuring concepts, sufficient securities, and higher interest rates. Managing Liquidity Leasing Loans from Customers advance payments New loans from Financiers (seasonal loans / bridging loans) Supplier Credit Deferment and Waiver by third parties Factoring Shareholder Loan (Equity) DEBT CAPITAL 04 02 03 01 05 06 07
  • 17. A solvency ratio is a key metric used to measure an enterprise’s ability to meet its long-term debt obligations and is used often by prospective business lenders. A solvency ratio indicates whether a company’s cash flow is sufficient to meet its long- term liabilities and thus is a measure of its financial health. An unfavorable ratio can indicate some likelihood that a company will default on its debt obligations. 2. Understanding Solvency Ratios
  • 18. Interest Coverage Ratio 01 Debt-to-Assets Ratio 02 Debt-to-Equity (D/E) Ratio 04 Equity Ratio 03 Understanding Solvency Ratios Types of Solvency Ratios:
  • 19. • Solvency ratios and liquidity ratios are similar but have some important differences. Both of these categories of financial ratios will indicate the health of a company. The main difference is that solvency ratios offer a longer- term outlook on a company whereas liquidity ratios focus on the shorter term. • Solvency ratios look at all assets of a company, including long-term debts such as bonds with maturities longer than a year. Liquidity ratios, on the other hand, look at just the most liquid assets, such as cash and marketable securities, and how those can be used to cover upcoming obligations in the near term. Solvency Ratios vs. Liquidity Ratios
  • 20. Source: Investopedia Solvency Ratios vs. Liquidity Ratios WATCH. To better determine the difference between liquidity and solvency.
  • 21. Examples Using Liquidity Ratios Current Ratio - Example Quick Ratio - Example Cash Ratio Example 01 02 03
  • 22. Current Ratio - Example We have two companies – Company X and Company Y and both have the same current ratio of 1.00. Over time, company X is running into too much debt or is running out of cash. If it gets worse, both can turn into solvency issues. On the other hand, consequently, company Y is seen in a positive trend, which may indicate faster turnover, better paybacks, or that the company was able to reduce debt. Another factor to consider is that if the current ratio of a company – let’s say company X, in this case, is more volatile, and shifts from 1.35 to 1.05 in a year, it indicates increased operational risk and can undermine the value of the company. 01
  • 23. Current Ratio - Example Below is the calculation of the quick ratio based on the figures that appear on the balance sheets of two leading competitors operating in the personal care industrial sector, P&G and J&J, for the fiscal year ending in 2021. 02 (in $millions) Procter & Gamble Johnson & Johnson Quick Assets (A) $15,013 $46,891 Current Liabilities (B) $33,132 $45,226 Quick Ratio (A/B) 0.45 1.04
  • 24. Current Ratio - Example With a quick ratio of over 1.0, Johnson & Johnson appears to be in a decent position to cover its current liabilities as its liquid assets are greater than the total of its short-term debt obligations. Procter & Gamble, on the other hand, may not be able to pay off its current obligations using only quick assets as its quick ratio is well below 1, at 0.45. This shows that disregarding profitability or income, Johnson & Johnson appears to be in better short-term financial health with respect to being able to meet its short-term debt requirements. 02
  • 25. Cash Ratio - Example Company A’s balance sheet lists the following items: • Cash: €10,000 • Cash equivalents: €20,000 • Accounts receivable: €5,000 • Inventory: €30,000 • Property & equipment: €50,000 • Accounts payable: €12,000 • Short-term debt: € 10,000 • Long-term debt: € 20,000 CASH RATIO = €10,000 + €20,000 = 1.36 €12,000 + €10,000 03 The figure above indicates that Company A possesses enough cash and cash equivalents to pay off 136% of its current liabilities. Company A is highly liquid and can easily fund its debt.