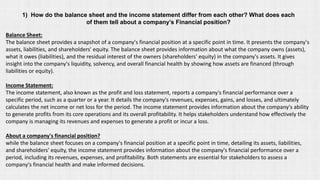
1) How do the balance sheet and the income statement differ from each other? What does each
of them tell about a company’s Financial position?
Balance Sheet:
The balance sheet provides a snapshot of a company's financial position at a specific point in time. It presents the company's
assets, liabilities, and shareholders' equity. The balance sheet provides information about what the company owns (assets),
what it owes (liabilities), and the residual interest of the owners (shareholders' equity) in the company's assets. It gives
insight into the company's liquidity, solvency, and overall financial health by showing how assets are financed (through
liabilities or equity).
Income Statement:
The income statement, also known as the profit and loss statement, reports a company's financial performance over a
specific period, such as a quarter or a year. It details the company's revenues, expenses, gains, and losses, and ultimately
calculates the net income or net loss for the period. The income statement provides information about the company's ability
to generate profits from its core operations and its overall profitability. It helps stakeholders understand how effectively the
company is managing its revenues and expenses to generate a profit or incur a loss.
About a company's financial position?
while the balance sheet focuses on a company's financial position at a specific point in time, detailing its assets, liabilities,
and shareholders' equity, the income statement provides information about the company's financial performance over a
period, including its revenues, expenses, and profitability. Both statements are essential for stakeholders to assess a
company's financial health and make informed decisions.
2) What is cash flow statement? Why it is important for assessing the company liquidity and
cash management?
A cash flow statement is a financial document that tracks the inflows and outflows of cash and cash equivalents within a
company over a specific period. It provides a detailed overview of the company's cash position by categorizing cash flows
into three main sections: operating activities, investing activities, and financing activities.
a) Operating Activities: Cash generated or used in the core business operations. This includes cash receipts from sales, cash
payments for goods and services, and other expenses related to operating the business.
b) Investing Activities: Cash used for or generated from investments in assets. This includes the purchase and sale of long-
term assets like property, plant, and equipment, as well as investments in securities.
C) Financing Activities: Cash flows related to borrowing, repaying debt, and equity financing. This includes issuing or
repurchasing stock, borrowing funds, and repaying loans.
Assessing Liquidity:
The cash flow statement helps assess a company's liquidity by showing the net increase or decrease in cash and cash
equivalents. It provides insights into whether the company is generating enough cash from its operations to meet its short-
term obligations and fund its day-to-day activities.
Evaluating Cash Management:
By analyzing the cash flow statement, stakeholders can evaluate how effectively the company is managing its cash resources.
They can assess the company's ability to generate positive operating cash flows, invest in growth opportunities, and meet its
financial obligations without relying excessively on external financing.
3) What does Mean by working capital ?
Working capital
Working capital is a measure of a company's short-term financial health and its ability to cover its day-to-day
operations. Working capital is the amount of cash and other current assets a business has available after all its
current liabilities are accounted for. It is calculated by subtracting current liabilities from current assets and is a key
indicator of a company's short-term financial health and liquidity. Working capital is essential for a business to
continue its operations, manage its cash flow, and fund its short-term business needs effectively.
It’s calculated using this simple formula:
Working Capital=Current Assets−Current Liabilities
Breaking It Down:
•Current Assets: These are assets that a company expects to convert into cash or use up within a year, such as cash,
inventory, and accounts receivable.
•Current Liabilities: These are obligations a company needs to pay off within a year, like supplier bills, short-term
loans, and other payables
4) What is the Differences between Liquidity Ratio and Solvency Ratio ?
Liquidity Ratio
The liquidity ratio helps to measure a company’s capability to
manage its short term financial obligations. The liquidity ratio
focuses on the company’s ability to clear its short term debt
obligations.
Key Ratios:
Solvency Ratio
The solvency ratio is one of the most important accounting
ratios to determine whether a company is able to meet its
long term debt obligations.
Key Ratios:
5) Why did EBITDA important? what does a positive EBITDA but negative income indicate.
EBITDA stands for Earnings Before Interest, Taxes, Depreciation, and Amortization. It is a financial metric used to evaluate
a company's profitability and overall financial performance by excluding non-operating and non-cash expenses.
For instance, if a company has an EBITDA margin of 15% while the industry average is 10%, it suggests that it is performing
relatively well in generating profits.
Here are some key reasons why EBITDA is significant:
a) It focuses on the profitability from core operations, excluding the effects of capital structure, tax rates, and non-cash
accounting items.
b) It enables easier comparison between companies in the same industry.
A positive EBITDA but negative net income indicates a few potential scenarios:
a) The company may have substantial depreciation and amortization expenses, which are non-cash charges that reduce
net income but do not affect EBITDA.
b) The company might have significant interest expenses due to heavy borrowing. Since interest is excluded from EBITDA,
this would not affect EBITDA but would reduce net income.
c) The company could be incurring high tax expenses, which are excluded from EBITDA calculations but would reduce net
income.
d) There might be one-time charges or non-operational expenses that are affecting net income but not EBITDA.
6) What does very high current ratio suggest to you about a company?
The current ratio (also referred to as the working capital ratio) is a formula that helps companies to measure their ability
to pay off their short-term liability dues within a year. It aims to show how they can maximize their current assets to settle
their short-term debts to creditors.
The formula for calculating the current ratio is given below:
Current Ratio = Current Assets/Current Liabilities
Here are some implications of a very high current ratio:
➢ The company is likely in a strong position to meet its short-term obligations, suggesting good liquidity and financial
health.
➢ It may indicate efficient management of working capital, with ample resources to cover operational expenses.
➢ An excessively high current ratio could suggest that the company is not utilizing its assets efficiently. For instance, it
might have too much cash sitting idle or an excessive amount of inventory, which could indicate inefficiencies.
➢ A high current ratio can also indicate that the company lacks attractive investment opportunities, leading it to hold
onto cash rather than investing it.
However, while a high current ratio generally signals a strong liquidity position, it should be analyzed in the context of the
industry norm and the company's overall financial strategy. A current ratio that is too high might also raise concerns about
potential inefficiencies in asset utilization or overly conservative management that could limit growth opportunities.
7) What does the a quick ratio value greater than one suggest to you ?
Quick Ratio
The Quick Ratio, also known as the Acid-test or Liquidity ratio, measures the ability of a business to pay its short-term
liabilities by having assets that are readily convertible into cash. These assets are, namely, cash, marketable
securities, and accounts receivable. These assets are known as “quick” assets since they can quickly be converted into
cash.
The formula for the quick ratio is:
Quick Ratio = (Cash and Cash Equivalents + Marketable Securities + Accounts Receivable)
Current Liabilities
or, alternatively:
Quick Ratio = (Current Assets – Inventory – Prepaid Expenses)
Current Liabilities
A quick ratio value greater than one suggests that a company has sufficient liquid assets to cover its short-term
obligations. This indicates that the company can meet its short-term debts using its most liquid assets, such as cash,
marketable securities, and accounts receivable. A quick ratio above one generally indicates that the company is in good
financial health and has a robust ability to handle short-term financial uncertainties or obligations
A very high Return on Equity (ROE) generally indicates that a company is generating significant profits relative to its
shareholders' equity. While a high ROE is typically seen as a positive indicator of a company's profitability and
management effectiveness
ROE is calculated as:
ROE= Net Income
Shareholder’s Equity​
Positive Aspects of High ROE:
➢ A high ROE suggests the company is effective at generating profits from its equity base.
➢ Indicates that the company's management is using shareholders' funds efficiently to generate earnings.
➢ High ROE often attracts investors seeking strong returns on their investments.
Recommendations as a Financial Analyst:
➢ A very high ROE could result from significant use of debt (financial leverage). High leverage increases risk, particularly
in adverse economic conditions.
➢ High ROE might be driven by unsustainable practices, such as cutting essential costs or engaging in risky ventures.
➢ If the company's equity base is very small (e.g., due to large share buybacks or dividend payouts), ROE can appear
artificially high.
8) Is a very high ROE of a company a good sign? What would you suggest as a financial analyst in this case?
9) What do you Known by Dupont analysis?
𝐃𝐮𝐩𝐨𝐧𝐭 𝐀𝐧𝐚𝐥𝐲𝐬𝐢𝐬: This method helps break down the return on equity (ROE) into its fundamental components, providing
insights into what drives profitability and how to improve it.
1. Net Profit Margin- How much profit the company gets out of it's revenue.
2. Asset Turnover- How effectively the company makes use of it's assets to generate revenue.
3. Equity Multiplier- A measure of how much the company is leveraged.
ROE=Net Margins*Asset Turnover*Equity Multiplier
Return on Assets (ROA) is broken down into:
1. Net Profit Margin- How much profit the company gets out of it's revenue.
2. Asset Turnover- How effectively the company makes use of it's assets to generate revenue.
ROA=Net Margins* Asset Turnover
DUPONT ANALYSIS helps to understand the Operational Efficiency Pricing Power and Financial Leverage of a company
10) What does price to Earning Ratio Indicate?
The Price-to-Earnings (P/E) Ratio, also known as the Price-Earnings Multiple, is a widely used financial metric that
measures the relationship between a company's share price and its earnings per share (EPS). It is calculated by dividing
the current market price of a share by the company's earnings per share. This ratio helps investors assess the relative
value of a company's stock and compare it with its historical performance, industry peers, or the overall market.
P/E Ratio= Earnings per share
Market value per share
A high Price-to-Earnings (P/E) ratio can indicate several things about a company's stock:
➢ Investors might expect high future growth in earnings. Companies with high P/E ratios are often perceived to have
strong growth potential.
➢ Some industries traditionally have higher P/E ratios due to their growth characteristics, such as technology or
biotechnology sectors.
➢ A high P/E ratio can reflect positive market sentiment and confidence in the company's future performance.
➢ Investors might consider the company to be low-risk, leading to a higher willingness to pay a premium for its earnings.
➢ It might suggest that the stock is overvalued relative to its current earnings. This can happen if the stock price has risen
significantly without a corresponding increase in earnings.

Financial_Analyst_Interview_Question_1717838909.pdf

  • 2.
    1) How dothe balance sheet and the income statement differ from each other? What does each of them tell about a company’s Financial position? Balance Sheet: The balance sheet provides a snapshot of a company's financial position at a specific point in time. It presents the company's assets, liabilities, and shareholders' equity. The balance sheet provides information about what the company owns (assets), what it owes (liabilities), and the residual interest of the owners (shareholders' equity) in the company's assets. It gives insight into the company's liquidity, solvency, and overall financial health by showing how assets are financed (through liabilities or equity). Income Statement: The income statement, also known as the profit and loss statement, reports a company's financial performance over a specific period, such as a quarter or a year. It details the company's revenues, expenses, gains, and losses, and ultimately calculates the net income or net loss for the period. The income statement provides information about the company's ability to generate profits from its core operations and its overall profitability. It helps stakeholders understand how effectively the company is managing its revenues and expenses to generate a profit or incur a loss. About a company's financial position? while the balance sheet focuses on a company's financial position at a specific point in time, detailing its assets, liabilities, and shareholders' equity, the income statement provides information about the company's financial performance over a period, including its revenues, expenses, and profitability. Both statements are essential for stakeholders to assess a company's financial health and make informed decisions.
  • 3.
    2) What iscash flow statement? Why it is important for assessing the company liquidity and cash management? A cash flow statement is a financial document that tracks the inflows and outflows of cash and cash equivalents within a company over a specific period. It provides a detailed overview of the company's cash position by categorizing cash flows into three main sections: operating activities, investing activities, and financing activities. a) Operating Activities: Cash generated or used in the core business operations. This includes cash receipts from sales, cash payments for goods and services, and other expenses related to operating the business. b) Investing Activities: Cash used for or generated from investments in assets. This includes the purchase and sale of long- term assets like property, plant, and equipment, as well as investments in securities. C) Financing Activities: Cash flows related to borrowing, repaying debt, and equity financing. This includes issuing or repurchasing stock, borrowing funds, and repaying loans. Assessing Liquidity: The cash flow statement helps assess a company's liquidity by showing the net increase or decrease in cash and cash equivalents. It provides insights into whether the company is generating enough cash from its operations to meet its short- term obligations and fund its day-to-day activities. Evaluating Cash Management: By analyzing the cash flow statement, stakeholders can evaluate how effectively the company is managing its cash resources. They can assess the company's ability to generate positive operating cash flows, invest in growth opportunities, and meet its financial obligations without relying excessively on external financing.
  • 4.
    3) What doesMean by working capital ? Working capital Working capital is a measure of a company's short-term financial health and its ability to cover its day-to-day operations. Working capital is the amount of cash and other current assets a business has available after all its current liabilities are accounted for. It is calculated by subtracting current liabilities from current assets and is a key indicator of a company's short-term financial health and liquidity. Working capital is essential for a business to continue its operations, manage its cash flow, and fund its short-term business needs effectively. It’s calculated using this simple formula: Working Capital=Current Assets−Current Liabilities Breaking It Down: •Current Assets: These are assets that a company expects to convert into cash or use up within a year, such as cash, inventory, and accounts receivable. •Current Liabilities: These are obligations a company needs to pay off within a year, like supplier bills, short-term loans, and other payables
  • 5.
    4) What isthe Differences between Liquidity Ratio and Solvency Ratio ? Liquidity Ratio The liquidity ratio helps to measure a company’s capability to manage its short term financial obligations. The liquidity ratio focuses on the company’s ability to clear its short term debt obligations. Key Ratios: Solvency Ratio The solvency ratio is one of the most important accounting ratios to determine whether a company is able to meet its long term debt obligations. Key Ratios:
  • 6.
    5) Why didEBITDA important? what does a positive EBITDA but negative income indicate. EBITDA stands for Earnings Before Interest, Taxes, Depreciation, and Amortization. It is a financial metric used to evaluate a company's profitability and overall financial performance by excluding non-operating and non-cash expenses. For instance, if a company has an EBITDA margin of 15% while the industry average is 10%, it suggests that it is performing relatively well in generating profits. Here are some key reasons why EBITDA is significant: a) It focuses on the profitability from core operations, excluding the effects of capital structure, tax rates, and non-cash accounting items. b) It enables easier comparison between companies in the same industry. A positive EBITDA but negative net income indicates a few potential scenarios: a) The company may have substantial depreciation and amortization expenses, which are non-cash charges that reduce net income but do not affect EBITDA. b) The company might have significant interest expenses due to heavy borrowing. Since interest is excluded from EBITDA, this would not affect EBITDA but would reduce net income. c) The company could be incurring high tax expenses, which are excluded from EBITDA calculations but would reduce net income. d) There might be one-time charges or non-operational expenses that are affecting net income but not EBITDA.
  • 7.
    6) What doesvery high current ratio suggest to you about a company? The current ratio (also referred to as the working capital ratio) is a formula that helps companies to measure their ability to pay off their short-term liability dues within a year. It aims to show how they can maximize their current assets to settle their short-term debts to creditors. The formula for calculating the current ratio is given below: Current Ratio = Current Assets/Current Liabilities Here are some implications of a very high current ratio: ➢ The company is likely in a strong position to meet its short-term obligations, suggesting good liquidity and financial health. ➢ It may indicate efficient management of working capital, with ample resources to cover operational expenses. ➢ An excessively high current ratio could suggest that the company is not utilizing its assets efficiently. For instance, it might have too much cash sitting idle or an excessive amount of inventory, which could indicate inefficiencies. ➢ A high current ratio can also indicate that the company lacks attractive investment opportunities, leading it to hold onto cash rather than investing it. However, while a high current ratio generally signals a strong liquidity position, it should be analyzed in the context of the industry norm and the company's overall financial strategy. A current ratio that is too high might also raise concerns about potential inefficiencies in asset utilization or overly conservative management that could limit growth opportunities.
  • 8.
    7) What doesthe a quick ratio value greater than one suggest to you ? Quick Ratio The Quick Ratio, also known as the Acid-test or Liquidity ratio, measures the ability of a business to pay its short-term liabilities by having assets that are readily convertible into cash. These assets are, namely, cash, marketable securities, and accounts receivable. These assets are known as “quick” assets since they can quickly be converted into cash. The formula for the quick ratio is: Quick Ratio = (Cash and Cash Equivalents + Marketable Securities + Accounts Receivable) Current Liabilities or, alternatively: Quick Ratio = (Current Assets – Inventory – Prepaid Expenses) Current Liabilities A quick ratio value greater than one suggests that a company has sufficient liquid assets to cover its short-term obligations. This indicates that the company can meet its short-term debts using its most liquid assets, such as cash, marketable securities, and accounts receivable. A quick ratio above one generally indicates that the company is in good financial health and has a robust ability to handle short-term financial uncertainties or obligations
  • 9.
    A very highReturn on Equity (ROE) generally indicates that a company is generating significant profits relative to its shareholders' equity. While a high ROE is typically seen as a positive indicator of a company's profitability and management effectiveness ROE is calculated as: ROE= Net Income Shareholder’s Equity​ Positive Aspects of High ROE: ➢ A high ROE suggests the company is effective at generating profits from its equity base. ➢ Indicates that the company's management is using shareholders' funds efficiently to generate earnings. ➢ High ROE often attracts investors seeking strong returns on their investments. Recommendations as a Financial Analyst: ➢ A very high ROE could result from significant use of debt (financial leverage). High leverage increases risk, particularly in adverse economic conditions. ➢ High ROE might be driven by unsustainable practices, such as cutting essential costs or engaging in risky ventures. ➢ If the company's equity base is very small (e.g., due to large share buybacks or dividend payouts), ROE can appear artificially high. 8) Is a very high ROE of a company a good sign? What would you suggest as a financial analyst in this case?
  • 10.
    9) What doyou Known by Dupont analysis? 𝐃𝐮𝐩𝐨𝐧𝐭 𝐀𝐧𝐚𝐥𝐲𝐬𝐢𝐬: This method helps break down the return on equity (ROE) into its fundamental components, providing insights into what drives profitability and how to improve it. 1. Net Profit Margin- How much profit the company gets out of it's revenue. 2. Asset Turnover- How effectively the company makes use of it's assets to generate revenue. 3. Equity Multiplier- A measure of how much the company is leveraged. ROE=Net Margins*Asset Turnover*Equity Multiplier Return on Assets (ROA) is broken down into: 1. Net Profit Margin- How much profit the company gets out of it's revenue. 2. Asset Turnover- How effectively the company makes use of it's assets to generate revenue. ROA=Net Margins* Asset Turnover DUPONT ANALYSIS helps to understand the Operational Efficiency Pricing Power and Financial Leverage of a company
  • 11.
    10) What doesprice to Earning Ratio Indicate? The Price-to-Earnings (P/E) Ratio, also known as the Price-Earnings Multiple, is a widely used financial metric that measures the relationship between a company's share price and its earnings per share (EPS). It is calculated by dividing the current market price of a share by the company's earnings per share. This ratio helps investors assess the relative value of a company's stock and compare it with its historical performance, industry peers, or the overall market. P/E Ratio= Earnings per share Market value per share A high Price-to-Earnings (P/E) ratio can indicate several things about a company's stock: ➢ Investors might expect high future growth in earnings. Companies with high P/E ratios are often perceived to have strong growth potential. ➢ Some industries traditionally have higher P/E ratios due to their growth characteristics, such as technology or biotechnology sectors. ➢ A high P/E ratio can reflect positive market sentiment and confidence in the company's future performance. ➢ Investors might consider the company to be low-risk, leading to a higher willingness to pay a premium for its earnings. ➢ It might suggest that the stock is overvalued relative to its current earnings. This can happen if the stock price has risen significantly without a corresponding increase in earnings.