Download as PDF, PPTX


Prometheus is an open-source monitoring system inspired by Google's Borgmon, designed to provide inclusive and powerful monitoring solutions for businesses. It offers a scalable and manageable infrastructure with an advanced query language and supports various integrations, making it suitable for diverse environments. Robust Perception is an independent provider of Prometheus-related services, assisting organizations in implementing and optimizing their monitoring strategies.
Introduction to Prometheus and the importance of effective monitoring in monitoring systems.
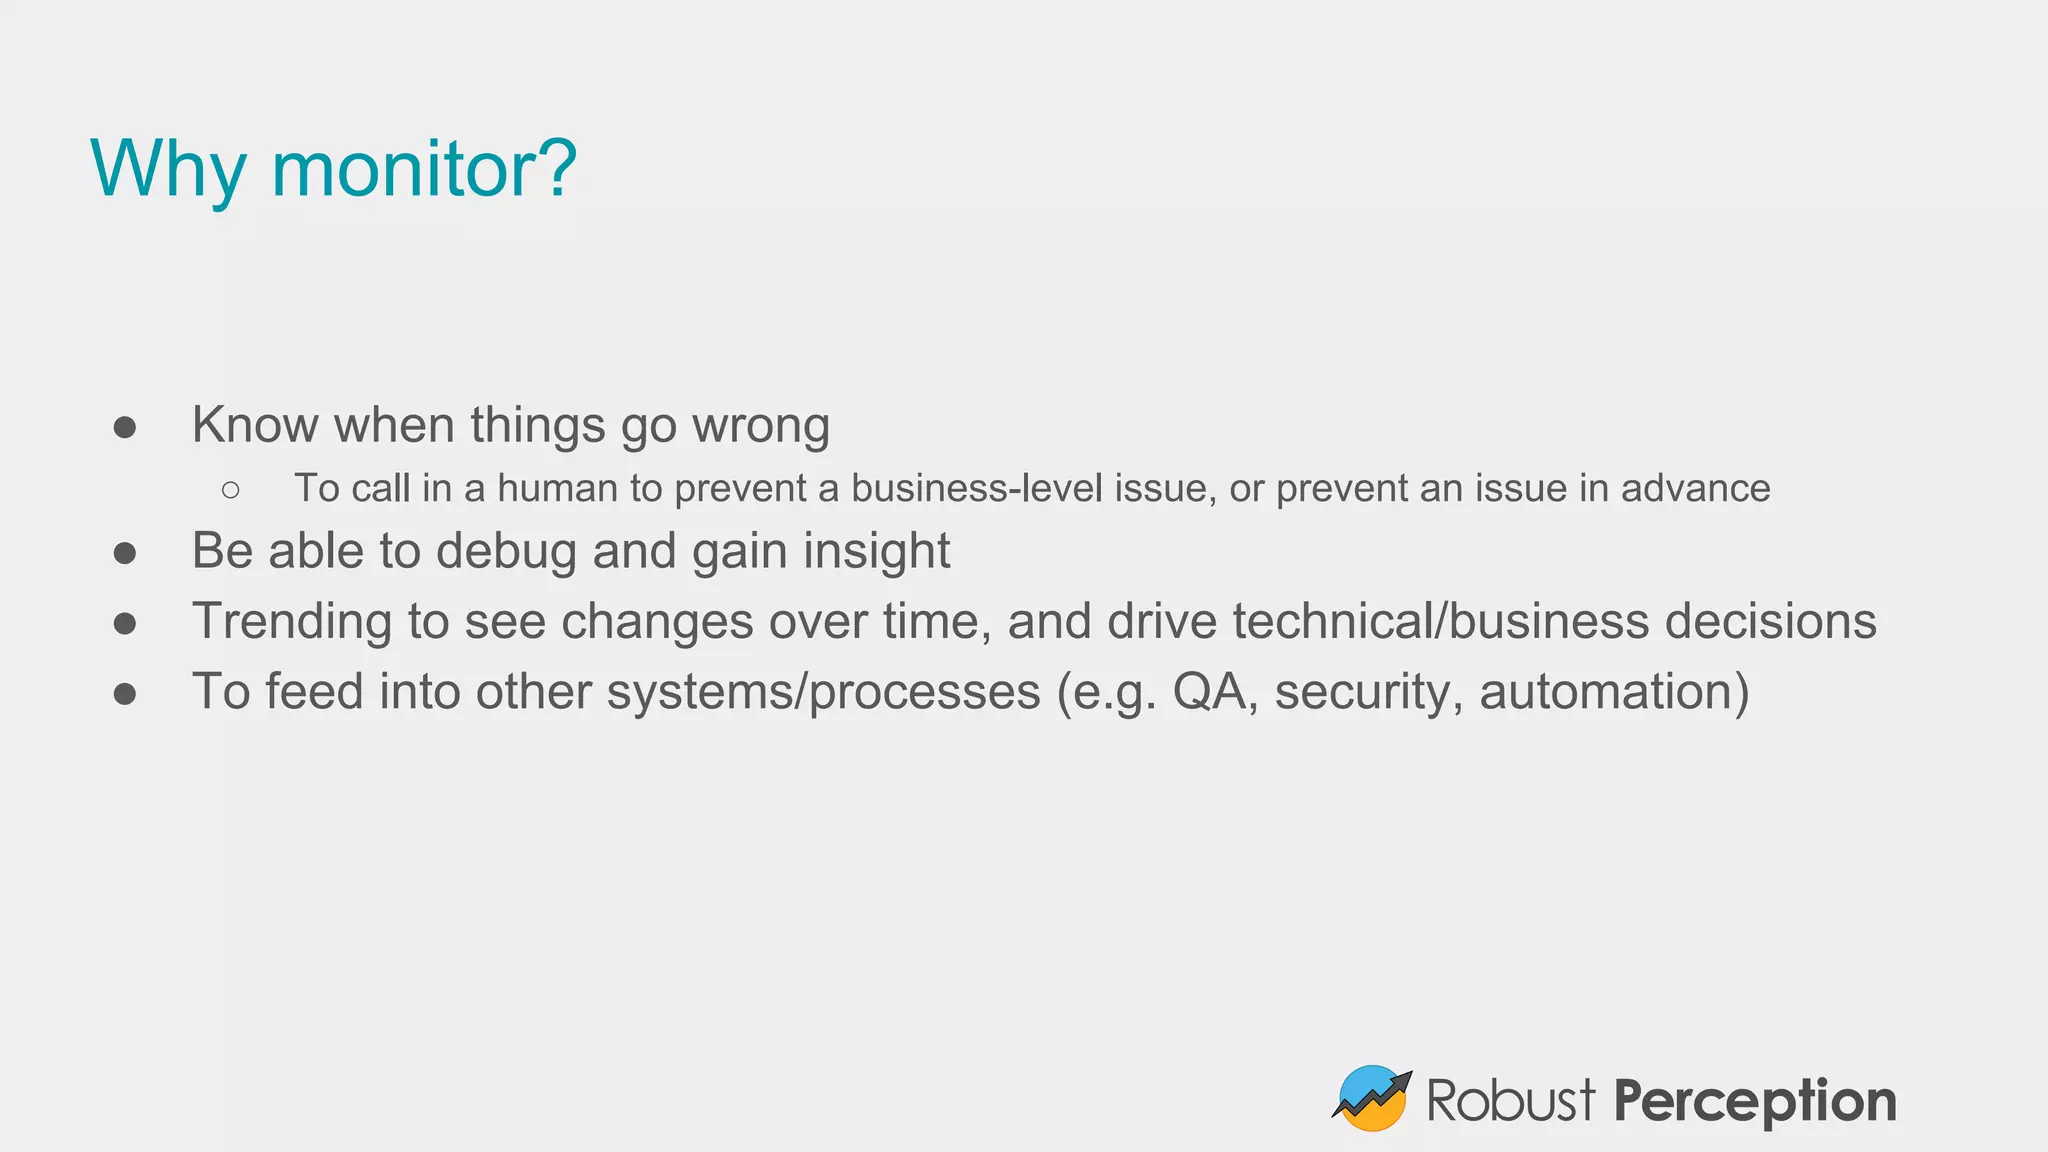
Discusses the significance of monitoring for troubleshooting, gaining insights, and driving decisions.
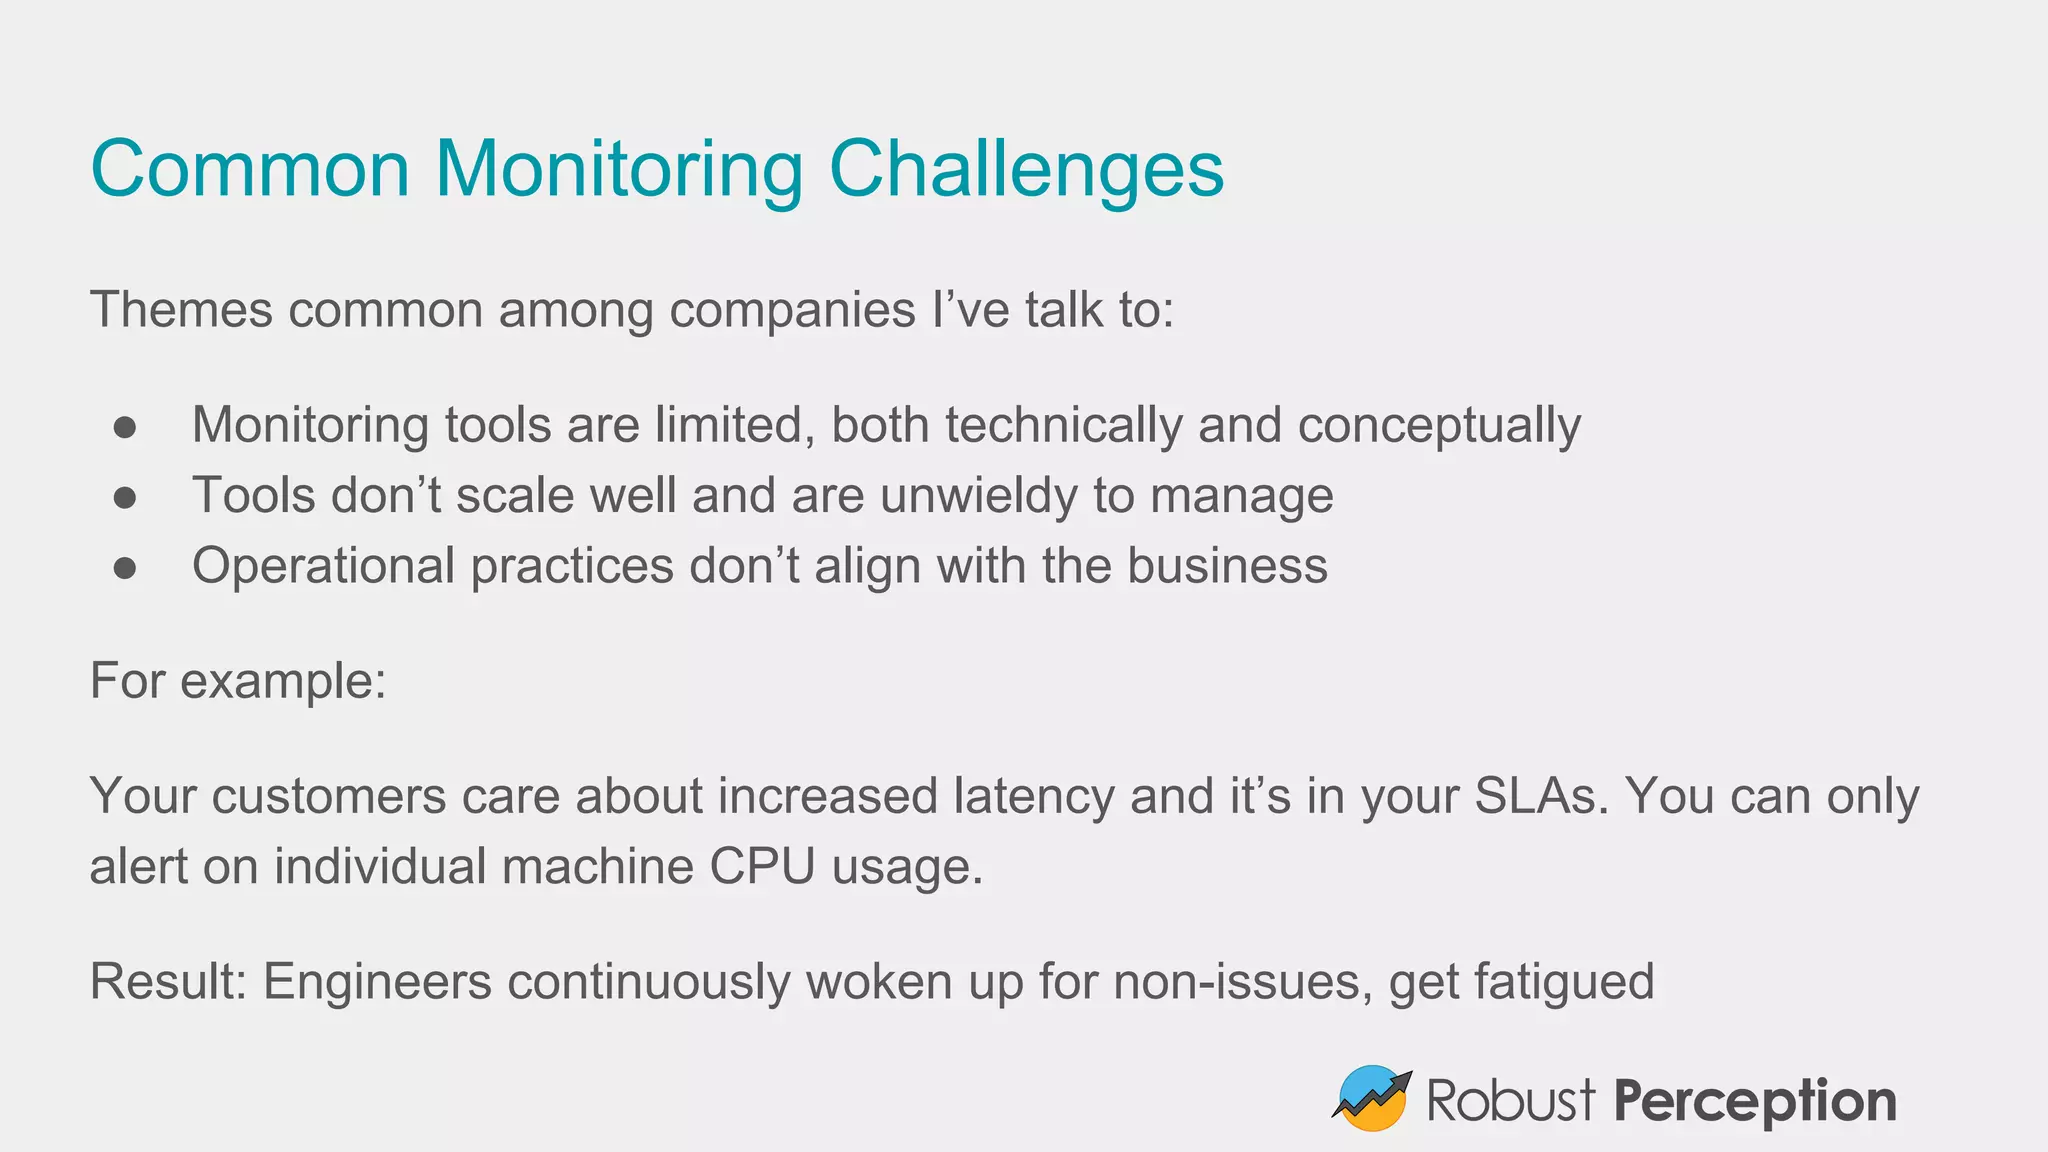
Highlights common challenges faced in monitoring, including tool limitations and alignment with business needs.
Introduces Prometheus, its inspiration, features, and its evolution as a leading open-source monitoring tool.
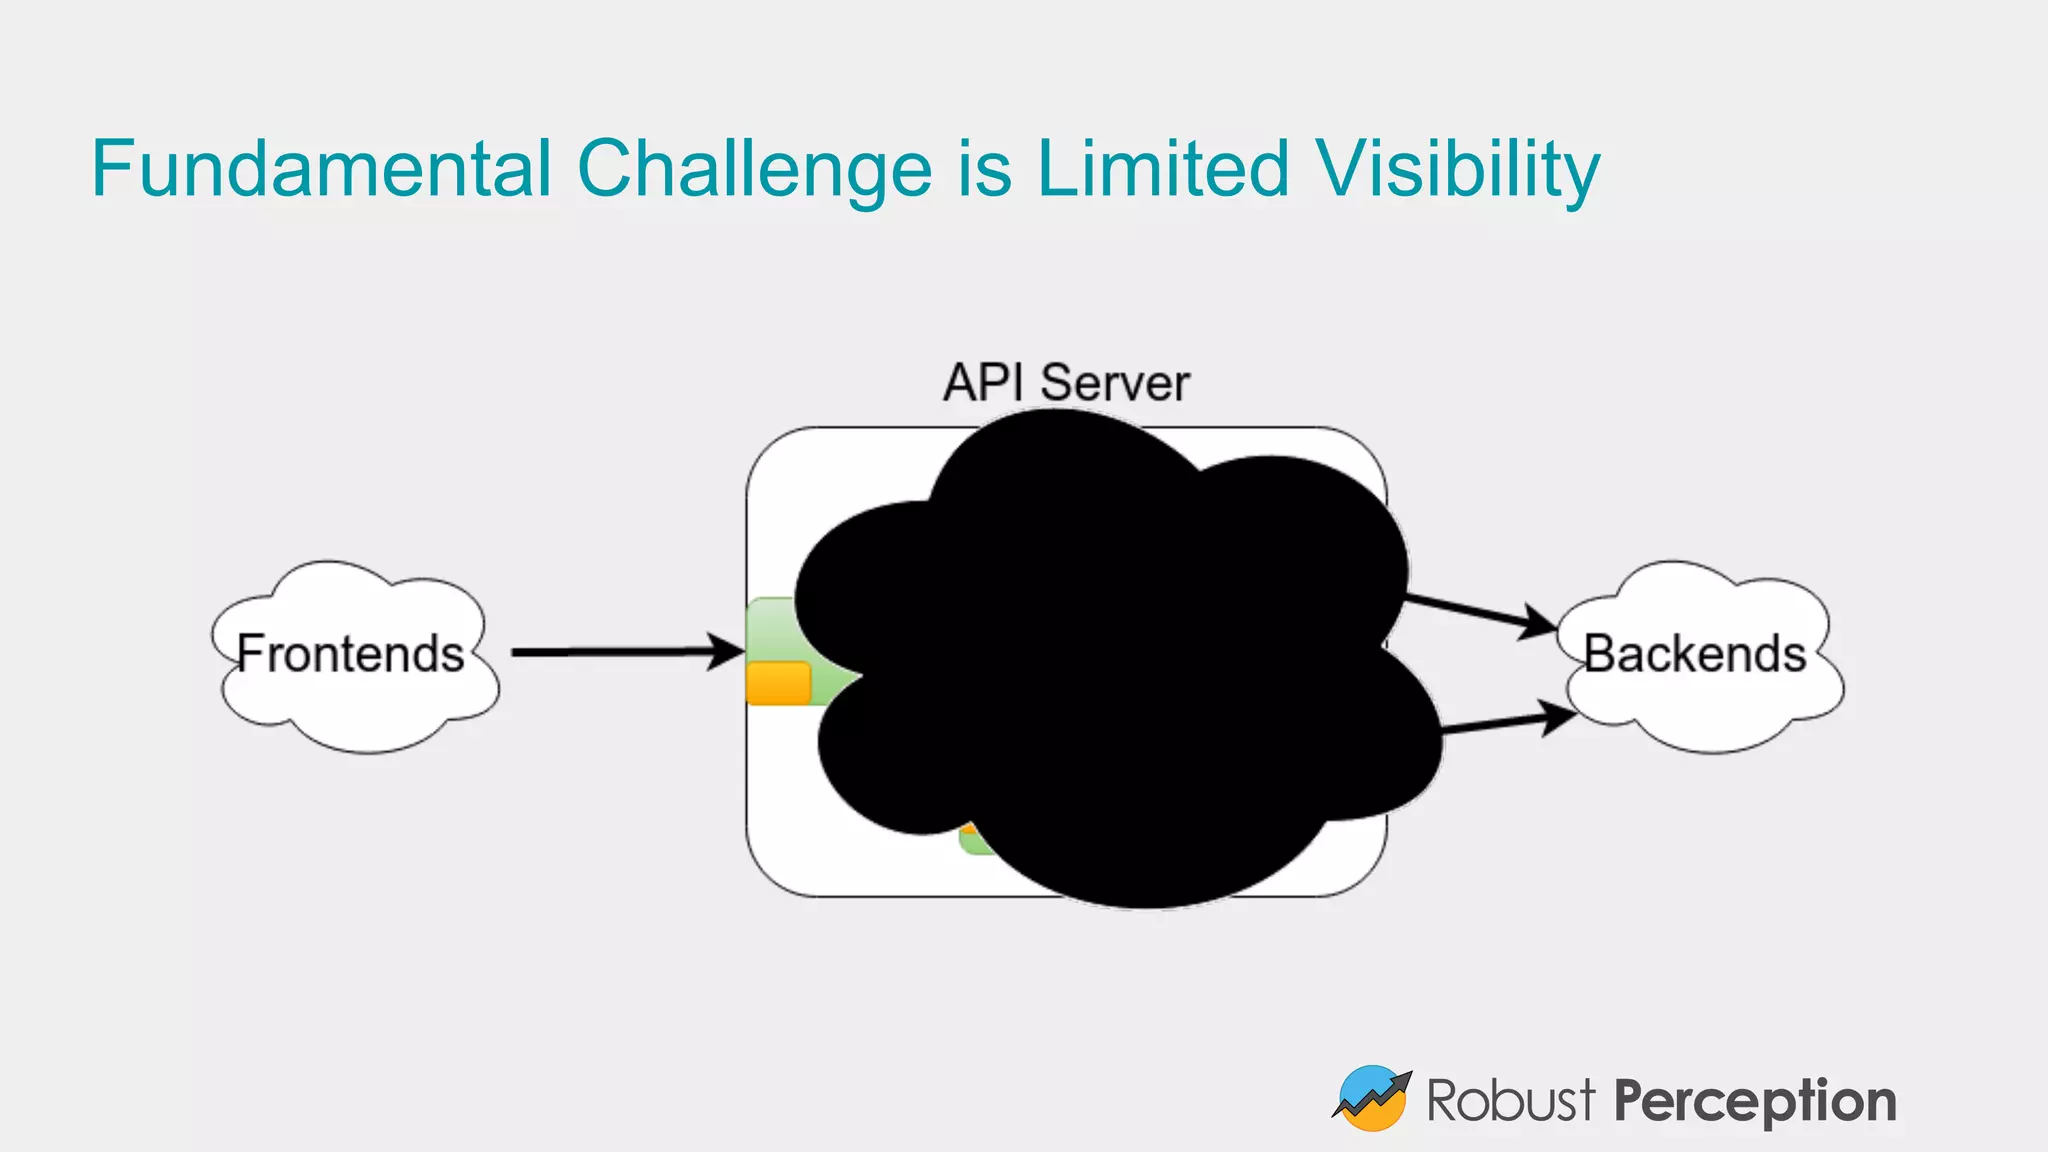
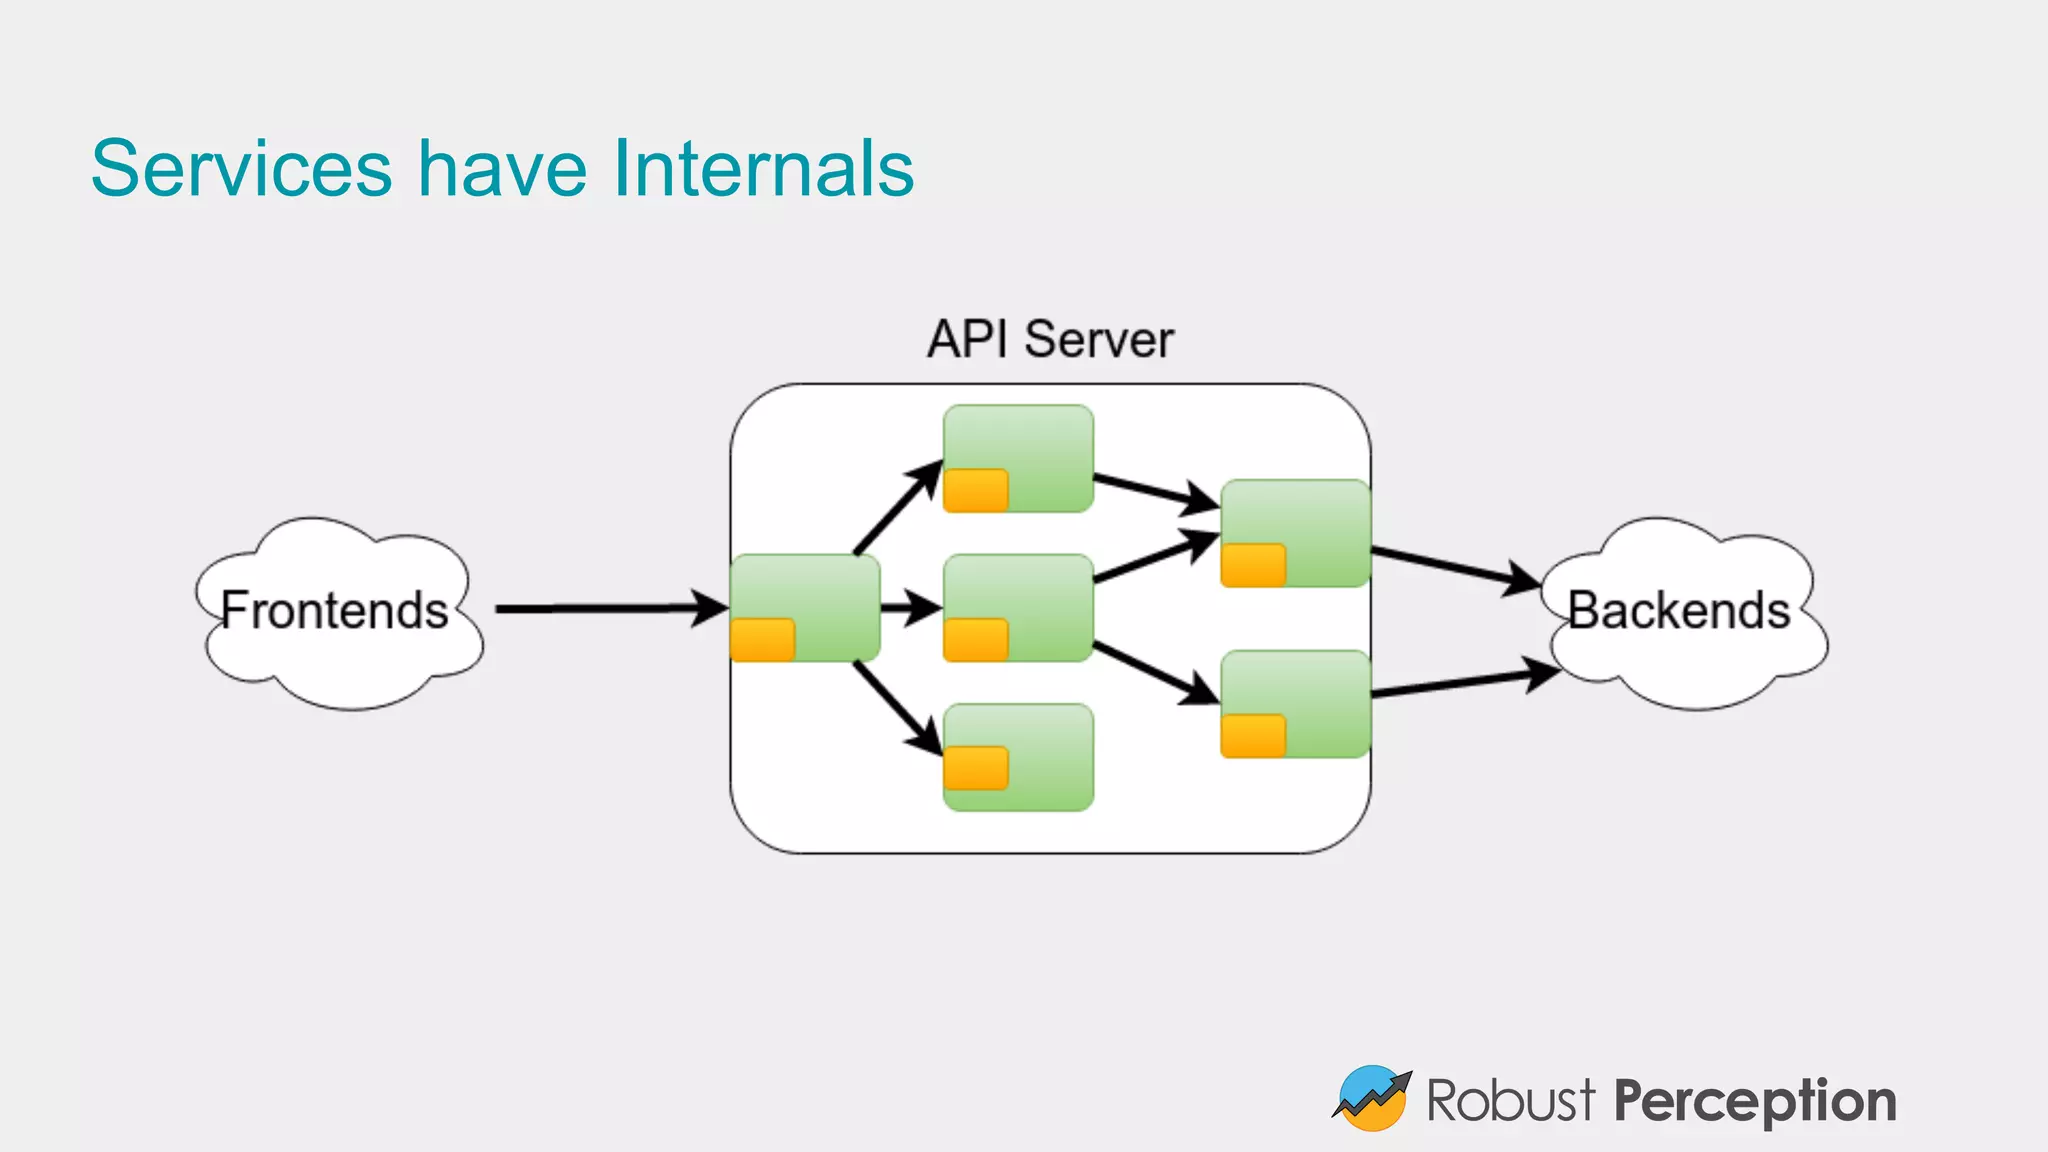
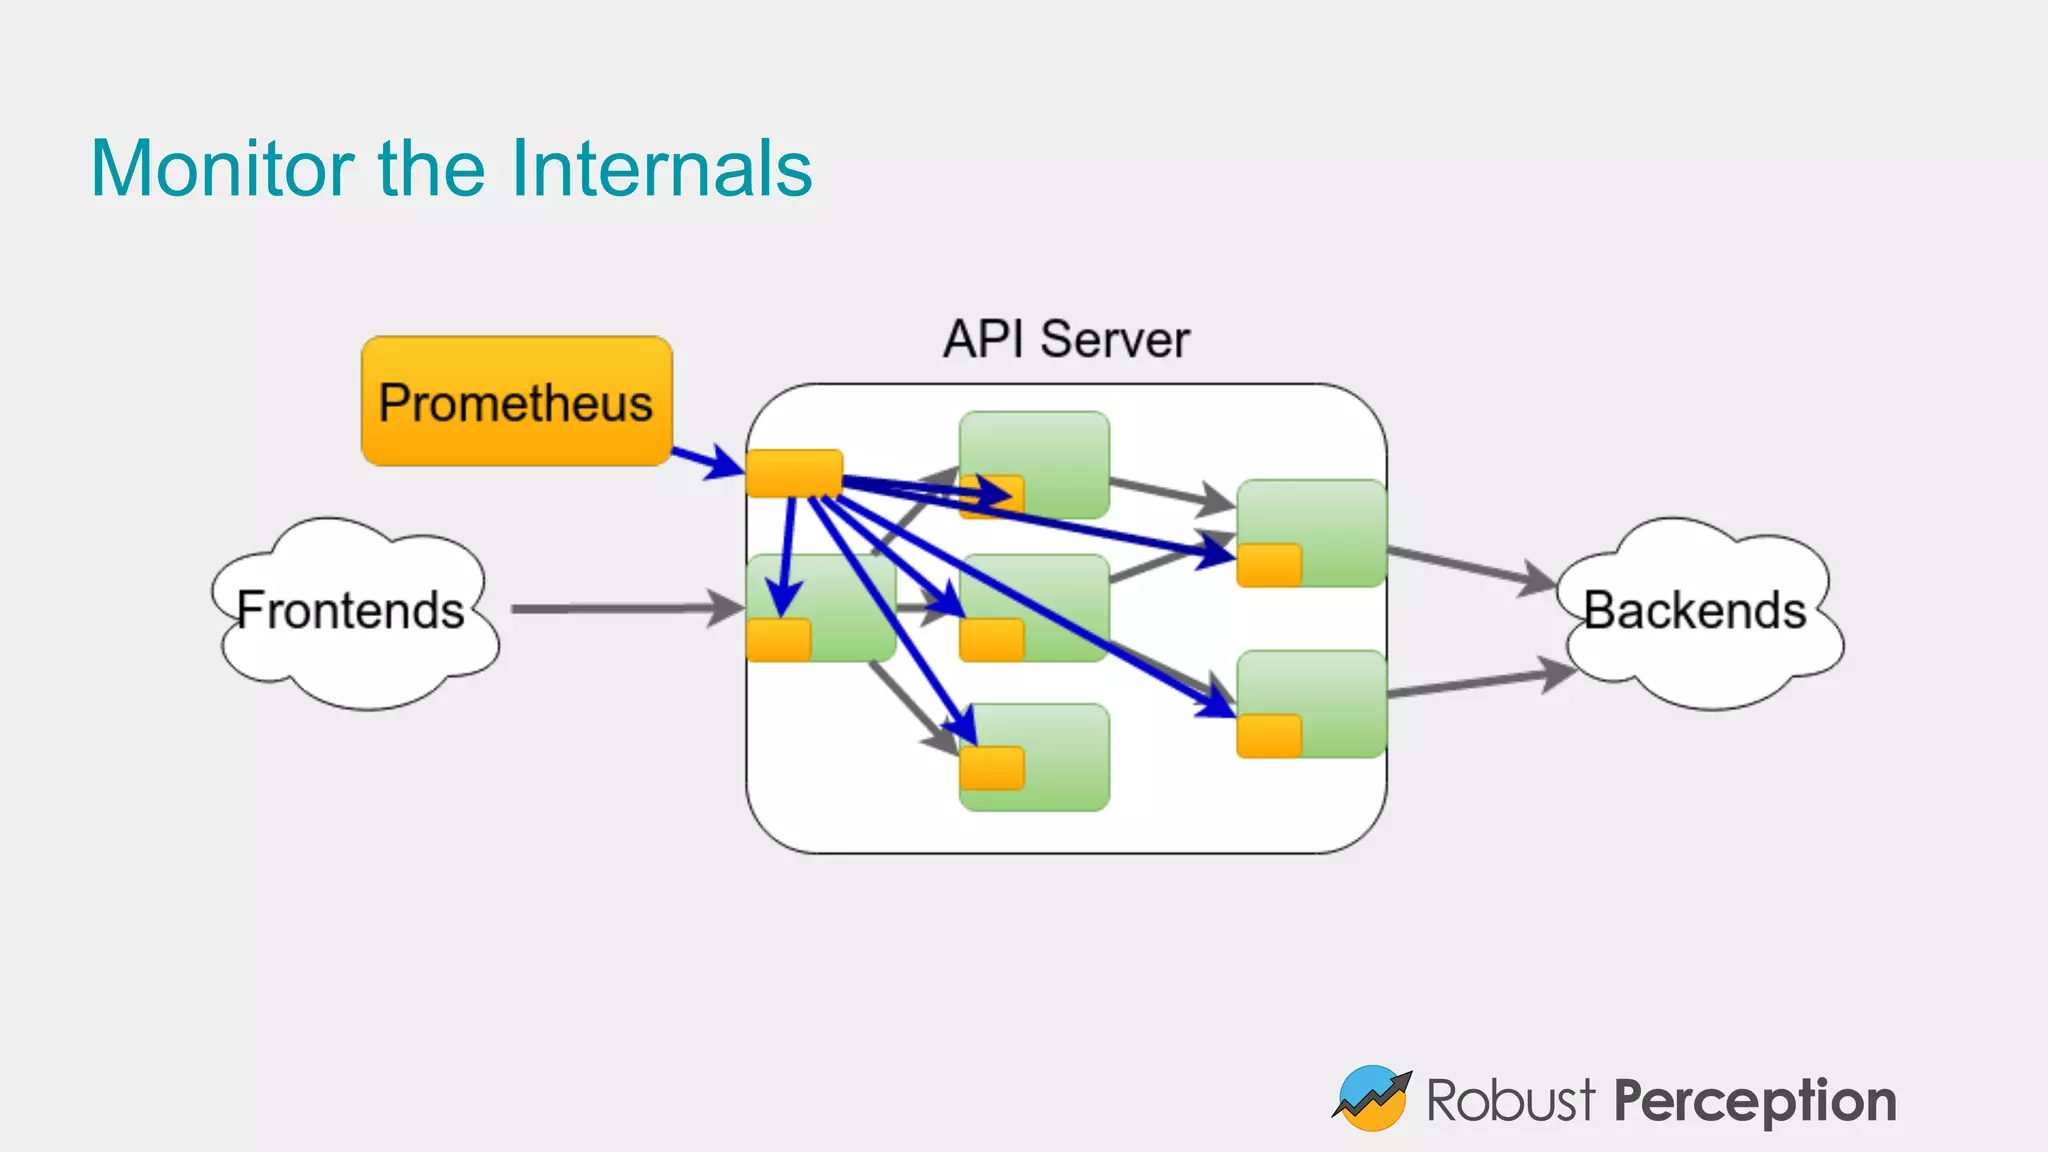
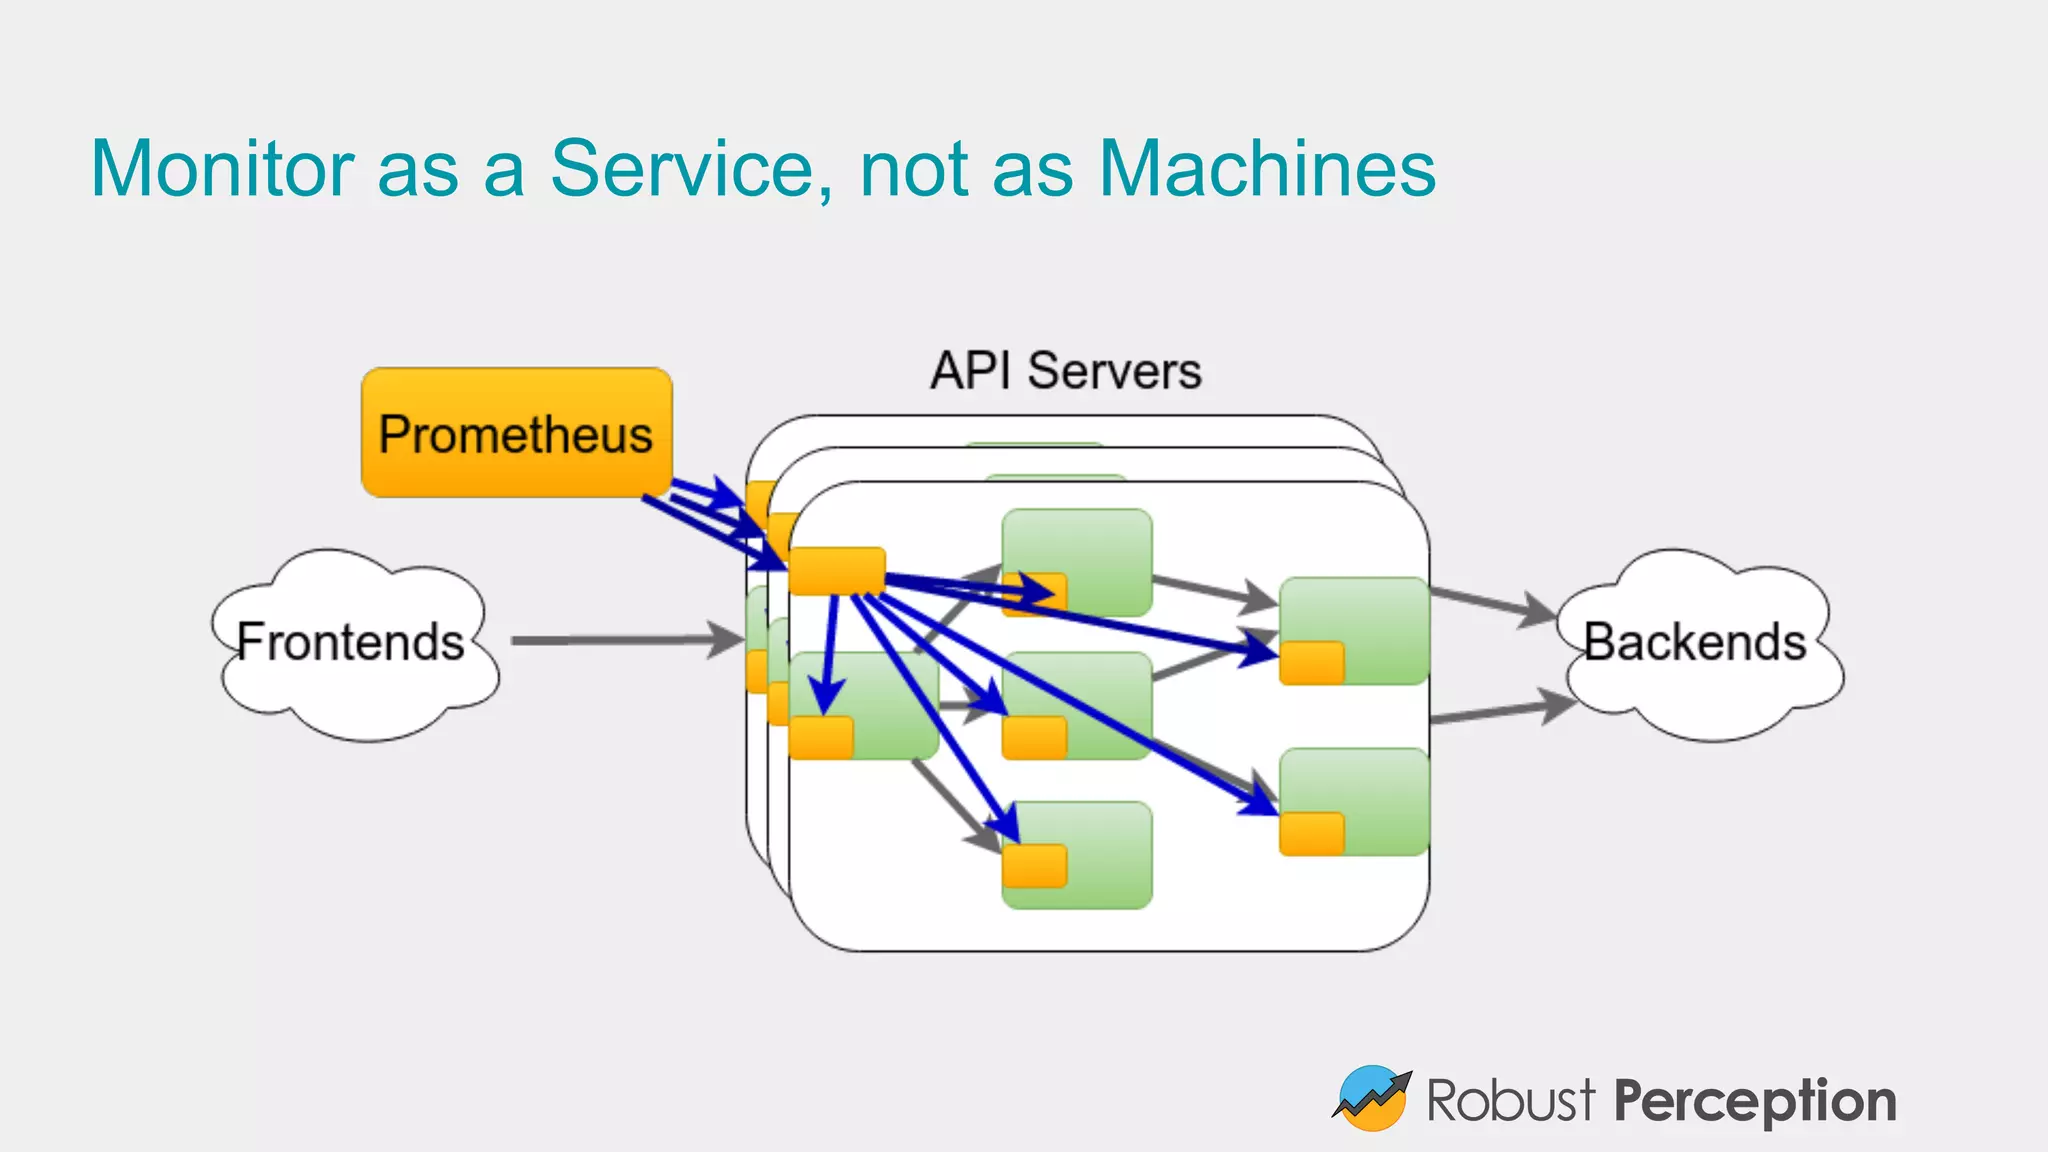
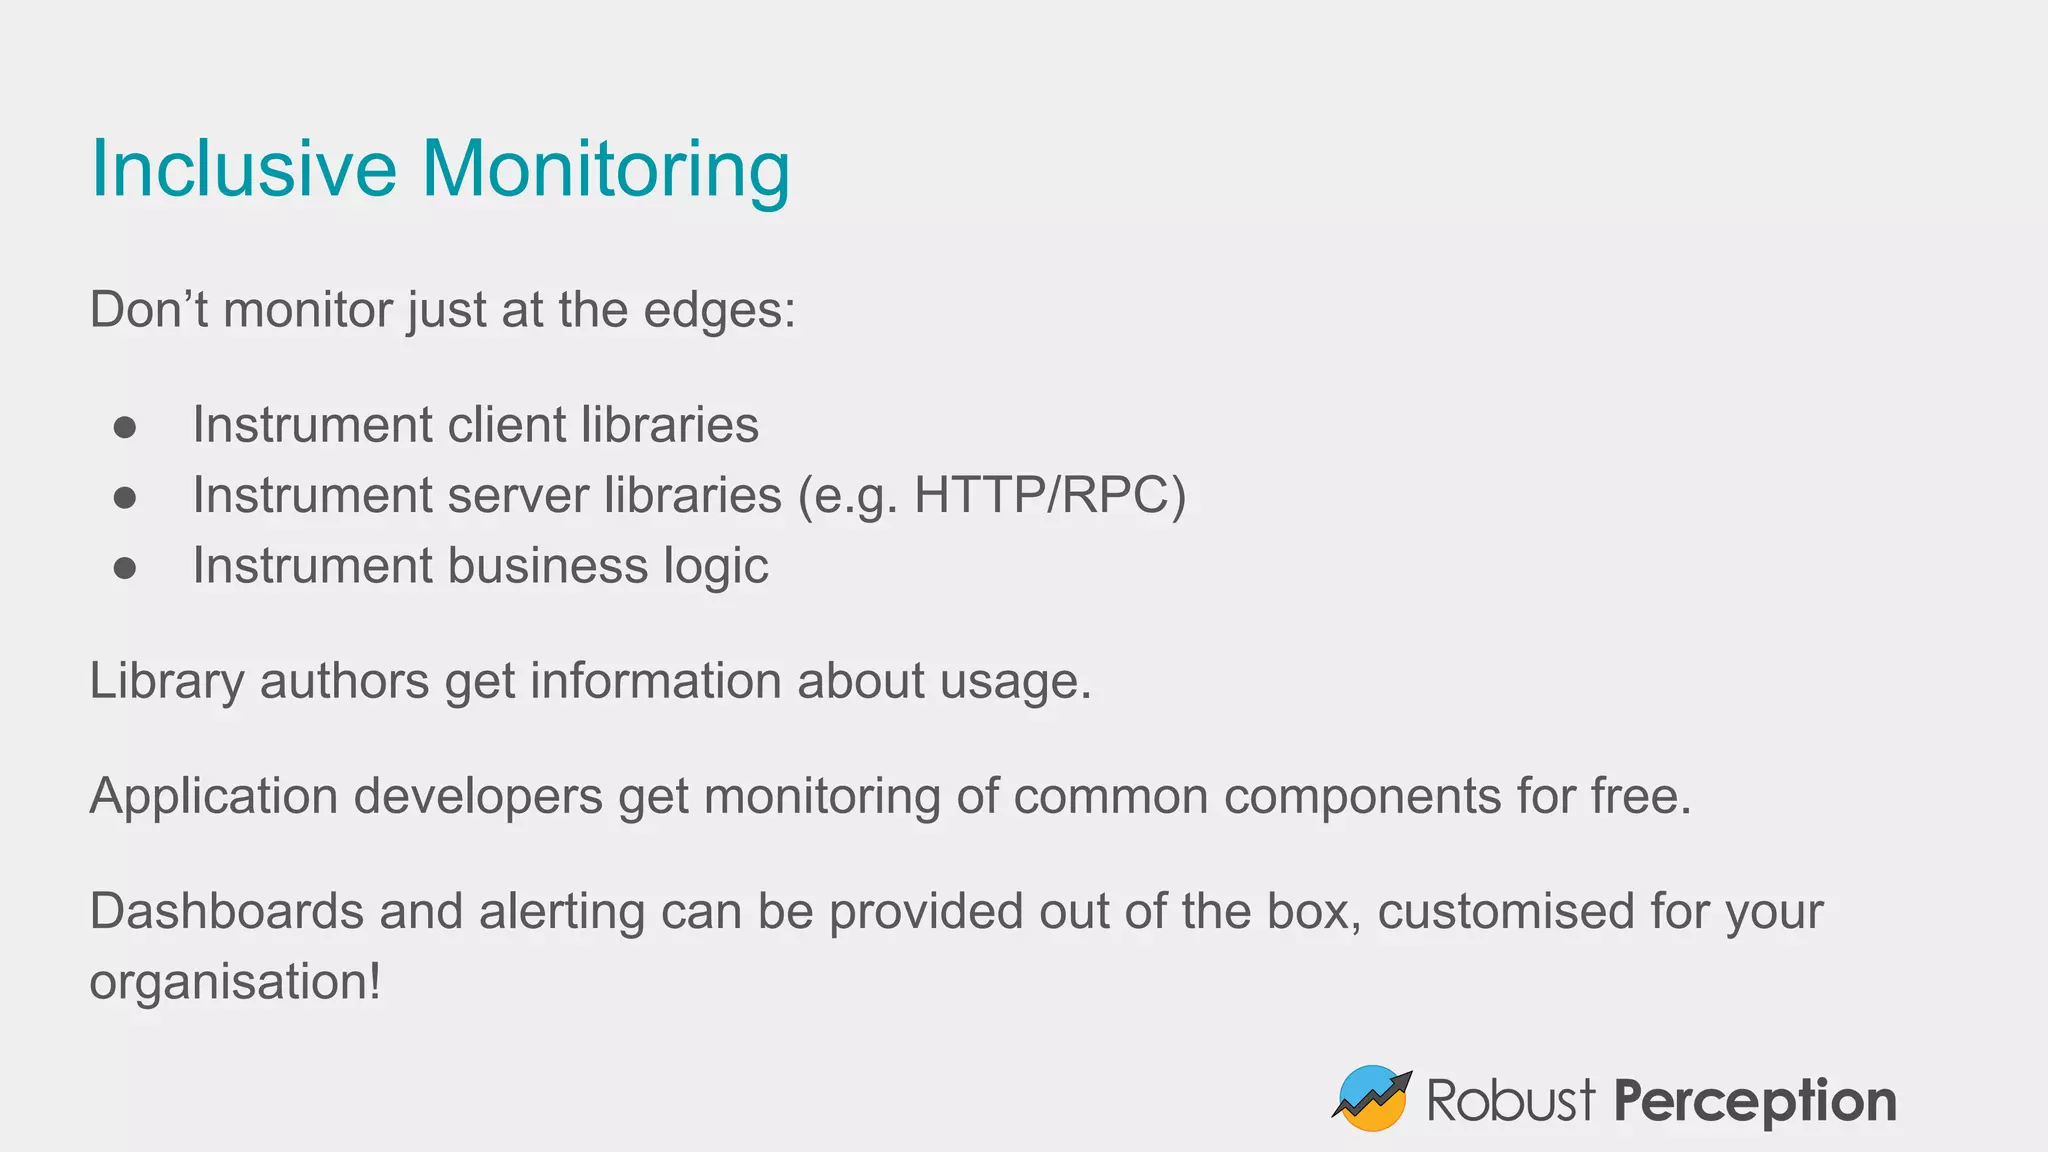
Emphasizes the importance of monitoring service internals and adopting inclusive monitoring practices.
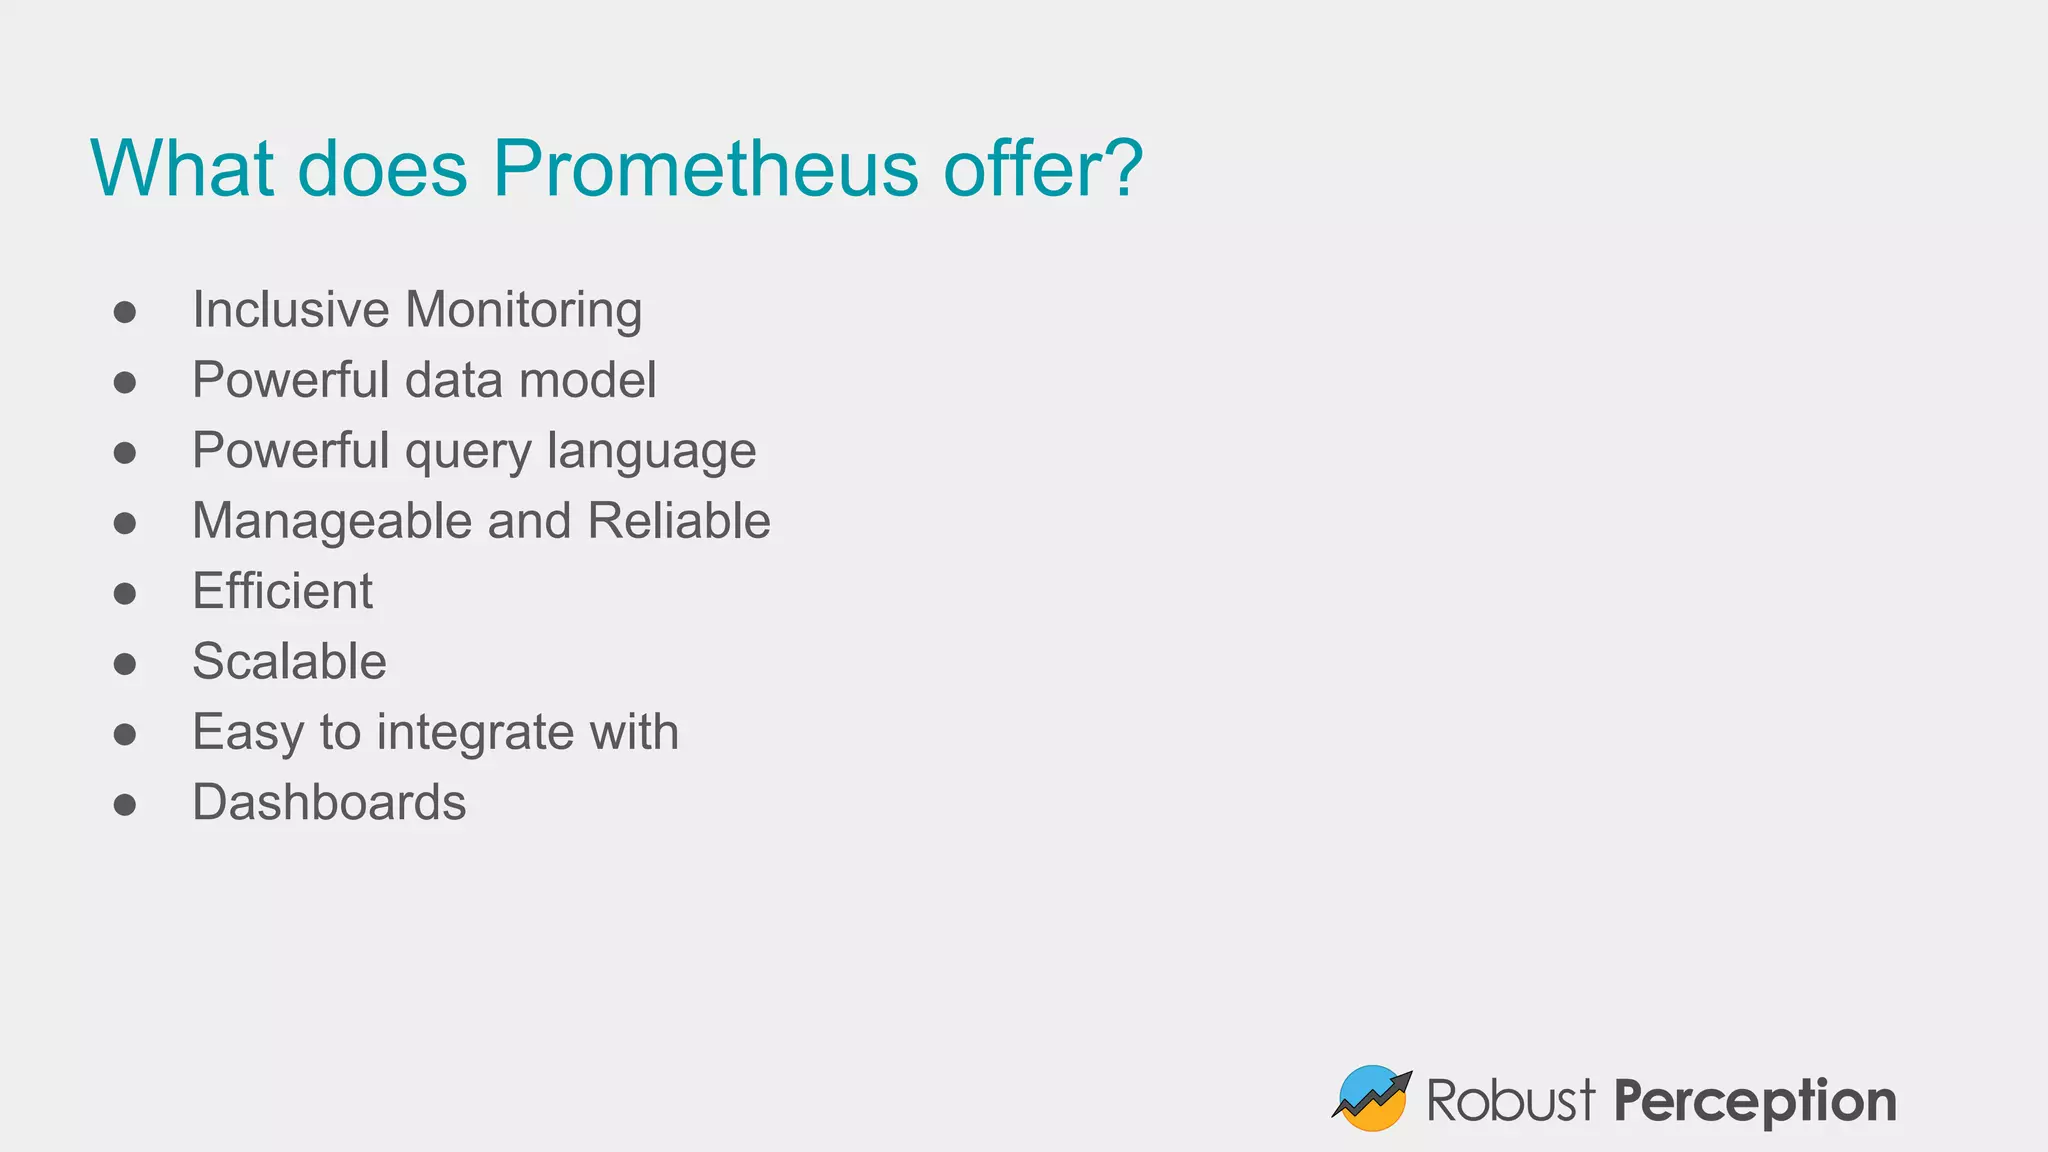
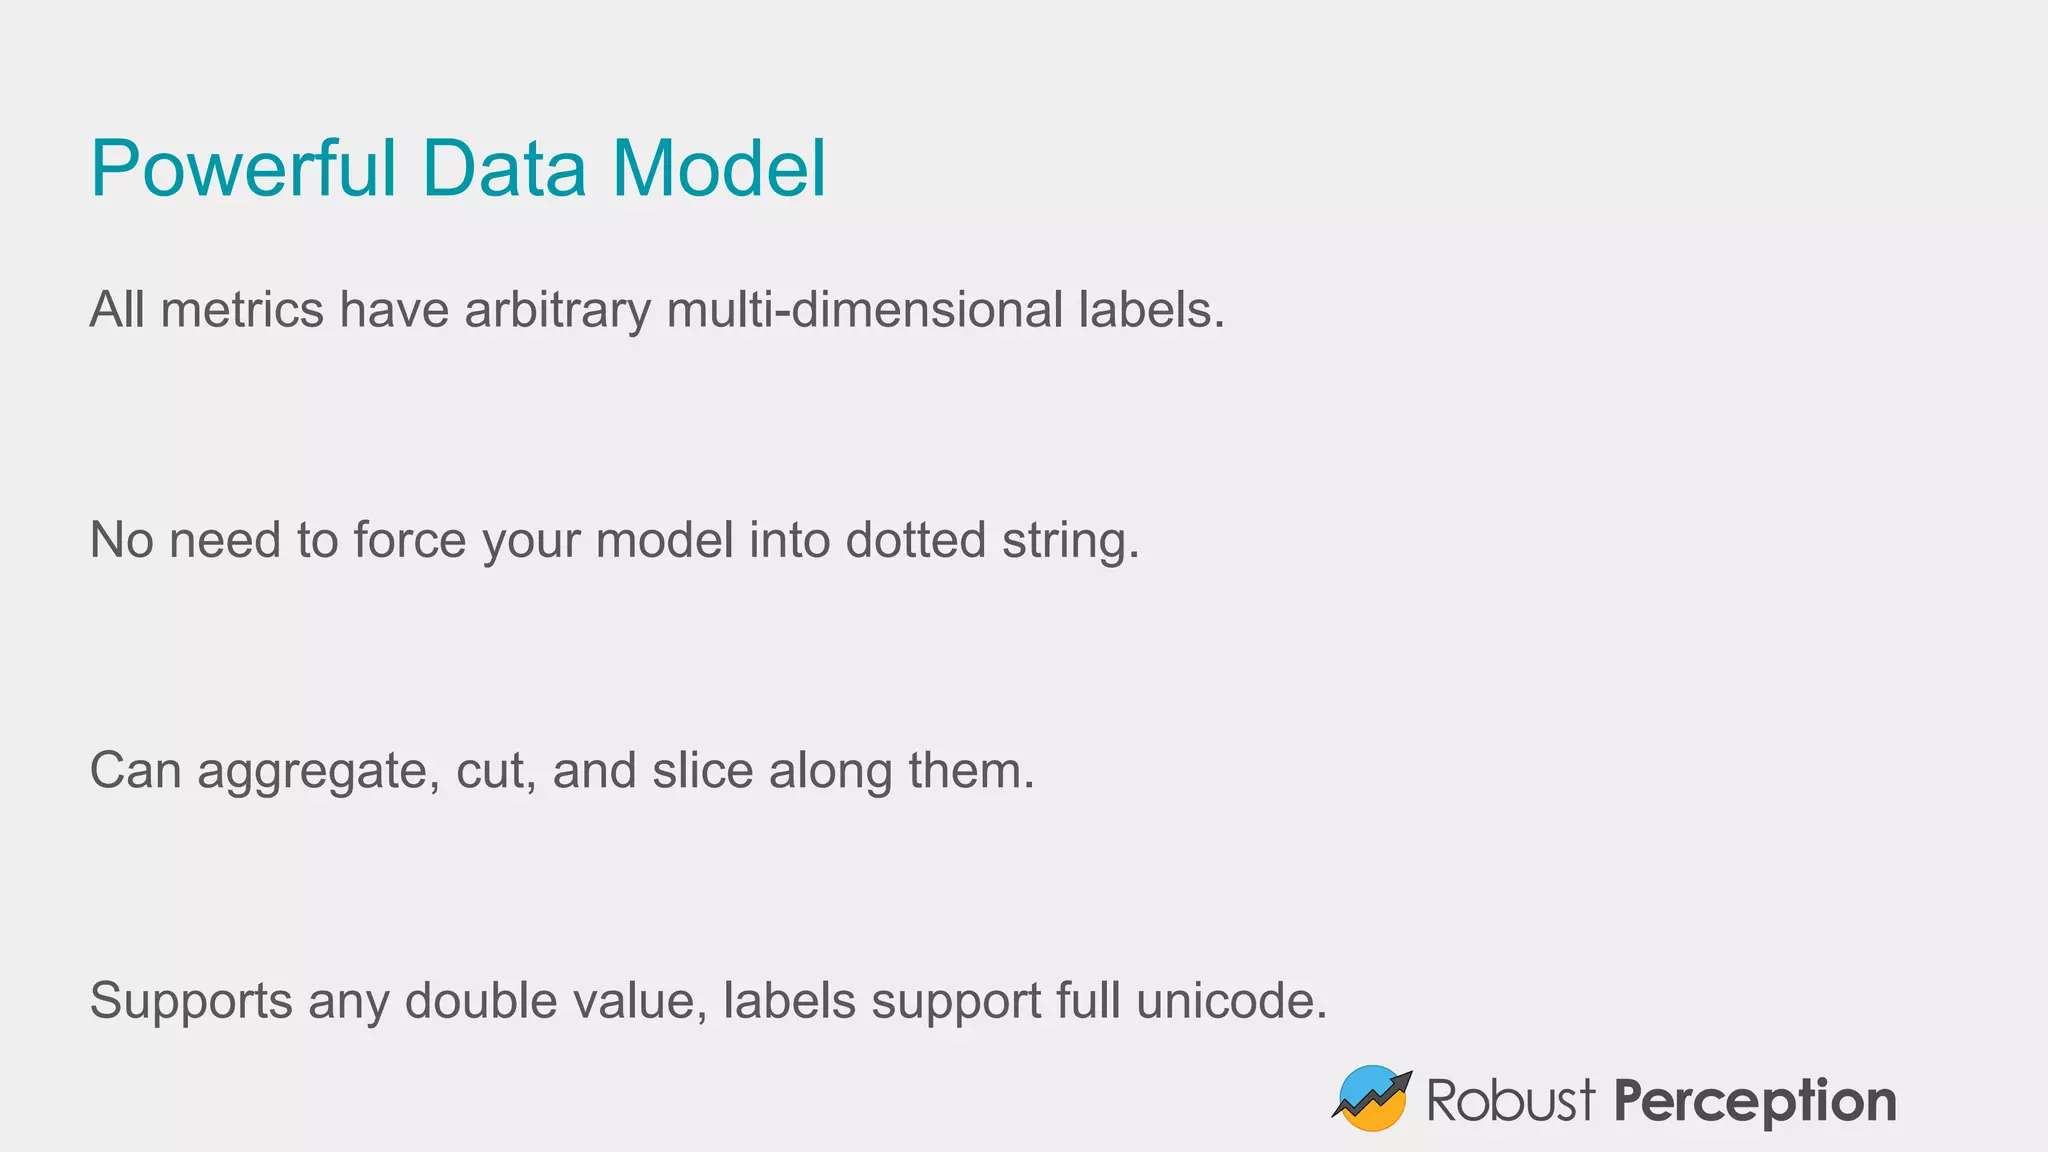
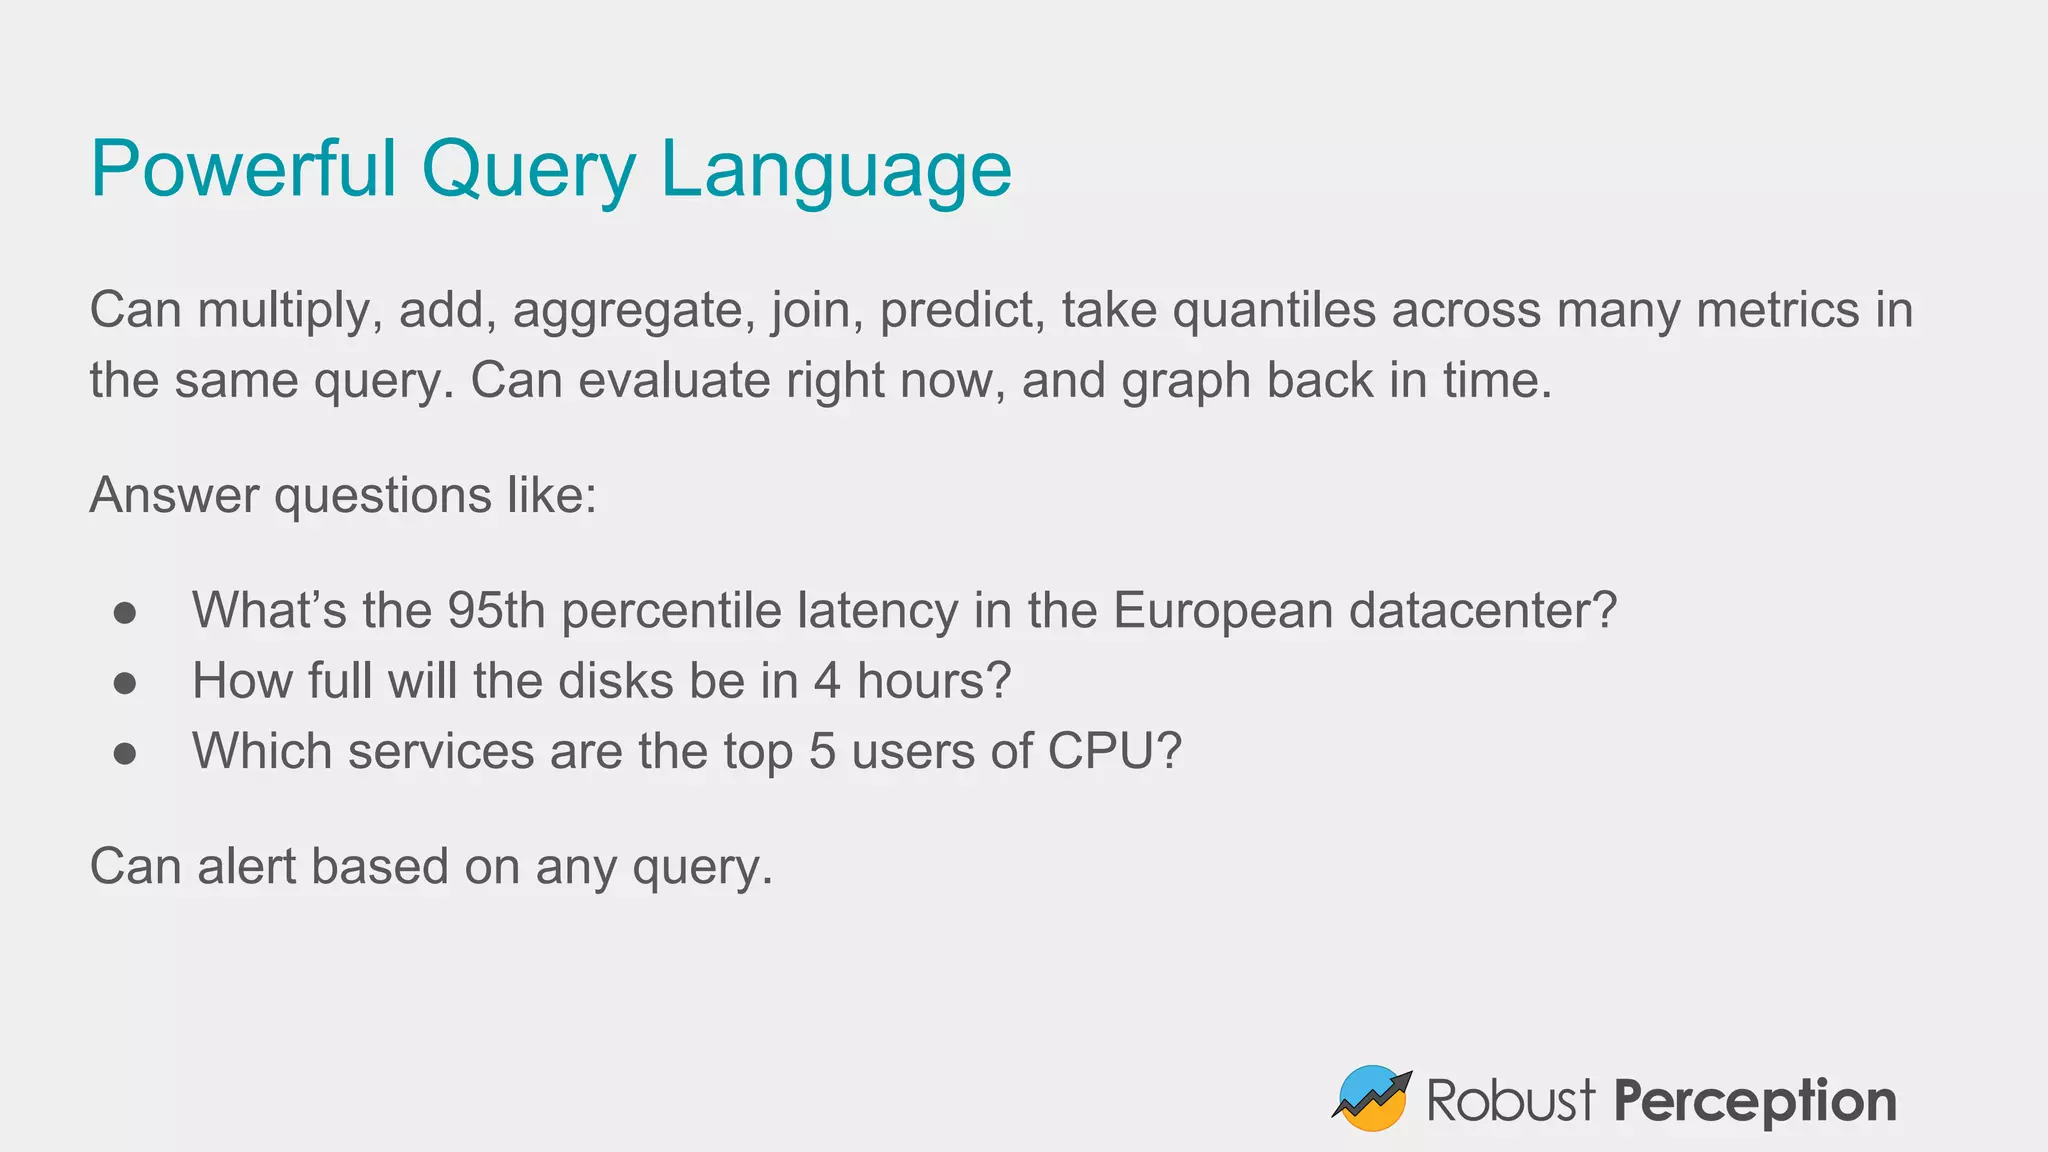
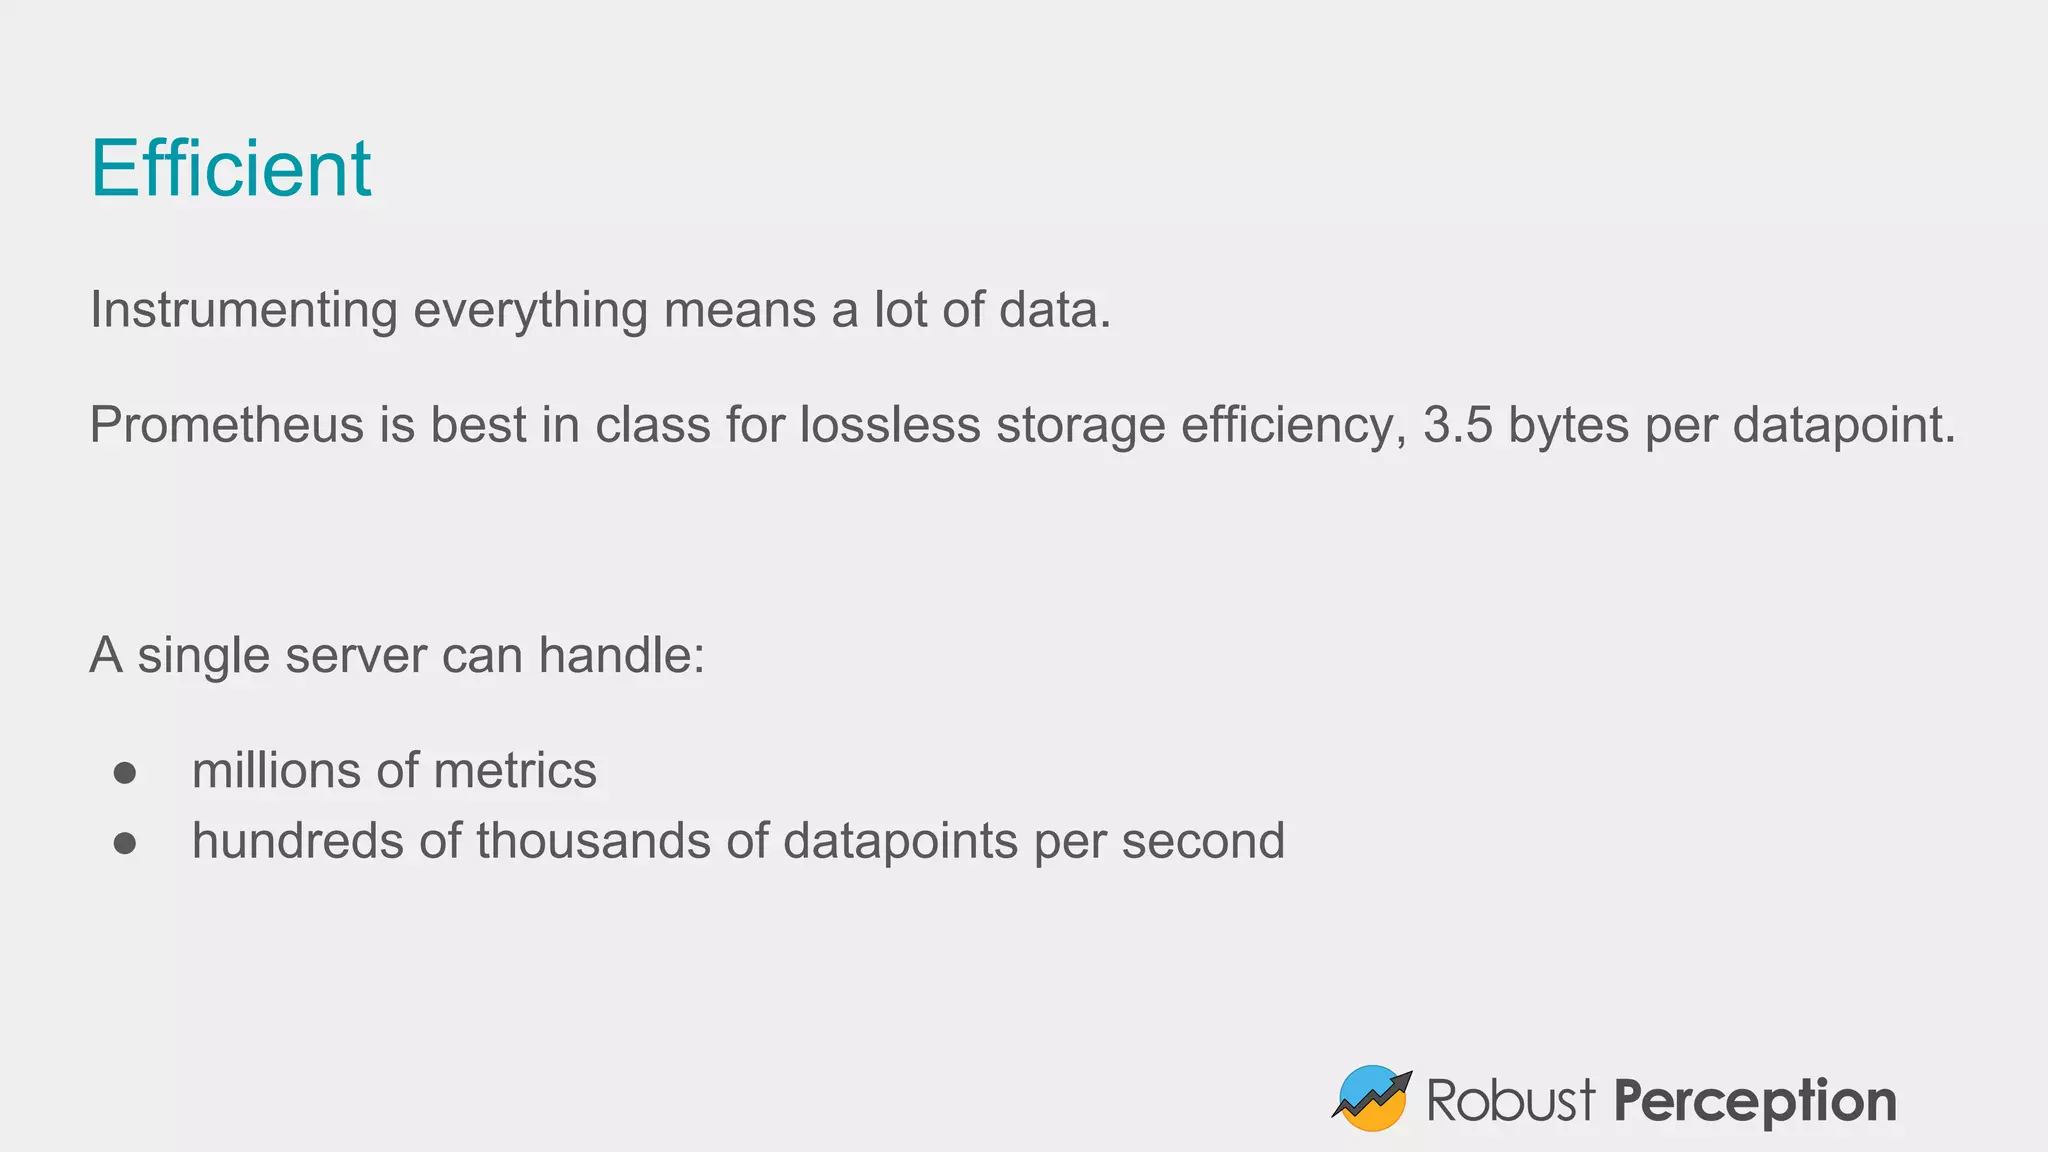
Discusses Prometheus' powerful data model, query language, reliability, and efficiency in storing data.
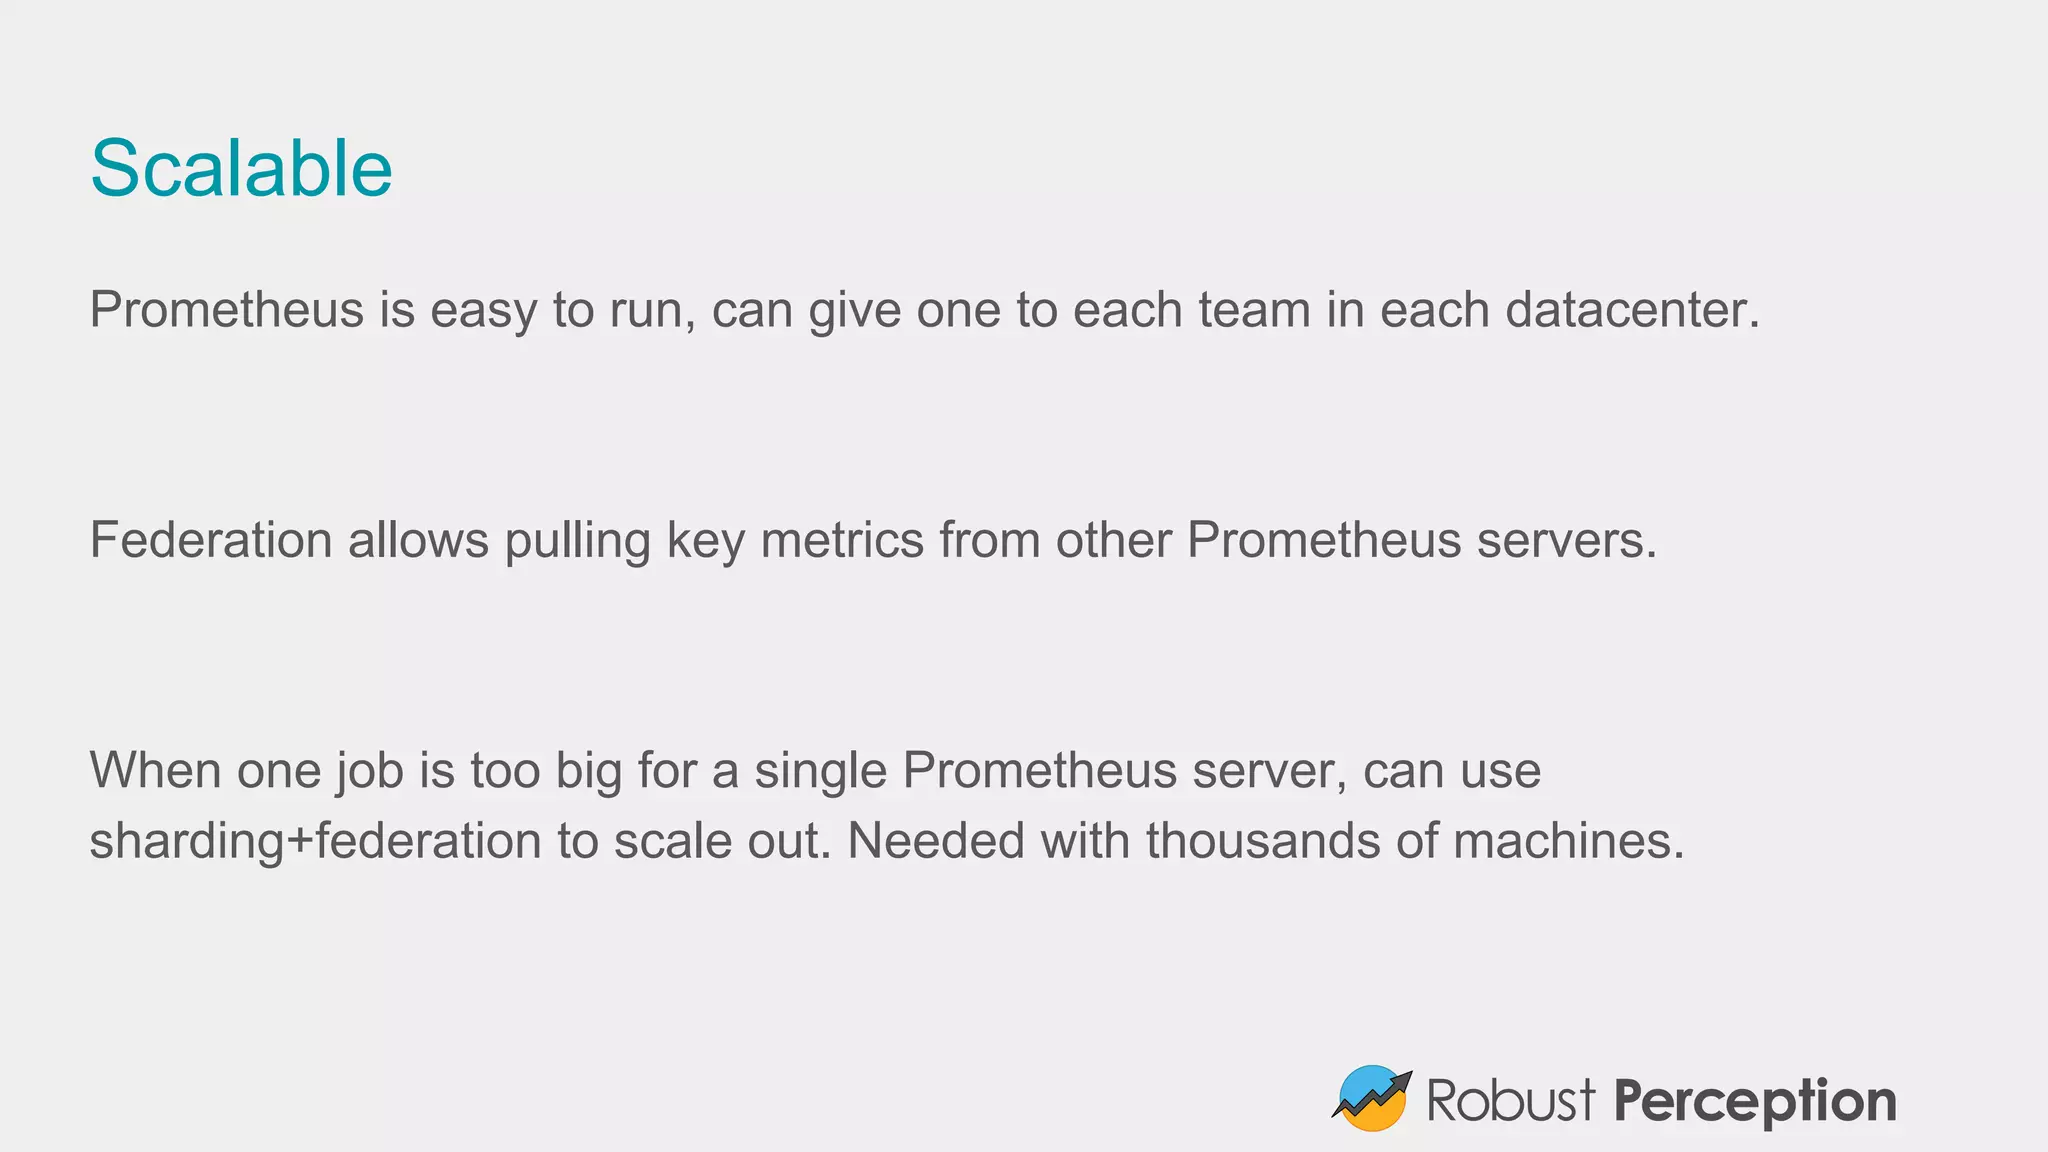
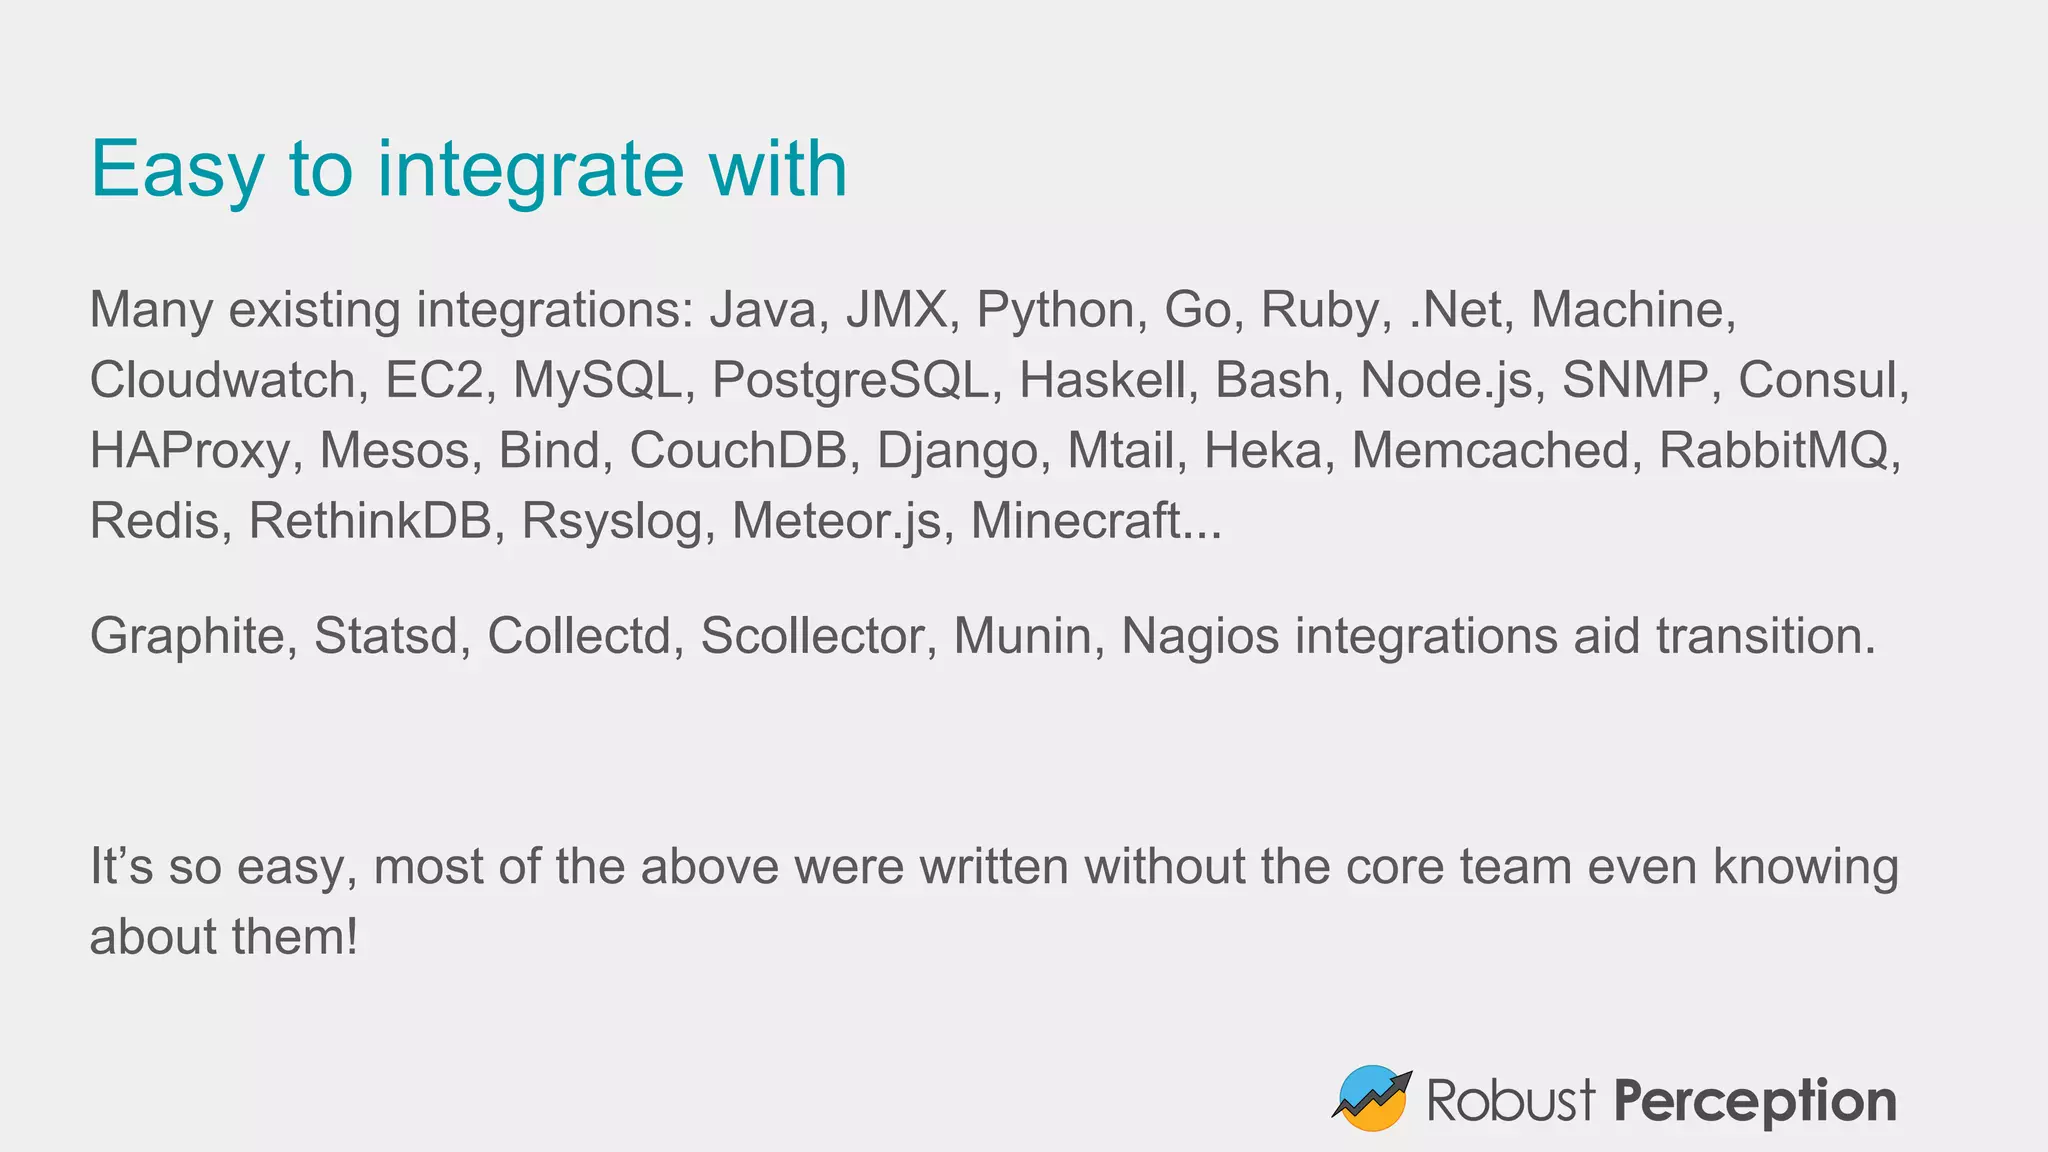
Explains Prometheus’ scalability and various integration options with existing tools and services.
Describes services offered by Robust Perception for implementing and managing Prometheus.
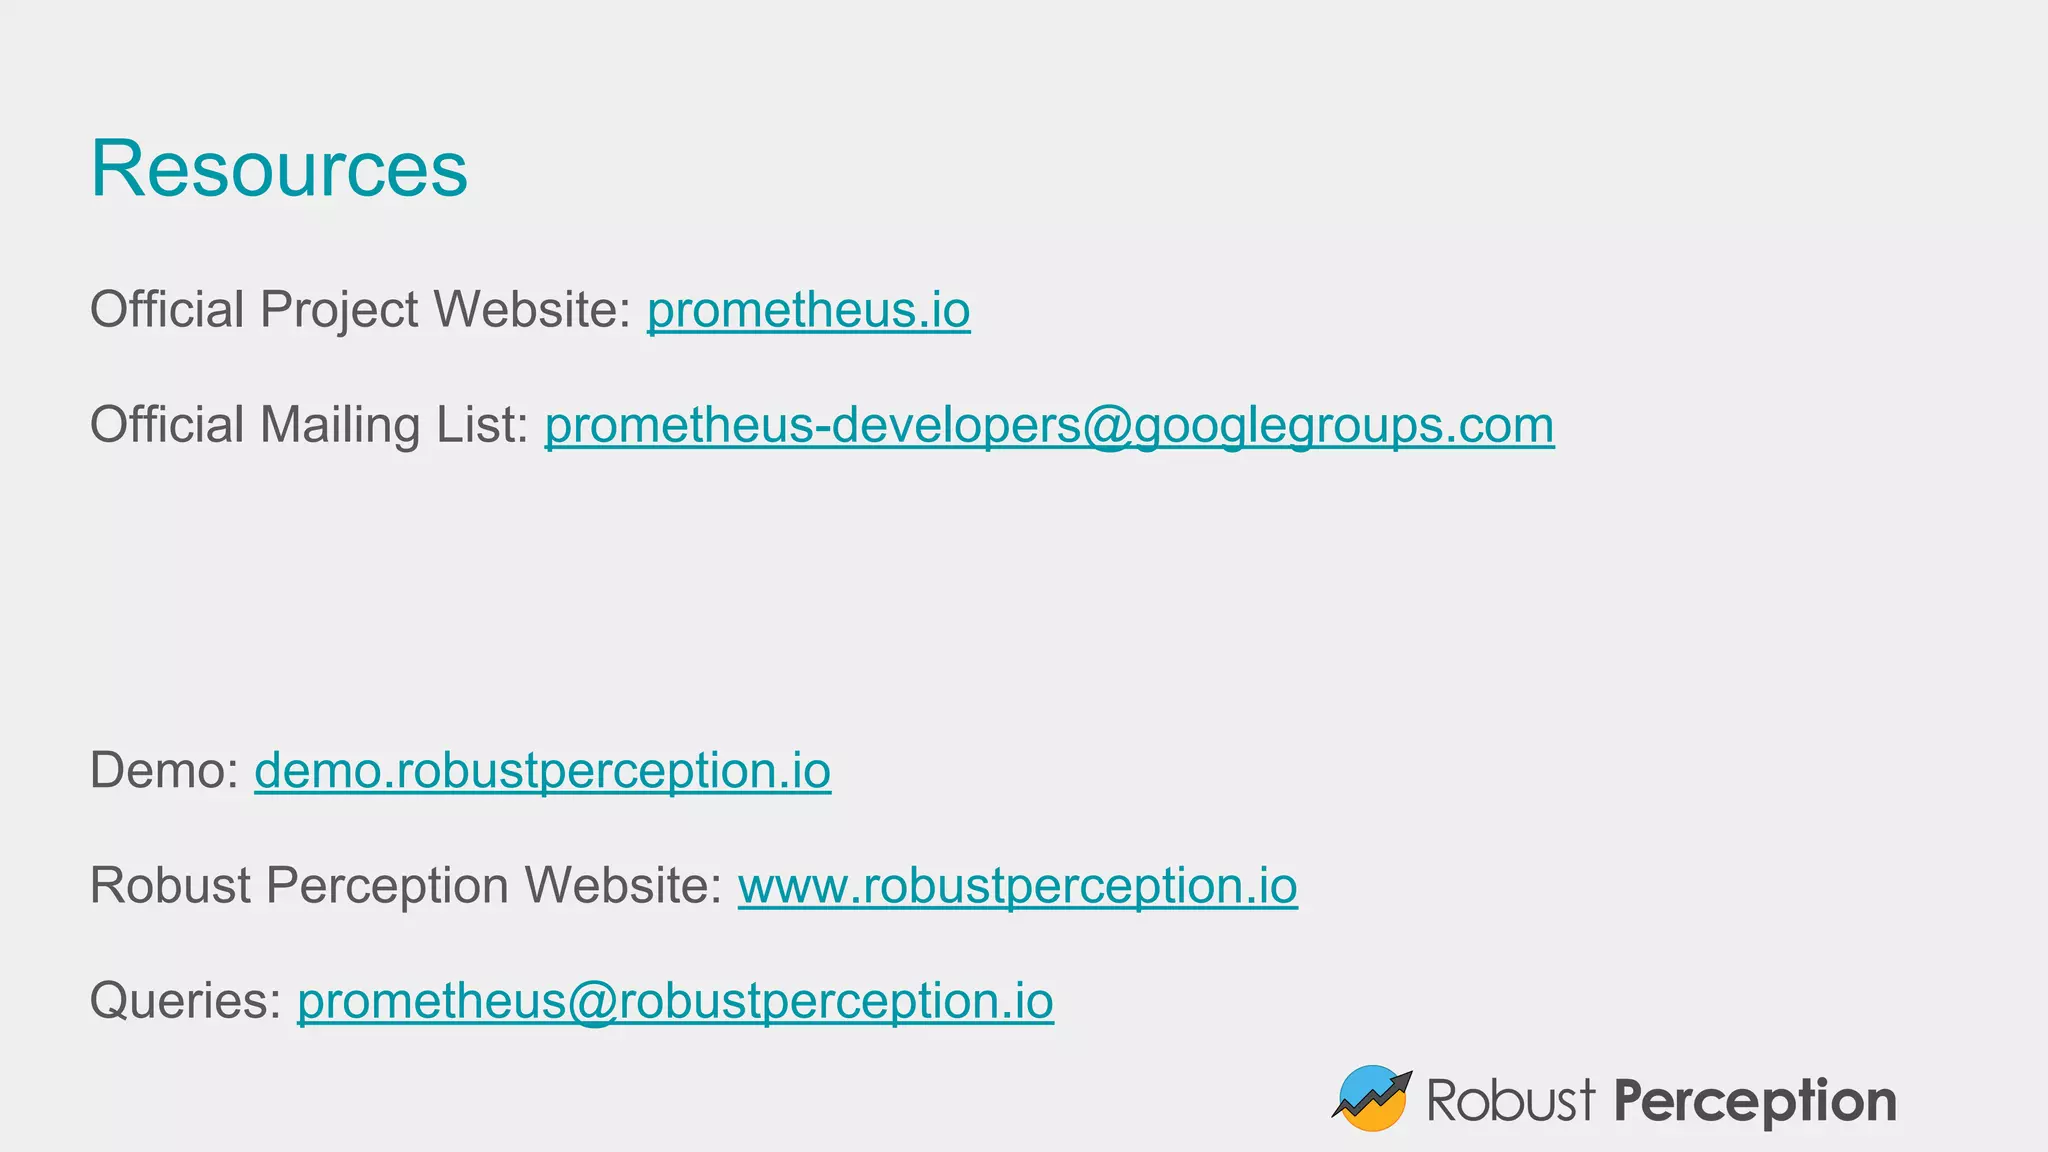
Provides resources such as official website and contact information for further support.


![Number_Guessing_Game_Dsbsbssbzboc[1].pptx](https://cdn.slidesharecdn.com/ss_thumbnails/numberguessinggamedoc1-251206215042-a076fc05-thumbnail.jpg?width=640&height=640&fit=bounds)


