Downloaded 117 times


![Page | 22
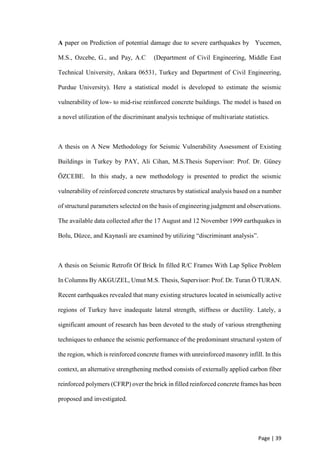
Dhaka is surrounded by the old Brahmaputra floodplain in the north and east, by the
Ganges-Meghna flood plain in the south and by the Jamuna flood plain in the west.
Dhaka is slightly elevated above the surrounding floodplains and represents mostly flat
land with minor undulations. Topographically Dhaka is of low relief with many low
depressions. According to Alam (1988), the Madhupur Tract is structurally controlled.
The Pleistocene sediments of Madhupur Tract have been affected by numerous
episodes of faulting. These faults are probably the branch out surface faults from the
low dipping western extension of Burma Arc detachment fault. Dhaka lies within 50 to
500 km distances from the seism genic faults and sits on the Burma Arc detachment
fault. Dhaka city falls in seismic zone II of the seismic zoning map of Bangladesh.
1.2.2: Building Collapse Due to Shoddy Construction in
Bangladesh
The construction industry of Bangladesh is not quite good. Here workmanship of
worker is low and also many owner and construction contractors are looking for cheap,
low quality work for more savings. Many building of the major cities like Dhaka and
Chittagong were constructed and still constructing disobeying rules of local and
government authority.
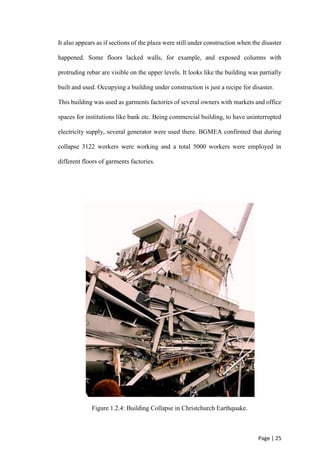
Rana plaza incident can be considered here. Officials have blamed the collapse on
shoddy construction methods. The upper four floors of the plaza, for example, were
reportedly constructed illegally without permits, and a crack was seen on the building
exterior a day before the collapse. The building was not built in compliance with the
[safety] rules and regulations. These types of accidents are a common problem in](https://image.slidesharecdn.com/f9a949f3-fdb9-4f4e-8f9d-56f1cddadc2b-150505121824-conversion-gate02/85/RETROFITTING-22-320.jpg)


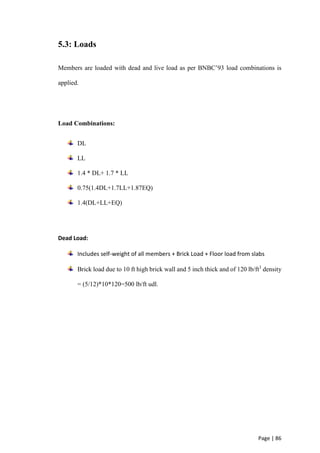
![Page | 71
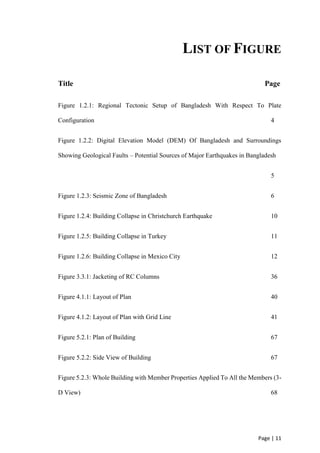
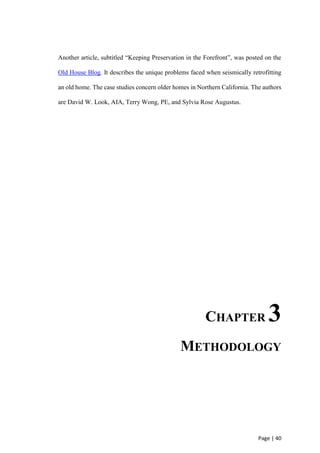
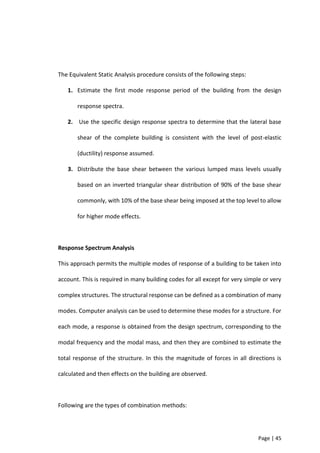
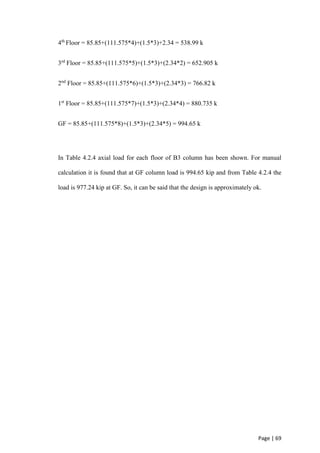
From 5th
to 8th
Floor, Pu = 425.075 k
Pu = 0.8Ø[0.85 fc
’
(Ag-Ast)+fyAst]
Or, 425.075 = 0.80*0.70*[0.85*3*(Ag-0.015Ag)+50*0.015Ag]
Or, 425.075 = 1.83Ag
Or, Ag = 232.28 in2
So, √232.28 = 15.24 inch
So, Column size = 15" * 15"
From GF to 4th
Floor, Pu = 994.65 k
Or, 994.65 = 1.83Ag
Or, Ag = 543.52 in2
So, √543.52 = 23.31 inch
So, Column size = 23" * 23"
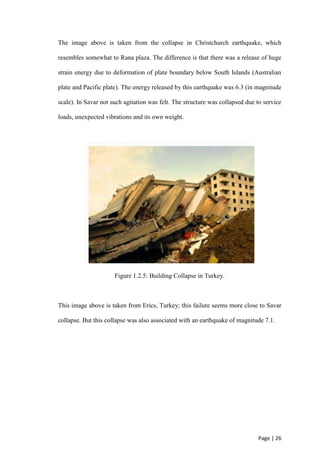
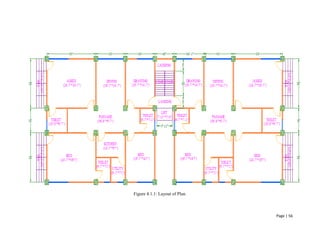
4.2.4: One Way Slab Design
There is a one way slab in this building. So, the load and moment for one way slab is
calculated separately.](https://image.slidesharecdn.com/f9a949f3-fdb9-4f4e-8f9d-56f1cddadc2b-150505121824-conversion-gate02/85/RETROFITTING-71-320.jpg)
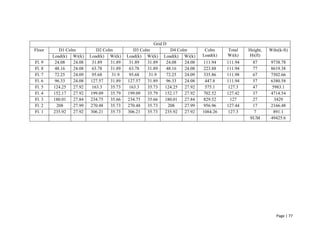
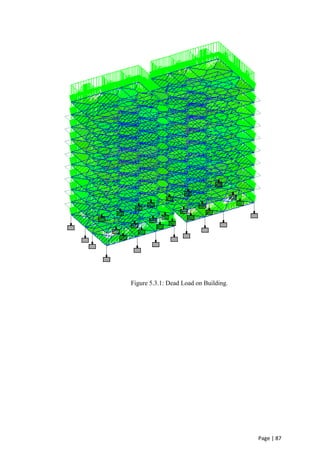
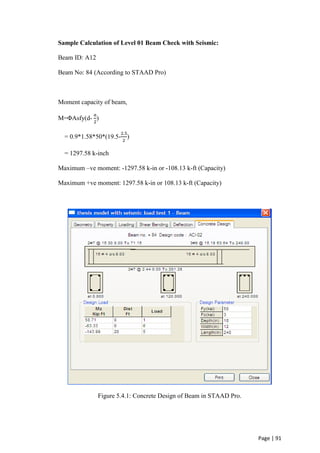
![Page | 92
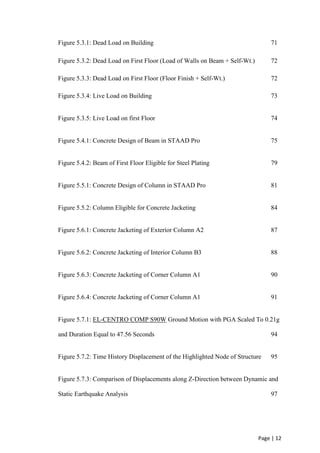
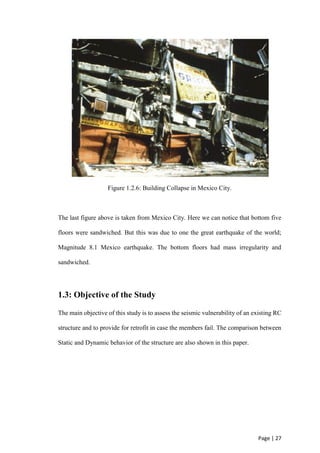
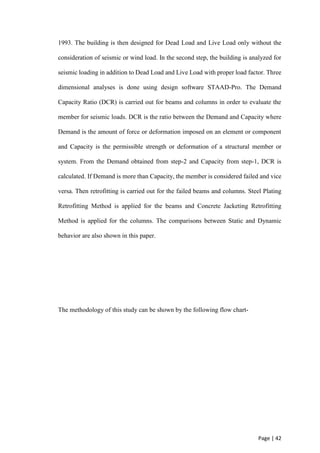
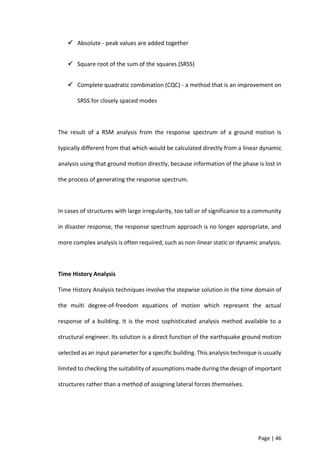
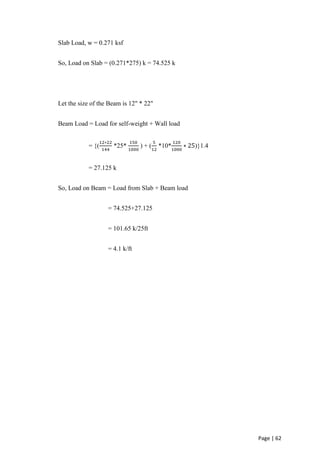
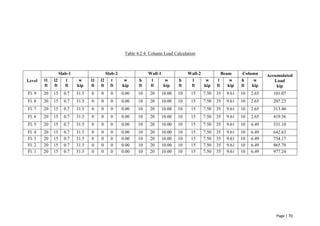
Maximum –ve moment: -143.99 k-ft (Demand)
Maximum +ve moment: 58.71 k-ft (Demand)
So, DCR= Demand / Capacity
For +ve moment DCR= 58.71/108.13 = 0.543(DCR<1) [Pass]
For -ve moment DCR= 143.99/108.13 = 1.33(DCR>1) [Fail]
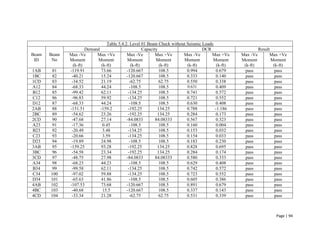
Beam checks for all beams with seismic load and without seismic load are shown in the
following Table 5.4.1 and 5.4.2 respectively.](https://image.slidesharecdn.com/f9a949f3-fdb9-4f4e-8f9d-56f1cddadc2b-150505121824-conversion-gate02/85/RETROFITTING-92-320.jpg)
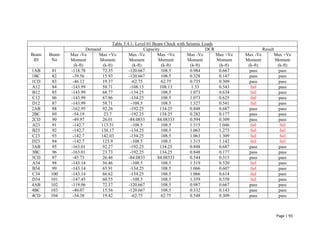
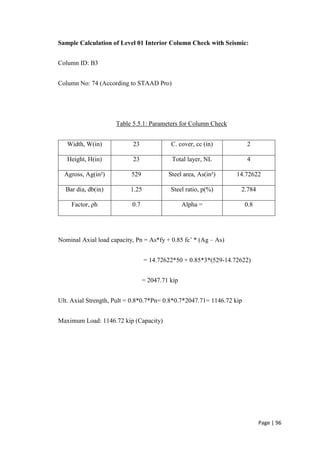
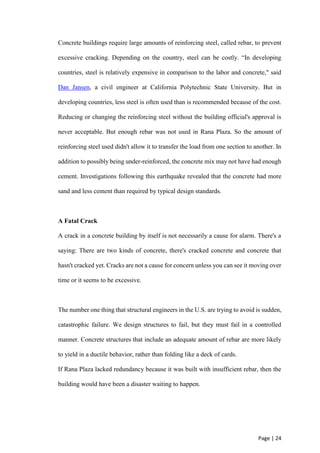
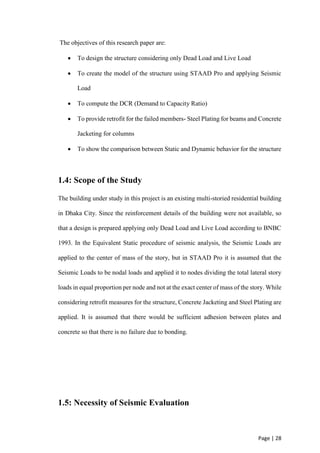
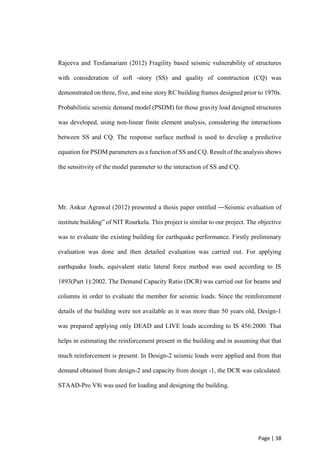
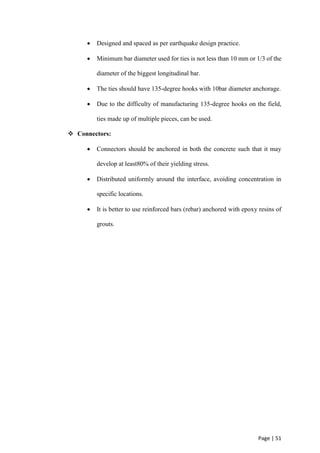
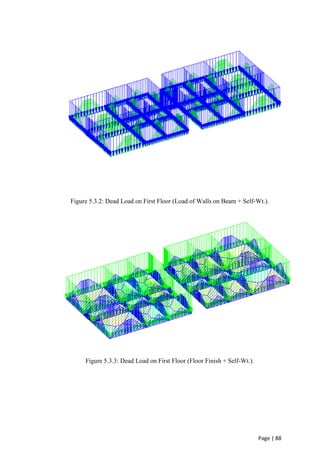
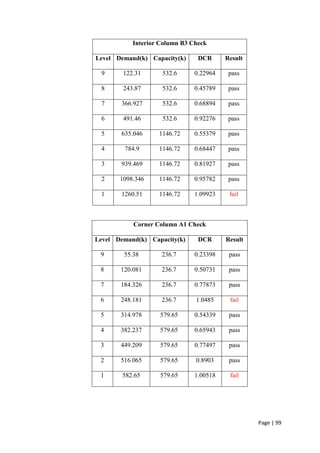
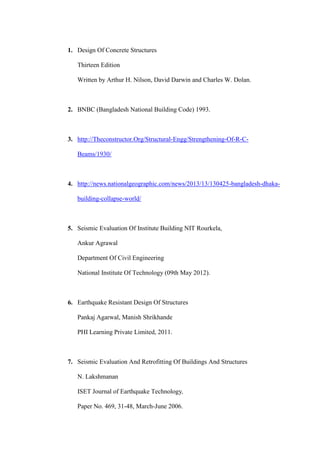
![Page | 97
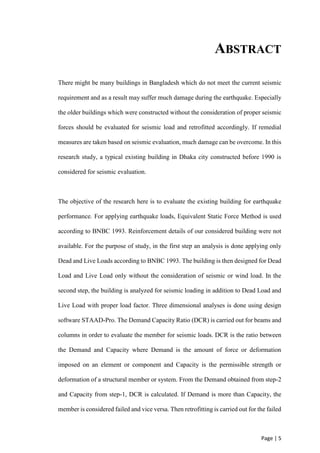
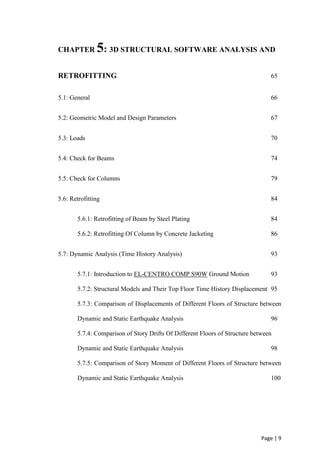
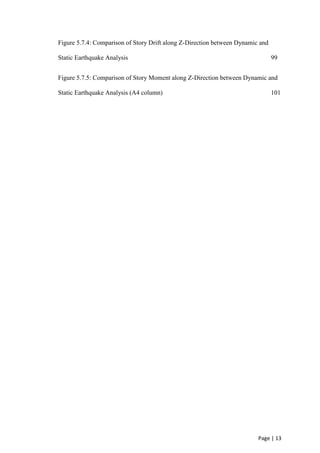
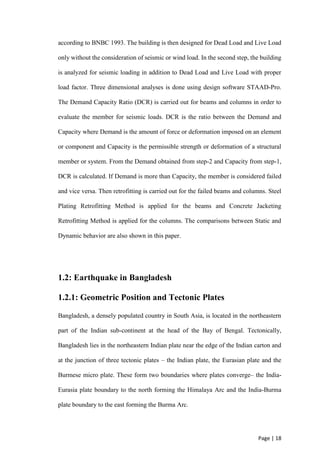
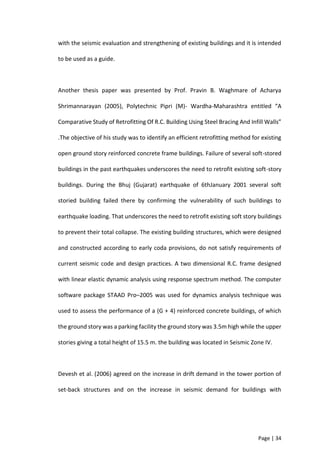
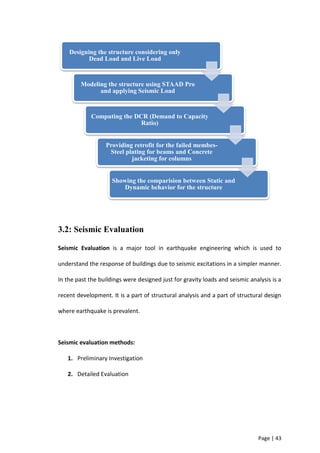
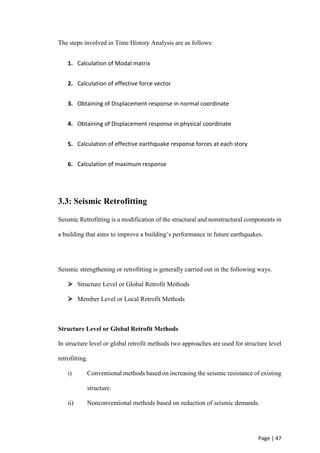
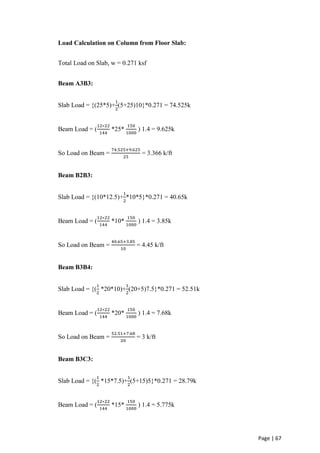
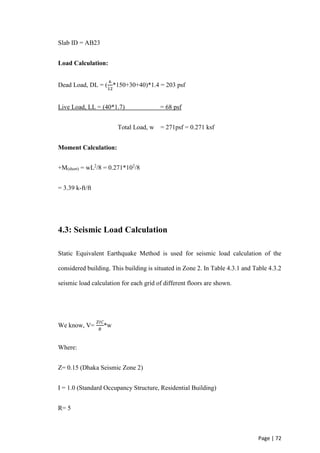
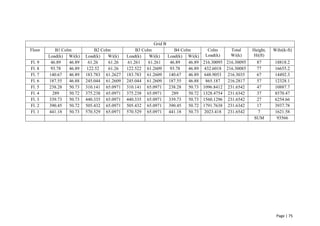
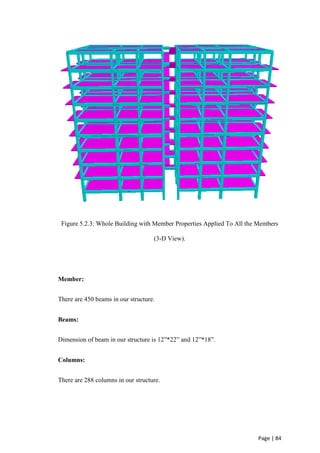
Figure 5.5.1: Concrete Design of Column in STAAD Pro.
Maximum Load: 1260.51 kip (Demand)
So, DCR= Demand / Capacity
= 1260.51/1146.72
= 1.09923(DCR>1) [Fail]
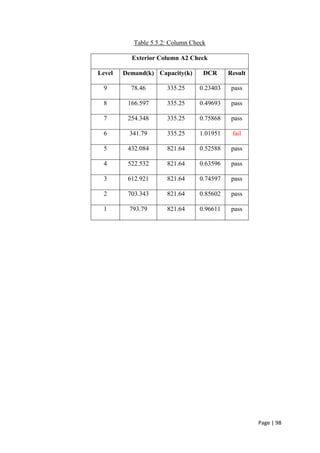
Column checks for all levels are shown in the following Table 5.5.2. Check is done for
one exterior, one interior and one corner column for each level.](https://image.slidesharecdn.com/f9a949f3-fdb9-4f4e-8f9d-56f1cddadc2b-150505121824-conversion-gate02/85/RETROFITTING-97-320.jpg)
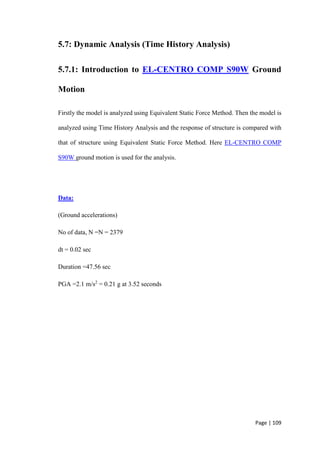
![Page | 101
Steel plate of thickness 1.5 mm i.e. 0.06 inch is added to both tension and compression
face.
So, Depth of steel plate, dp= 0.06 inch
Effective depth of beam, d = Depth of beam – Depth of cover, dc
= (18-2.5) inch
= 15.5 inch
Stress in steel plate in compression and tension, fpc= fpt= 50 ksi
Providing width of steel plate, b = Width of beam – 2(2 inch side cover)
= 12 – 2(2)
= 8 inch
We know,
Strength added by steel plating = compression side + tension side
Compression side = fpc× Apc (
𝑑𝑝
2
+d)
Tension side = fpt× Apt (
𝑑𝑝
2
+ dc)
So, Strength added by steel plating
= [fpc× Apc (
𝑑𝑝
2
+d)] + [fpt× Apt (
𝑑𝑝
2
+ dc)]
= [50 × (2×0.06×8) × (
0.06
2
+15.5)] + [50 × (2×0.06×8) × (
0.06
2
+2.5)]
=866.88 k-in =72.24 k-ft](https://image.slidesharecdn.com/f9a949f3-fdb9-4f4e-8f9d-56f1cddadc2b-150505121824-conversion-gate02/85/RETROFITTING-101-320.jpg)
![Page | 102
So, Capacity after steel plating = Original capacity + 72.24 k-ft
= (108.5+72.24) k-ft
= 180.74k-ft>Target capacity (147.45k-ft)
So, OK
5.6.2: Retrofitting Of Column by Concrete Jacketing
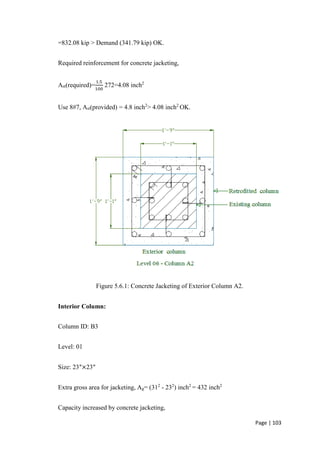
Exterior Column:
Column ID: A2
Level: 06
Size: 13″×13″
Extra gross area for jacketing, Ag= (212
- 132
) inch2
= 272 inch2
Capacity increased by concrete jacketing,
Pu= 0.8Φ [0.85fc' (Ag – Ast) + fyAst]
= 0.8×0.7 [0.85×3 (272 –
1.5
100
272) + 50×
1.5
100
272]
= 496.83 kip
Total capacity increased by concrete jacketing
= Original capacity + 496.83 kip
= (335.25 + 496.83) kip](https://image.slidesharecdn.com/f9a949f3-fdb9-4f4e-8f9d-56f1cddadc2b-150505121824-conversion-gate02/85/RETROFITTING-102-320.jpg)
![Page | 104
Pu= 0.8Φ [0.85fc' (Ag – Ast) + fyAst]
= 0.8×0.7 [0.85×3 (432 –
1.5
100
432) + 50×
1.5
100
432]
= 789.08 kip
Total capacity increased by concrete jacketing
= Original capacity + 789.08 kip
= (1146.72 + 789.08) kip
=1935.80 kip > Demand (1260.51 kip) OK.
Required reinforcement for concrete jacketing,
Ast(required)=
1.5
100
432=6.48 inch2
Use 12#7, Ast(provided) = 7.2 inch2
> 6.48 inch2
OK.
Figure 5.6.2: Concrete Jacketing of Interior Column B3.](https://image.slidesharecdn.com/f9a949f3-fdb9-4f4e-8f9d-56f1cddadc2b-150505121824-conversion-gate02/85/RETROFITTING-104-320.jpg)
![Page | 105
Corner Column:
Column ID: A1
Level: 01
Size: 17″×17″
Extra gross area for jacketing, Ag= (252
- 172
) inch2
= 336 inch2
Capacity increased by concrete jacketing,
Pu= 0.8Φ [0.85fc' (Ag – Ast) + fyAst]
= 0.8×0.7 [0.85×3 (336 –
1.5
100
336) + 50×
1.5
100
336]
= 613.73 kip
Total capacity increased by concrete jacketing,
= Original capacity + 613.73 kip
= (579.65 + 613.73) kip
=1193.38 kip > Demand (582.65 kip) OK.
Required reinforcement for concrete jacketing,
Ast(required)=
1.5
100
336=5.04 inch2
Use 12#6, Ast(provided) = 5.28 inch2
> 5.04 inch2
OK.](https://image.slidesharecdn.com/f9a949f3-fdb9-4f4e-8f9d-56f1cddadc2b-150505121824-conversion-gate02/85/RETROFITTING-105-320.jpg)
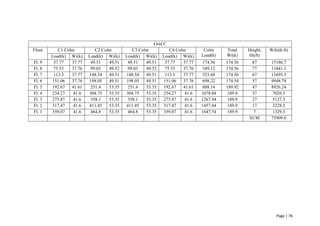
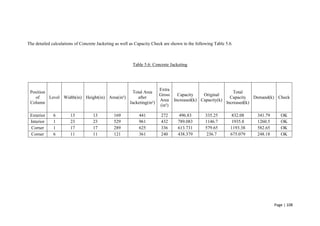
![Page | 106
Figure 5.6.3: Concrete Jacketing of Corner Column A1.
Corner Column:
Column ID: A1
Level: 06
Size: 11″×11″
Extra gross area for jacketing, Ag= (192
- 112
) inch2
= 240 inch2
Capacity increased by concrete jacketing,
Pu= 0.8Φ [0.85fc' (Ag – Ast) + fyAst]](https://image.slidesharecdn.com/f9a949f3-fdb9-4f4e-8f9d-56f1cddadc2b-150505121824-conversion-gate02/85/RETROFITTING-106-320.jpg)
![Page | 107
= 0.8×0.7 [0.85×3 (240 –
1.5
100
240) + 50×
1.5
100
240]
= 438.38 kip
Total capacity increased by concrete jacketing,
= Original capacity + 438.38 kip
= (236.7 + 438.38) kip
=675.08 kip > Demand (248.181 kip) OK.
Required reinforcement for concrete jacketing,
Ast(required)=
1.5
100
240=3.6 inch2
Use 12#5, Ast(provided) = 3.72 inch2
> 3.6 inch2
OK.
Figure 5.6.4: Concrete Jacketing of Corner Column A1.](https://image.slidesharecdn.com/f9a949f3-fdb9-4f4e-8f9d-56f1cddadc2b-150505121824-conversion-gate02/85/RETROFITTING-107-320.jpg)
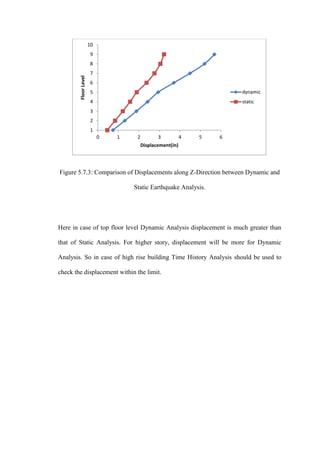
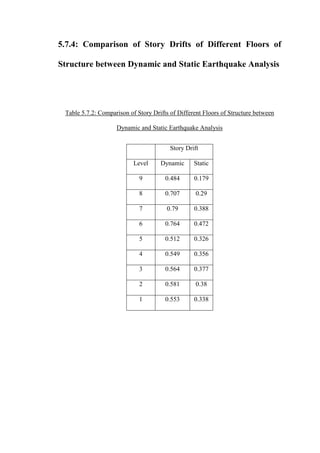
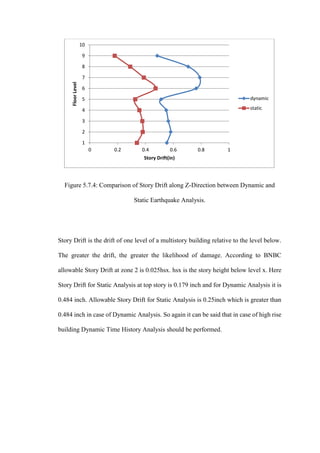
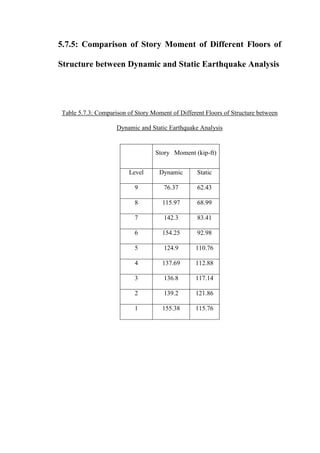


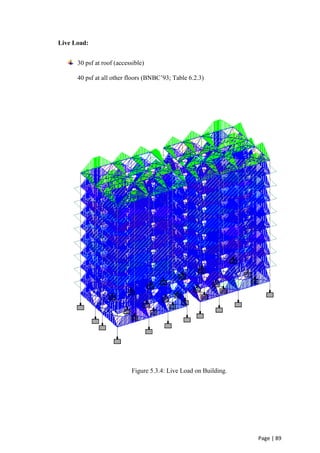
This document presents a thesis on retrofitting existing buildings in Bangladesh to improve seismic performance. It begins with an introduction to earthquakes and Bangladesh's seismic environment due to its location between tectonic plates. The objective is to evaluate an existing building using static analysis and design software to determine demand-capacity ratios of members under seismic loads. Beams exceeding capacity will be retrofitted with steel plating and columns with concrete jacketing. Dynamic time history analysis will also be performed and results compared to static analysis. The methodology, building model, load calculations, software analysis, retrofitting designs, and planned comparisons are described over several chapters.


