Download to read offline
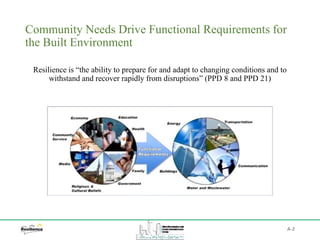
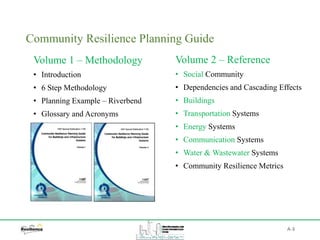
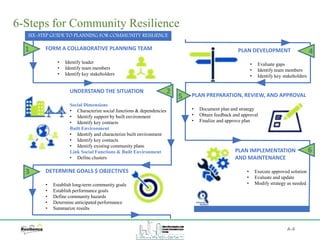
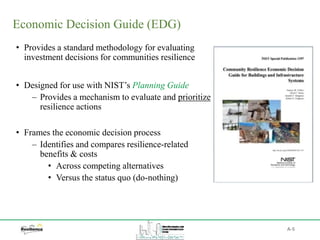
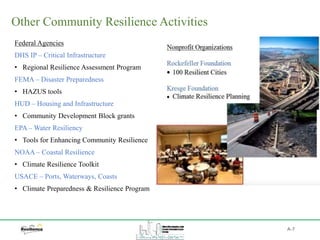
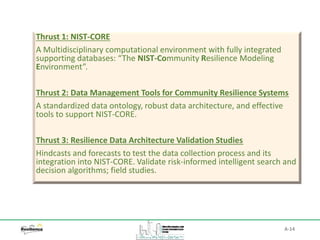


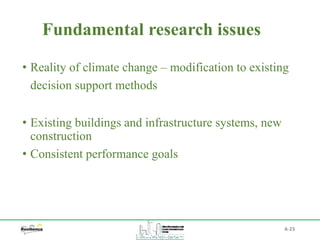
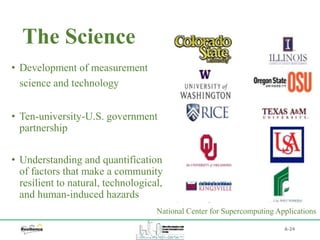
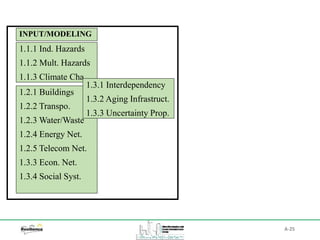
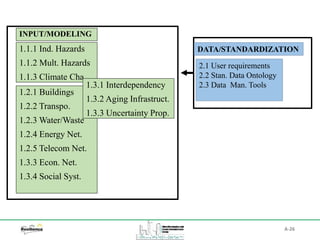
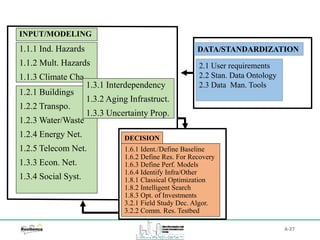
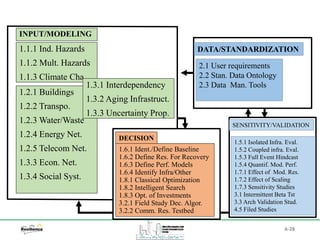
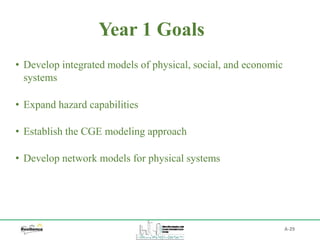
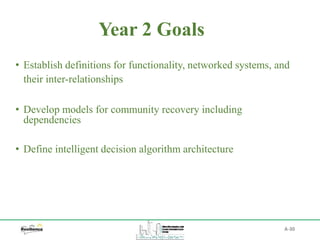


The document discusses community resilience and outlines a methodology for planning community resilience. It describes a 6-step process for forming a collaborative planning team, understanding community needs and systems, determining goals and objectives, developing and implementing a resilience plan. It also summarizes tools and activities from various organizations to support community resilience planning and highlights research being conducted by NIST.


