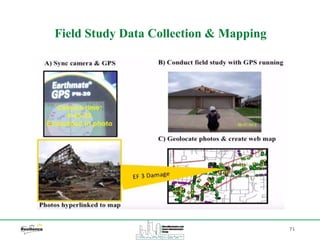
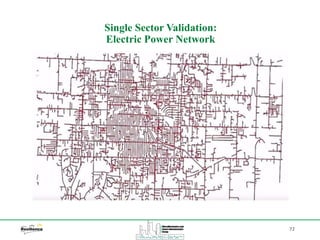
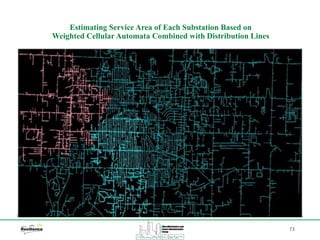
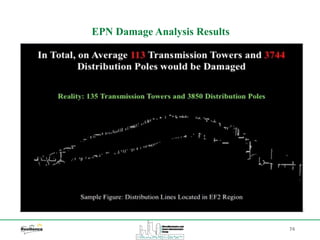
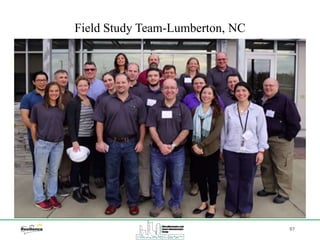
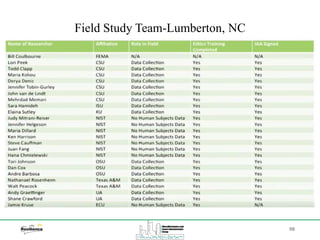
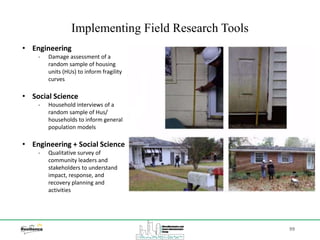
Download to read offline


![76
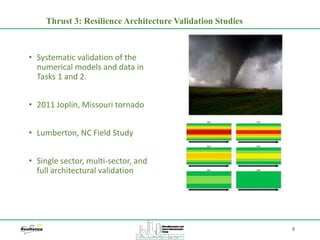
Building Taxonomy for Tornado Hazard
Derivation Resources:
a) Building Attributes Affecting Structural Response
[GEM Building Taxonomy (2013)]
a) Building Attributes Affecting Wind Load Intensity
[ASCE7-10 chapters 26 to 31]](https://image.slidesharecdn.com/communityresiliencemodelingfieldstudiesandimplementation-190320100357/85/Community-resilience-modeling-field-studies-and-implementation-76-320.jpg)
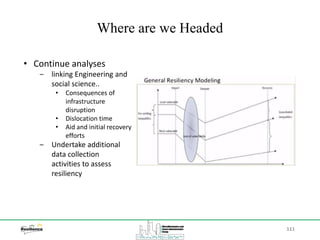

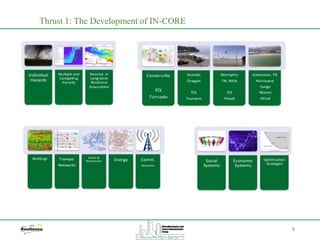
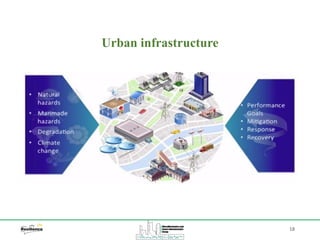
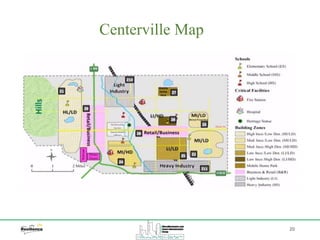
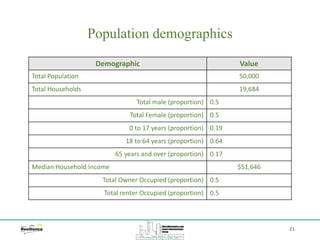
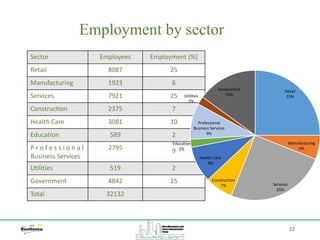
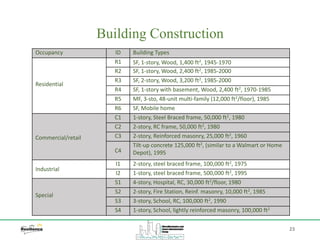
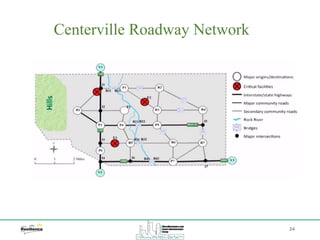
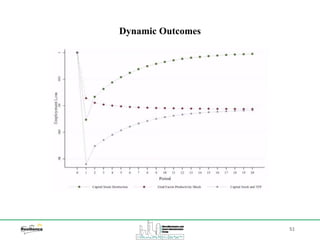
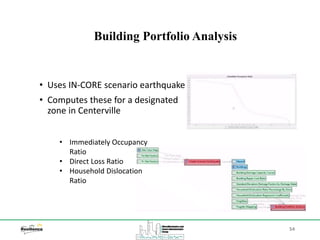
The document discusses modeling community resilience through the development of a virtual test community called Centerville. It describes creating standardized models of Centerville's physical infrastructure like buildings, roads, and electrical grid. It also models Centerville's social and economic attributes like demographics, employment, and critical facilities. The goal is to integrate these physical and social models to allow testing how disruptions impact infrastructure interdependencies and community resilience metrics. Researchers from different disciplines can collaborate using this testbed to develop and validate modeling approaches before applying them to real communities.


![City_politics_and_the_environment_g2[1].pptx](https://cdn.slidesharecdn.com/ss_thumbnails/citypoliticsandtheenvironmentg21-230314002358-a3126444-thumbnail.jpg?width=640&height=640&fit=bounds)


