SlideShare a Scribd company logo
1 of 15
Non linear regression analysis: 
In statistics , nonlinear regression is a form of regression 
analysis in which observational data are modeled by a 
function which is a nonlinear combination of the model 
parameters are depends on one or more independent 
variables . The method of least square is used for 
estimating the parameters. Minimizing this equation 
푆푆퐷 훽 = Σ 푦 − 푓 푥; 훽 
2 
We estimate 훽.
R code for nonlinear curve fitting 
To perform the nonlinear regression analysis in R then 
we use nls function. 
Example: 
t<-seq (0,10,0.1) 
y<-rnorm(101,5* exp (-t/5),0.2) 
plot(t, y, type="p", pch =16,col="red")
Plot : 
From the diagram we see that the function is not linear.
Now we perform the nonlinear analysis 
nls(y~A*exp (-alpha*t),start=c(A=2,alpha=0.05)) 
summary(nls(y~A*exp(alpha*t),start=c(A=2,alpha=0.05))) 
#Using summary we can test the hypothesis whether the 
parameters are zero or not. 
Outcome: 
A alpha 
5.0664 0.2025 
residual sum-of-squares: 4.436 
Number of iterations to convergence: 5
Estimate Std. Error t value Pr(>|t|) 
A 5.066399 0.062600 80.93 <2e-16 *** 
alpha 0.202503 0.004034 50.20 <2e-16 *** 
Significance codes: 0 ‘***’ 0.001 ‘**’ 0.01 ‘*’ 0.05 ‘.’ 0.1 ‘ ’ 1 
Residual standard error: 0.2117 on 99 degrees of freedom 
From the result we see that the p value too small(<0.05) 
. so we reject the null hypothesis.
Gompertz function…. 
Gompertz curve or Gompertz function is a type of 
mathematical model for a time series. In the Gompartz 
curve growth is slowest at the start and end of a time 
period. The Gompertz curve has a sigmoidal shape. The 
equation is 
푦 = 푎푒−푏푒−푔푥
Gompertz curve:
Fitting Gompertz Curve: 
Finding the starting value: 
library(ISwR) 
juul 
attach(subset(juul2,age<20 & age>5 & sex==1)) 
data.1<-subset(juul2,age<20 & age>5 & sex==1) 
attach(data.1) 
Now the Gompertz model is a푒−푏푒−푔푥 
,the curve has a sigmoidal 
shape , approaching a constant level a as x increases and zero for 
large negative x. To obtain b and g parameter determined the 
location and sharpness. To obtain starting values for a non-linear 
fit one approach is to notice that the relation between y and x is 
something like log-log linear 
log(log(α)-log(y))=log(b)-gx
From the figure (juul2), we get the maximum value of height i.e. a=200. With 
this guess 
we can make a plot that should so an approximate linear relationship. 
plot(log(log(200)-log(height))~age, col="blue", pch=16) 
fit<-lm(log(log(200)-log(height))~age) 
fit 
From this we get the value of 
log(b)=0.42 and age=-0.1553 
Now we fit a nonlinear regression analysis 
nls(height~ α * exp (b * exp (-g*age)),start=c(α =200,b= exp (0.4293),g =0.1553)) 
plot( age, height) 
fit<-nls( height~ α*exp(- b *exp(- g *age)),start=c(a=200, b=exp(0.4293),g =0.1553)) 
Summary(fit) 
fit.frame<-seq ( 5,20,0.001) 
lines(fit.frame, predict(fit, newdata =data.frame(age=fit.frame)),lwd=2)
Outcomes: 
After fitting the nls function we get the values of 
a b g 
242.80628 1.17598 0.07903 
then we test the hypothesis that the parameters are zero or not. 
Parameters: 
Estimate Std. Error t value P(>|t|) 
a 2.428e+02 1.157e+01 20.978 <2e-16 *** 
b 1.176e+00 1.892e-02 62.149 <2e-16 *** 
g 7.903e-02 8.569e-03 9.222 <2e-16 *** 
--- 
Signif. codes: 0 ‘***’ 0.001 ‘**’ 0.01 ‘*’ 0.05 ‘.’ 0.1 ‘ ’ 1 
From the result we see that the p values of parameters are too 
small(<0.05). so we reject our null hypothesis at 5% level of 
significant.
Plot the function with respect the sequence.
Self starting models: 
Doesn't need to input initial values. 
This type of functions are starting with SS in R 
Ssgompertz. 
library(ISwR) 
age.height<-subset(juul2,age<20 & age>5 & sex==1) 
attach(age.height) 
nls(height~ SSgompertz(age,α,b, g )) 
α b g 
242.807 1.176 0.924 
residual sum-of-squares: 23151
Draw back of self starting method: 
One minor drawback of self starting models is that we can 
not just transform them if you want to see if the model fits 
better on, e.g. a log-transformation 
nls(log(height)~log(SSgompertz(age,α,b,g))) 
So we can not use any transformation in self starting model.
Thank you……

More Related Content

What's hot

Direct Methods to Solve Linear Equations Systems
Direct Methods to Solve Linear Equations SystemsDirect Methods to Solve Linear Equations Systems
Direct Methods to Solve Linear Equations Systems
Lizeth Paola Barrero
 
Regression analysis
Regression analysisRegression analysis
Regression analysis
Ravi shankar
 
Simple lin regress_inference
Simple lin regress_inferenceSimple lin regress_inference
Simple lin regress_inference
Kemal İnciroğlu
 
Discrete probability distribution (complete)
Discrete probability distribution (complete)Discrete probability distribution (complete)
Discrete probability distribution (complete)
ISYousafzai
 

What's hot (20)

Direct Methods to Solve Linear Equations Systems
Direct Methods to Solve Linear Equations SystemsDirect Methods to Solve Linear Equations Systems
Direct Methods to Solve Linear Equations Systems
 
1st order differential equations
1st order differential equations1st order differential equations
1st order differential equations
 
Bernoullis Random Variables And Binomial Distribution
Bernoullis Random Variables And Binomial DistributionBernoullis Random Variables And Binomial Distribution
Bernoullis Random Variables And Binomial Distribution
 
Regression analysis
Regression analysisRegression analysis
Regression analysis
 
Methods of point estimation
Methods of point estimationMethods of point estimation
Methods of point estimation
 
Introduction to Generalized Linear Models
Introduction to Generalized Linear ModelsIntroduction to Generalized Linear Models
Introduction to Generalized Linear Models
 
Discrete and Continuous Random Variables
Discrete and Continuous Random VariablesDiscrete and Continuous Random Variables
Discrete and Continuous Random Variables
 
Bernoulli distribution
Bernoulli distributionBernoulli distribution
Bernoulli distribution
 
METHOD OF JACOBI
METHOD OF JACOBIMETHOD OF JACOBI
METHOD OF JACOBI
 
Runge-Kutta methods with examples
Runge-Kutta methods with examplesRunge-Kutta methods with examples
Runge-Kutta methods with examples
 
Least Squares Regression Method | Edureka
Least Squares Regression Method | EdurekaLeast Squares Regression Method | Edureka
Least Squares Regression Method | Edureka
 
Non Linear Equation
Non Linear EquationNon Linear Equation
Non Linear Equation
 
Linear regression
Linear regressionLinear regression
Linear regression
 
Simple lin regress_inference
Simple lin regress_inferenceSimple lin regress_inference
Simple lin regress_inference
 
Discrete probability distribution (complete)
Discrete probability distribution (complete)Discrete probability distribution (complete)
Discrete probability distribution (complete)
 
introduction to differential equations
introduction to differential equationsintroduction to differential equations
introduction to differential equations
 
Regression Analysis
Regression AnalysisRegression Analysis
Regression Analysis
 
Normal Distribution
Normal DistributionNormal Distribution
Normal Distribution
 
Differential calculus
Differential calculusDifferential calculus
Differential calculus
 
Introduction to Statistics and Probability
Introduction to Statistics and ProbabilityIntroduction to Statistics and Probability
Introduction to Statistics and Probability
 

Viewers also liked (8)

Es272 ch1
Es272 ch1Es272 ch1
Es272 ch1
 
Es272 ch5a
Es272 ch5aEs272 ch5a
Es272 ch5a
 
case study of curve fitting
case study of curve fittingcase study of curve fitting
case study of curve fitting
 
Curve fitting - Lecture Notes
Curve fitting - Lecture NotesCurve fitting - Lecture Notes
Curve fitting - Lecture Notes
 
phd thesis presentation
phd thesis presentationphd thesis presentation
phd thesis presentation
 
Mathematical modeling
Mathematical modelingMathematical modeling
Mathematical modeling
 
Chapter 14 Part I
Chapter 14 Part IChapter 14 Part I
Chapter 14 Part I
 
metode numerik kurva fitting dan regresi
metode numerik kurva fitting dan regresimetode numerik kurva fitting dan regresi
metode numerik kurva fitting dan regresi
 

Similar to Non linear curve fitting

INTRODUCTION TO MATLAB presentation.pptx
INTRODUCTION TO MATLAB presentation.pptxINTRODUCTION TO MATLAB presentation.pptx
INTRODUCTION TO MATLAB presentation.pptx
Devaraj Chilakala
 
Modelling using differnt metods in matlab2 (2) (2) (2) (4) (1) (1).pptx
Modelling using differnt metods in matlab2 (2) (2) (2) (4) (1) (1).pptxModelling using differnt metods in matlab2 (2) (2) (2) (4) (1) (1).pptx
Modelling using differnt metods in matlab2 (2) (2) (2) (4) (1) (1).pptx
KadiriIbrahim2
 
Lec03 04-time complexity
Lec03 04-time complexityLec03 04-time complexity
Lec03 04-time complexity
Abbas Ali
 
Wk 6 part 2 non linearites and non linearization april 05
Wk 6 part 2 non linearites and non linearization april 05Wk 6 part 2 non linearites and non linearization april 05
Wk 6 part 2 non linearites and non linearization april 05
Charlton Inao
 

Similar to Non linear curve fitting (20)

CHAPTER 7.pdfdjdjdjdjdjdjdjsjsjddhhdudsko
CHAPTER 7.pdfdjdjdjdjdjdjdjsjsjddhhdudskoCHAPTER 7.pdfdjdjdjdjdjdjdjsjsjddhhdudsko
CHAPTER 7.pdfdjdjdjdjdjdjdjsjsjddhhdudsko
 
Scientific Computing II Numerical Tools & Algorithms - CEI40 - AGA
Scientific Computing II Numerical Tools & Algorithms - CEI40 - AGAScientific Computing II Numerical Tools & Algorithms - CEI40 - AGA
Scientific Computing II Numerical Tools & Algorithms - CEI40 - AGA
 
Lec_2.pdf
Lec_2.pdfLec_2.pdf
Lec_2.pdf
 
BALLANDBEAM_GROUP7.pptx
BALLANDBEAM_GROUP7.pptxBALLANDBEAM_GROUP7.pptx
BALLANDBEAM_GROUP7.pptx
 
Introduction to Artificial Neural Networks
Introduction to Artificial Neural NetworksIntroduction to Artificial Neural Networks
Introduction to Artificial Neural Networks
 
Elliptic Curve Cryptography
Elliptic Curve CryptographyElliptic Curve Cryptography
Elliptic Curve Cryptography
 
CRYPTO 2.pptx
CRYPTO 2.pptxCRYPTO 2.pptx
CRYPTO 2.pptx
 
lecture6.ppt
lecture6.pptlecture6.ppt
lecture6.ppt
 
algorithm Unit 3
algorithm Unit 3algorithm Unit 3
algorithm Unit 3
 
Asymptotic notation
Asymptotic notationAsymptotic notation
Asymptotic notation
 
Regression
RegressionRegression
Regression
 
INTRODUCTION TO MATLAB presentation.pptx
INTRODUCTION TO MATLAB presentation.pptxINTRODUCTION TO MATLAB presentation.pptx
INTRODUCTION TO MATLAB presentation.pptx
 
Modelling using differnt metods in matlab2 (2) (2) (2) (4) (1) (1).pptx
Modelling using differnt metods in matlab2 (2) (2) (2) (4) (1) (1).pptxModelling using differnt metods in matlab2 (2) (2) (2) (4) (1) (1).pptx
Modelling using differnt metods in matlab2 (2) (2) (2) (4) (1) (1).pptx
 
Informe laboratorio n°1
Informe laboratorio n°1Informe laboratorio n°1
Informe laboratorio n°1
 
Lec03 04-time complexity
Lec03 04-time complexityLec03 04-time complexity
Lec03 04-time complexity
 
Wk 6 part 2 non linearites and non linearization april 05
Wk 6 part 2 non linearites and non linearization april 05Wk 6 part 2 non linearites and non linearization april 05
Wk 6 part 2 non linearites and non linearization april 05
 
Gauss jordan and Guass elimination method
Gauss jordan and Guass elimination methodGauss jordan and Guass elimination method
Gauss jordan and Guass elimination method
 
Asymtotic Appoach.ppt
Asymtotic Appoach.pptAsymtotic Appoach.ppt
Asymtotic Appoach.ppt
 
Mqm em
Mqm emMqm em
Mqm em
 
02-asymp.ppt
02-asymp.ppt02-asymp.ppt
02-asymp.ppt
 

Recently uploaded

Pests of mustard_Identification_Management_Dr.UPR.pdf
Pests of mustard_Identification_Management_Dr.UPR.pdfPests of mustard_Identification_Management_Dr.UPR.pdf
Pests of mustard_Identification_Management_Dr.UPR.pdf
PirithiRaju
 
Pests of cotton_Borer_Pests_Binomics_Dr.UPR.pdf
Pests of cotton_Borer_Pests_Binomics_Dr.UPR.pdfPests of cotton_Borer_Pests_Binomics_Dr.UPR.pdf
Pests of cotton_Borer_Pests_Binomics_Dr.UPR.pdf
PirithiRaju
 
Pests of cotton_Sucking_Pests_Dr.UPR.pdf
Pests of cotton_Sucking_Pests_Dr.UPR.pdfPests of cotton_Sucking_Pests_Dr.UPR.pdf
Pests of cotton_Sucking_Pests_Dr.UPR.pdf
PirithiRaju
 
Formation of low mass protostars and their circumstellar disks
Formation of low mass protostars and their circumstellar disksFormation of low mass protostars and their circumstellar disks
Formation of low mass protostars and their circumstellar disks
Sérgio Sacani
 
Chemical Tests; flame test, positive and negative ions test Edexcel Internati...
Chemical Tests; flame test, positive and negative ions test Edexcel Internati...Chemical Tests; flame test, positive and negative ions test Edexcel Internati...
Chemical Tests; flame test, positive and negative ions test Edexcel Internati...
ssuser79fe74
 
Labelling Requirements and Label Claims for Dietary Supplements and Recommend...
Labelling Requirements and Label Claims for Dietary Supplements and Recommend...Labelling Requirements and Label Claims for Dietary Supplements and Recommend...
Labelling Requirements and Label Claims for Dietary Supplements and Recommend...
Lokesh Kothari
 
Seismic Method Estimate velocity from seismic data.pptx
Seismic Method Estimate velocity from seismic  data.pptxSeismic Method Estimate velocity from seismic  data.pptx
Seismic Method Estimate velocity from seismic data.pptx
AlMamun560346
 
SCIENCE-4-QUARTER4-WEEK-4-PPT-1 (1).pptx
SCIENCE-4-QUARTER4-WEEK-4-PPT-1 (1).pptxSCIENCE-4-QUARTER4-WEEK-4-PPT-1 (1).pptx
SCIENCE-4-QUARTER4-WEEK-4-PPT-1 (1).pptx
RizalinePalanog2
 
Bacterial Identification and Classifications
Bacterial Identification and ClassificationsBacterial Identification and Classifications
Bacterial Identification and Classifications
Areesha Ahmad
 

Recently uploaded (20)

Pests of mustard_Identification_Management_Dr.UPR.pdf
Pests of mustard_Identification_Management_Dr.UPR.pdfPests of mustard_Identification_Management_Dr.UPR.pdf
Pests of mustard_Identification_Management_Dr.UPR.pdf
 
Pests of cotton_Borer_Pests_Binomics_Dr.UPR.pdf
Pests of cotton_Borer_Pests_Binomics_Dr.UPR.pdfPests of cotton_Borer_Pests_Binomics_Dr.UPR.pdf
Pests of cotton_Borer_Pests_Binomics_Dr.UPR.pdf
 
Chemistry 4th semester series (krishna).pdf
Chemistry 4th semester series (krishna).pdfChemistry 4th semester series (krishna).pdf
Chemistry 4th semester series (krishna).pdf
 
Pests of cotton_Sucking_Pests_Dr.UPR.pdf
Pests of cotton_Sucking_Pests_Dr.UPR.pdfPests of cotton_Sucking_Pests_Dr.UPR.pdf
Pests of cotton_Sucking_Pests_Dr.UPR.pdf
 
Formation of low mass protostars and their circumstellar disks
Formation of low mass protostars and their circumstellar disksFormation of low mass protostars and their circumstellar disks
Formation of low mass protostars and their circumstellar disks
 
Chemical Tests; flame test, positive and negative ions test Edexcel Internati...
Chemical Tests; flame test, positive and negative ions test Edexcel Internati...Chemical Tests; flame test, positive and negative ions test Edexcel Internati...
Chemical Tests; flame test, positive and negative ions test Edexcel Internati...
 
Labelling Requirements and Label Claims for Dietary Supplements and Recommend...
Labelling Requirements and Label Claims for Dietary Supplements and Recommend...Labelling Requirements and Label Claims for Dietary Supplements and Recommend...
Labelling Requirements and Label Claims for Dietary Supplements and Recommend...
 
Zoology 4th semester series (krishna).pdf
Zoology 4th semester series (krishna).pdfZoology 4th semester series (krishna).pdf
Zoology 4th semester series (krishna).pdf
 
GBSN - Microbiology (Unit 2)
GBSN - Microbiology (Unit 2)GBSN - Microbiology (Unit 2)
GBSN - Microbiology (Unit 2)
 
Kochi ❤CALL GIRL 84099*07087 ❤CALL GIRLS IN Kochi ESCORT SERVICE❤CALL GIRL
Kochi ❤CALL GIRL 84099*07087 ❤CALL GIRLS IN Kochi ESCORT SERVICE❤CALL GIRLKochi ❤CALL GIRL 84099*07087 ❤CALL GIRLS IN Kochi ESCORT SERVICE❤CALL GIRL
Kochi ❤CALL GIRL 84099*07087 ❤CALL GIRLS IN Kochi ESCORT SERVICE❤CALL GIRL
 
High Class Escorts in Hyderabad ₹7.5k Pick Up & Drop With Cash Payment 969456...
High Class Escorts in Hyderabad ₹7.5k Pick Up & Drop With Cash Payment 969456...High Class Escorts in Hyderabad ₹7.5k Pick Up & Drop With Cash Payment 969456...
High Class Escorts in Hyderabad ₹7.5k Pick Up & Drop With Cash Payment 969456...
 
Site Acceptance Test .
Site Acceptance Test                    .Site Acceptance Test                    .
Site Acceptance Test .
 
Pulmonary drug delivery system M.pharm -2nd sem P'ceutics
Pulmonary drug delivery system M.pharm -2nd sem P'ceuticsPulmonary drug delivery system M.pharm -2nd sem P'ceutics
Pulmonary drug delivery system M.pharm -2nd sem P'ceutics
 
Seismic Method Estimate velocity from seismic data.pptx
Seismic Method Estimate velocity from seismic  data.pptxSeismic Method Estimate velocity from seismic  data.pptx
Seismic Method Estimate velocity from seismic data.pptx
 
SCIENCE-4-QUARTER4-WEEK-4-PPT-1 (1).pptx
SCIENCE-4-QUARTER4-WEEK-4-PPT-1 (1).pptxSCIENCE-4-QUARTER4-WEEK-4-PPT-1 (1).pptx
SCIENCE-4-QUARTER4-WEEK-4-PPT-1 (1).pptx
 
Justdial Call Girls In Indirapuram, Ghaziabad, 8800357707 Escorts Service
Justdial Call Girls In Indirapuram, Ghaziabad, 8800357707 Escorts ServiceJustdial Call Girls In Indirapuram, Ghaziabad, 8800357707 Escorts Service
Justdial Call Girls In Indirapuram, Ghaziabad, 8800357707 Escorts Service
 
Clean In Place(CIP).pptx .
Clean In Place(CIP).pptx                 .Clean In Place(CIP).pptx                 .
Clean In Place(CIP).pptx .
 
High Profile 🔝 8250077686 📞 Call Girls Service in GTB Nagar🍑
High Profile 🔝 8250077686 📞 Call Girls Service in GTB Nagar🍑High Profile 🔝 8250077686 📞 Call Girls Service in GTB Nagar🍑
High Profile 🔝 8250077686 📞 Call Girls Service in GTB Nagar🍑
 
Bacterial Identification and Classifications
Bacterial Identification and ClassificationsBacterial Identification and Classifications
Bacterial Identification and Classifications
 
GBSN - Biochemistry (Unit 1)
GBSN - Biochemistry (Unit 1)GBSN - Biochemistry (Unit 1)
GBSN - Biochemistry (Unit 1)
 

Non linear curve fitting

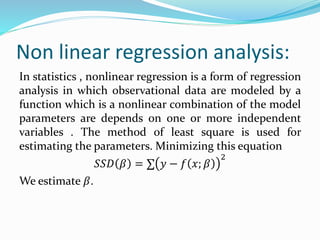
  • 1. Non linear regression analysis: In statistics , nonlinear regression is a form of regression analysis in which observational data are modeled by a function which is a nonlinear combination of the model parameters are depends on one or more independent variables . The method of least square is used for estimating the parameters. Minimizing this equation 푆푆퐷 훽 = Σ 푦 − 푓 푥; 훽 2 We estimate 훽.
  • 2. R code for nonlinear curve fitting To perform the nonlinear regression analysis in R then we use nls function. Example: t<-seq (0,10,0.1) y<-rnorm(101,5* exp (-t/5),0.2) plot(t, y, type="p", pch =16,col="red")
  • 3. Plot : From the diagram we see that the function is not linear.
  • 4. Now we perform the nonlinear analysis nls(y~A*exp (-alpha*t),start=c(A=2,alpha=0.05)) summary(nls(y~A*exp(alpha*t),start=c(A=2,alpha=0.05))) #Using summary we can test the hypothesis whether the parameters are zero or not. Outcome: A alpha 5.0664 0.2025 residual sum-of-squares: 4.436 Number of iterations to convergence: 5
  • 5. Estimate Std. Error t value Pr(>|t|) A 5.066399 0.062600 80.93 <2e-16 *** alpha 0.202503 0.004034 50.20 <2e-16 *** Significance codes: 0 ‘***’ 0.001 ‘**’ 0.01 ‘*’ 0.05 ‘.’ 0.1 ‘ ’ 1 Residual standard error: 0.2117 on 99 degrees of freedom From the result we see that the p value too small(<0.05) . so we reject the null hypothesis.
  • 6. Gompertz function…. Gompertz curve or Gompertz function is a type of mathematical model for a time series. In the Gompartz curve growth is slowest at the start and end of a time period. The Gompertz curve has a sigmoidal shape. The equation is 푦 = 푎푒−푏푒−푔푥
  • 8. Fitting Gompertz Curve: Finding the starting value: library(ISwR) juul attach(subset(juul2,age<20 & age>5 & sex==1)) data.1<-subset(juul2,age<20 & age>5 & sex==1) attach(data.1) Now the Gompertz model is a푒−푏푒−푔푥 ,the curve has a sigmoidal shape , approaching a constant level a as x increases and zero for large negative x. To obtain b and g parameter determined the location and sharpness. To obtain starting values for a non-linear fit one approach is to notice that the relation between y and x is something like log-log linear log(log(α)-log(y))=log(b)-gx
  • 9. From the figure (juul2), we get the maximum value of height i.e. a=200. With this guess we can make a plot that should so an approximate linear relationship. plot(log(log(200)-log(height))~age, col="blue", pch=16) fit<-lm(log(log(200)-log(height))~age) fit From this we get the value of log(b)=0.42 and age=-0.1553 Now we fit a nonlinear regression analysis nls(height~ α * exp (b * exp (-g*age)),start=c(α =200,b= exp (0.4293),g =0.1553)) plot( age, height) fit<-nls( height~ α*exp(- b *exp(- g *age)),start=c(a=200, b=exp(0.4293),g =0.1553)) Summary(fit) fit.frame<-seq ( 5,20,0.001) lines(fit.frame, predict(fit, newdata =data.frame(age=fit.frame)),lwd=2)
  • 10.
  • 11. Outcomes: After fitting the nls function we get the values of a b g 242.80628 1.17598 0.07903 then we test the hypothesis that the parameters are zero or not. Parameters: Estimate Std. Error t value P(>|t|) a 2.428e+02 1.157e+01 20.978 <2e-16 *** b 1.176e+00 1.892e-02 62.149 <2e-16 *** g 7.903e-02 8.569e-03 9.222 <2e-16 *** --- Signif. codes: 0 ‘***’ 0.001 ‘**’ 0.01 ‘*’ 0.05 ‘.’ 0.1 ‘ ’ 1 From the result we see that the p values of parameters are too small(<0.05). so we reject our null hypothesis at 5% level of significant.
  • 12. Plot the function with respect the sequence.
  • 13. Self starting models: Doesn't need to input initial values. This type of functions are starting with SS in R Ssgompertz. library(ISwR) age.height<-subset(juul2,age<20 & age>5 & sex==1) attach(age.height) nls(height~ SSgompertz(age,α,b, g )) α b g 242.807 1.176 0.924 residual sum-of-squares: 23151
  • 14. Draw back of self starting method: One minor drawback of self starting models is that we can not just transform them if you want to see if the model fits better on, e.g. a log-transformation nls(log(height)~log(SSgompertz(age,α,b,g))) So we can not use any transformation in self starting model.