Downloaded 159 times

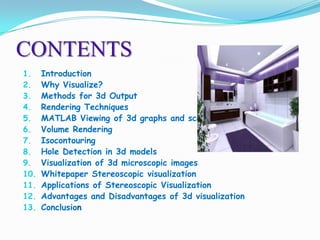
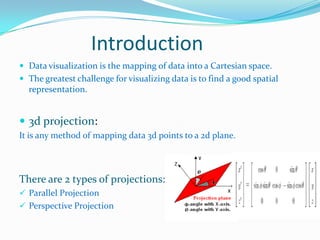
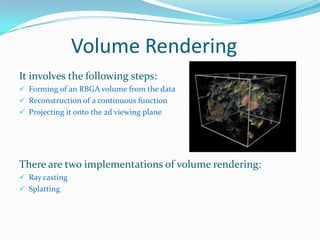
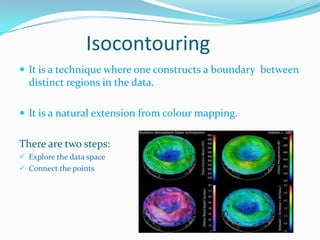
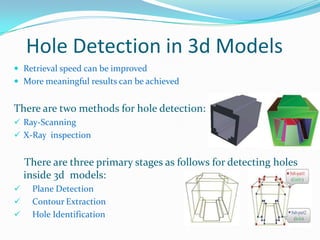
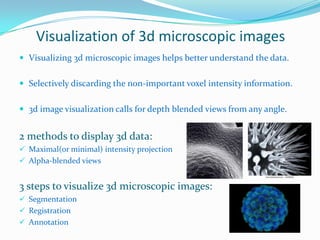
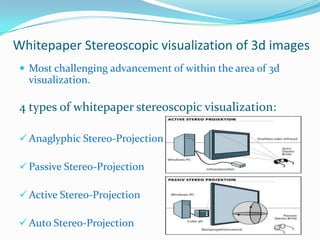
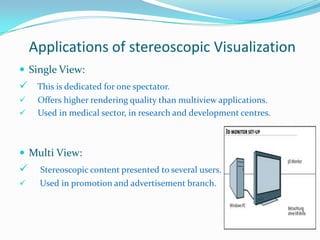
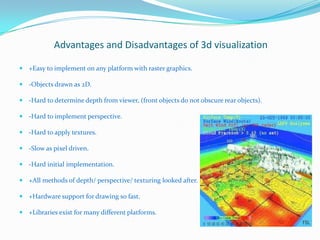


This document discusses techniques for 3D image visualization. It begins with an introduction and covers topics like rendering techniques, MATLAB visualization, volume rendering, isocontouring, hole detection, and applications of stereoscopic visualization. The document outlines various methods for 3D output like projection and OpenGL libraries. It discusses advantages like hardware support for 3D graphics and disadvantages such as objects being drawn as 2D. The conclusion states that while techniques exist, more research is still needed for innovative 3D visualization of diverse data types.