Download to read offline

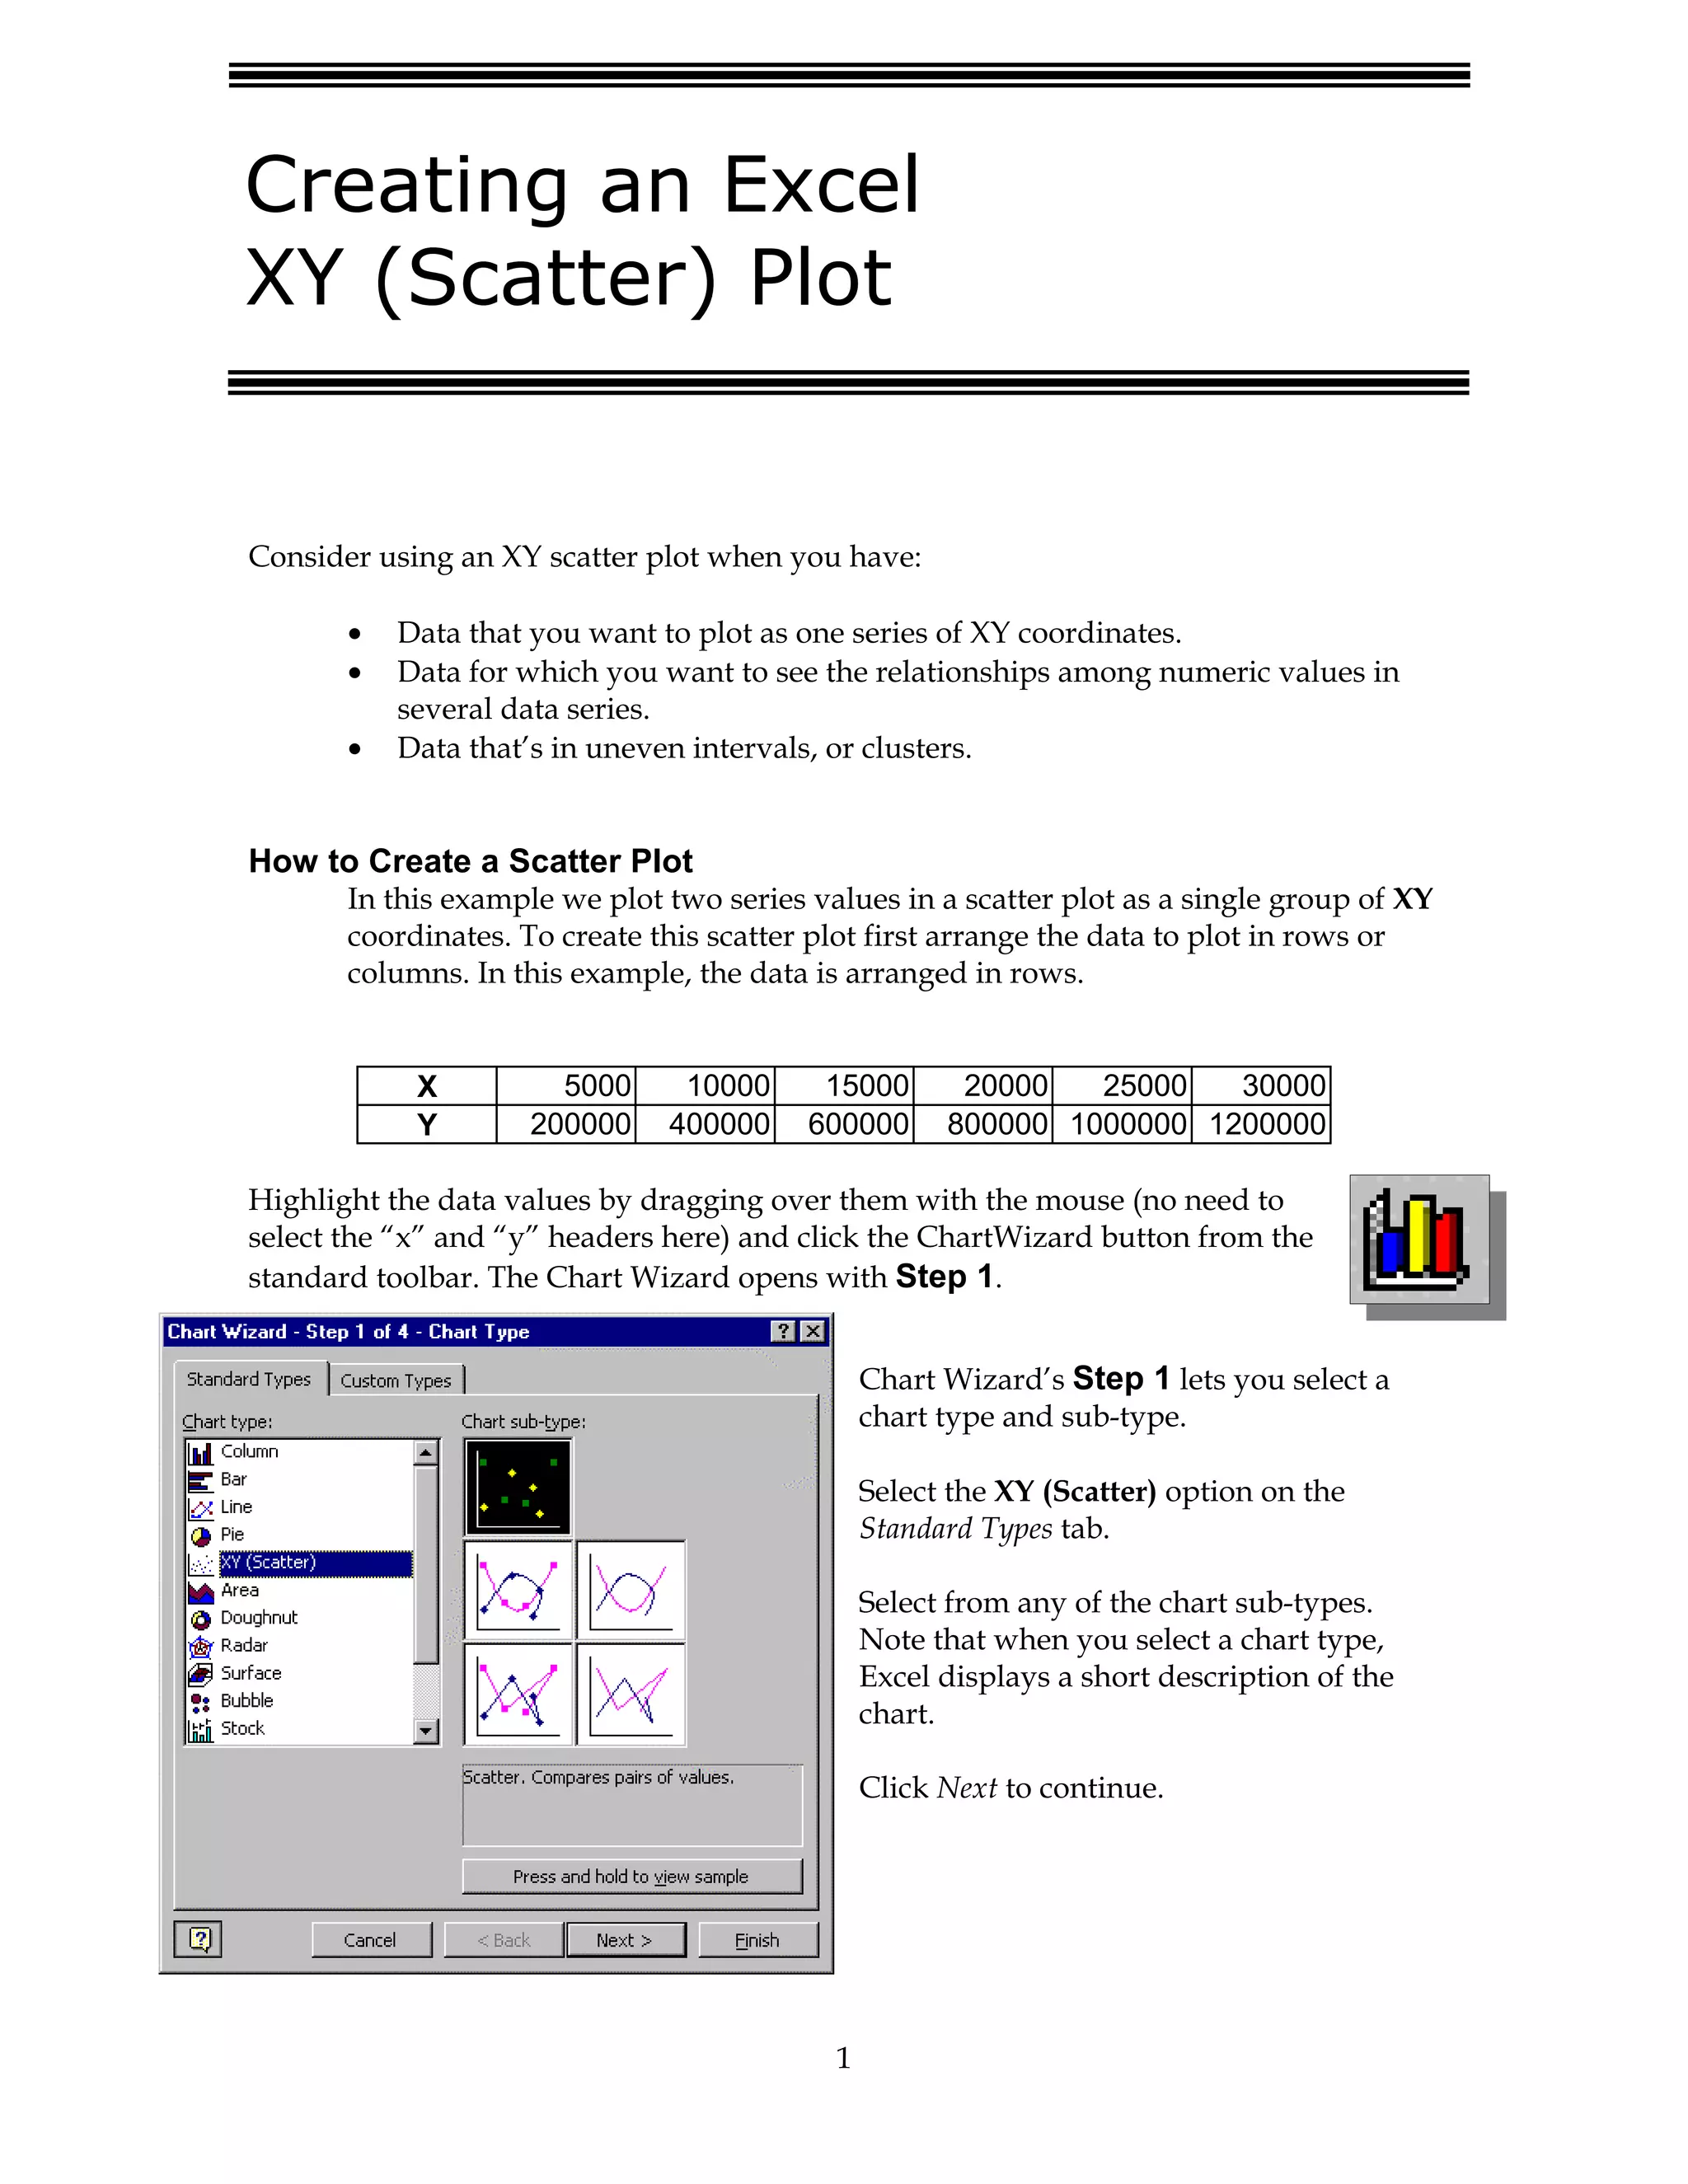
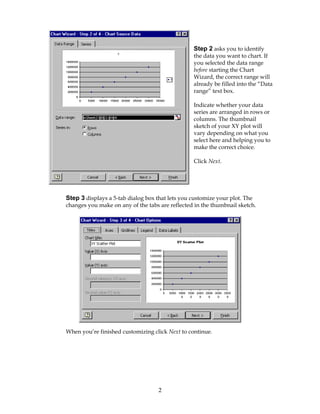
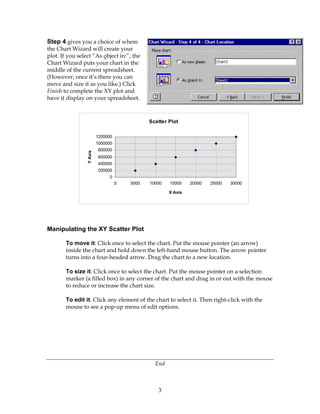

This document provides instructions for creating an XY scatter plot in Excel. It describes selecting an XY (Scatter) chart type in the Chart Wizard and identifying the data range to plot. The Chart Wizard allows customizing the plot over multiple tabs before finalizing the chart. The summary describes moving, sizing, and editing the scatter plot once created.