SlideShare a Scribd company logo
1 of 2
Download to read offline
Average total asking rentvs total net absorption
Source: JLL Research
Year-to-date salesvolume by submarket
Source: JLL Research
Preleased new construction
Source: JLL Research
Industrial market is healthy and there is something brewing
At the end of the third quarter 2016, total net absorption surpassed the 1.3million
square feet postedat the end of 2015. Duringthat same time frame, direct
average rents have increasedby $0.28 per square foot. Availability has
decreased as well, currently at 9.8 percent, two percentagepoints down fromat
the end of 2015when availability was at 11.8 percent. More notably, absorption
numbers for the third quarter this yearalonewerejust shy of half of the total
year-to-date number. Themarket is expectedto grow as Shell builds their
cracker plant, which is strategically placedto engross 70.0percent of North
America’s entire polyethylene demandwithin a700mile radius.
Shell adds more propertiesto their existing portfolio
In 2016, industrial capital investments have beenmostly divvied upbetweenthe
West and North submarkets, totaling $90.1million. With theexpectedarrival of
the Shell cracker plant, industrial properties anddevelopment sites arebeing
continually swallowed up nearthe plant by investors looking to cashin with the
anticipated futuredemand. Shell has beenmaking acquisitions as well, to be
sure they have the roomthey need, not only fortheir offices andwarehouses, but
for employee housing as well. In the thirdquarter, Shell purchasedthree land
sites on Frankfort Road inBeaverCounty, as well as 110 acres onStoney Ridge
in Center Townshipclose to theBeaver Valley Mall.
Robotics growing in the ‘burgh
A city once rich in blue collar factories and thesteel industry is repositioningitself
as a center of innovation androbotics. Uber’s facility in the Strip District is home
to self-driving cars and Uber will beadding to its presence in Pittsburgh withan
Advanced Technologies Center testing facility at the Almono site inHazelwood.
Uber is not the only company tappinginto Pittsburgh’s engineering talent pool for
robotics research, Caterpillarhas beenworkingwith CarnegieMellon University
on robotics research since2007. Recently, Caterpillar signed a leasefor upto
20,000 square feet of space inRIDC’s new building beingdeveloped onthe
former Heppenstall Steel Co. site in Lawrencevilleto housetheir robotics
department for automatingoff-highway haul trucks.
Industrial Insight
Pittsburgh | Q32016
13,510,006
Total availability (s.f.)
2,790,789
YTD total net absorption (s.f.)
$4.81
Average asking rent (p.s.f.)
612,500
Total under construction(s.f.)
9.8%
Total availability
2.0%
YTD net absorption(as a % of stock)
$6.25
New build asking rents (p.s.f.)
979,000
YTD construction completions (s.f.)
©2016 Jones Lang LaSalle IP, Inc. All rights reserved.For more information, contact: Tobiah Bilski | tobiah.bilski@am.jll.com
770,000
191,000
260,000
North West
East Downtown
South
$3.7M
$10.1M
$11.9M
$38.6M
$51.5M
0.0
1.0
2.0
Q4 2015 Q1 2016 Q2 2016 Q3 2016
Under Construction Preleased
$4.60
$4.80
$5.00
-2.0
0.0
2.0
4.0
2013 2014 2015 YTD 2016
Total Net Absorption Average Asking Rent
Total(m.s.f.)Total(m.s.f.)
($p.s.f.)
Pittsburgh industrial market gearing up for growth
Industrial Statistics
Pittsburgh | Q32016
©2016 Jones Lang LaSalle IP, Inc. All rights reserved.For more information, contact: Tobiah Bilski | tobiah.bilski@am.jll.com
Inventory
(s.f.)
Quarterly
total net
absorption
(s.f.)
YTD
total net
absorption
(s.f.)
YTD
total net
absorption
(% of stock)
Total
availability
(s.f.)
Total
availability
(%)
Average
total asking
rent
($ p.s.f.)
Quarterly
completions
(s.f.)
YTD
completions
(s.f.)
Under
construction
(s.f.)
Pittsburgh Totals
Warehouse & Distribution 82,961,466 839,160 1,626,925 2.0% 9,505,629 11.5% $5.27 568,000 923,000 612,500
Manufacturing 54,930,448 417,828 1,163,864 2.1% 4,004,377 7.3% $3.72 56,000 56,000 0
Totals 137,891,914 1,256,988 2,790,789 2.0% 13,510,006 9.8% $4.81 624,000 979,000 612,500
Flex 20,633,880 -98,701 383,027 1.9% 2,733,279 13.2% $9.99 0 54,000 68,000
Beaver County
Warehouse & Distribution 4,526,997 219,563 283,532 6.3% 700,816 15.5% $5.39 0 0 0
Manufacturing 4,517,893 0 38,000 0.8% 157,200 3.5% $2.65 0 0 0
Totals 9,044,890 219,563 321,532 3.6% 858,016 9.5% $4.89 0 0 0
Flex 579,085 -5,025 9,739 1.7% 107,596 18.6% $10.00 0 0 0
Butler County
Warehouse & Distribution 3,615,353 -10,492 -30,225 -0.8% 283,537 7.8% $7.68 0 305,000 135,000
Manufacturing 3,588,175 43,000 71,500 2.0% 419,289 11.7% $1.20 56,000 56,000 0
Totals 7,203,528 32,508 41,275 0.6% 702,826 9.8% $3.81 56,000 361,000 135,000
Flex 386,900 0 0 0.0% 11,000 2.8% $10.00 0 0 0
Downtown
Warehouse & Distribution 18,444,302 -35,468 11,048 0.1% 1,396,636 7.6% $5.25 0 0 0
Manufacturing 4,823,443 26,573 263,096 5.5% 120,577 2.5% $7.15 0 0 0
Totals 23,267,745 -8,895 274,144 1.2% 1,517,213 6.5% $5.40 0 0 0
Flex 3,047,812 -46,848 55,182 1.8% 381,129 12.5% $8.10 0 0 0
East
Warehouse & Distribution 6,565,485 -7,272 14,679 0.2% 641,705 9.8% $5.14 0 0 0
Manufacturing 4,594,489 35,199 9,981 0.2% 370,926 8.1% $4.00 0 0 0
Totals 11,159,974 27,927 24,660 0.2% 1,012,631 9.1% $4.72 0 0 0
Flex 2,858,912 15,375 195,831 6.8% 639,572 22.4% $10.50 0 0 0
Northeast
Warehouse & Distribution 6,291,992 30,740 99,792 1.6% 320,511 5.1% $5.15 0 0 0
Manufacturing 6,408,774 -29,790 157,310 2.5% 123,536 1.9% $5.75 0 0 0
Totals 12,700,766 950 257,102 2.0% 444,047 3.5% $5.32 0 0 0
Flex 3,006,818 -7,650 50,449 1.7% 283,938 9.4% $10.75 0 0 0
Northwest
Warehouse & Distribution 10,204,144 78,700 339,301 3.3% 1,105,103 10.8% $5.96 0 0 0
Manufacturing 3,479,451 0 58,300 1.7% 40,040 1.2% $4.00 0 0 0
Totals 13,683,595 78,700 397,601 2.9% 1,145,143 8.4% $5.89 0 0 0
Flex 2,109,466 9,049 19,018 0.9% 174,200 8.3% $12.27 0 0 0
South
Warehouse & Distribution 5,381,206 -48,760 -96,359 -1.8% 541,600 10.1% $3.35 0 0 0
Manufacturing 8,033,856 -86,114 -81,114 -1.0% 177,782 2.2% $6.75 0 0 0
Totals 13,415,062 -134,874 -177,473 -1.3% 719,382 5.4% $4.19 0 0 0
Flex 1,634,737 -14,600 28,510 1.7% 108,564 6.6% $11.66 0 0 0
Washington County
Warehouse & Distribution 5,449,811 3,827 285,230 5.2% 1,927,313 35.4% $4.75 0 0 0
Manufacturing 4,716,380 0 147,025 3.1% 230,350 4.9% $4.95 0 0 0
Totals 10,166,191 3,827 432,255 4.3% 2,157,663 21.2% $4.77 0 0 0
Flex 1,404,532 -56,750 -105,861 -7.5% 303,709 21.6% $9.00 0 0 0
West
Warehouse & Distribution 10,468,325 581,522 525,090 5.0% 1,204,671 11.5% $6.34 568,000 568,000 180,000
Manufacturing 2,760,269 0 4,172 0.2% 159,916 5.8% $5.00 0 0 0
Totals 13,228,594 581,522 529,262 4.0% 1,364,587 10.3% $6.18 568,000 568,000 180,000
Flex 3,192,163 9,244 55,731 1.7% 465,322 14.6% $12.59 0 54,000 68,000
Westmoreland County
Warehouse & Distribution 12,061,179 24,940 191,427 1.6% 1,467,947 12.2% $4.40 0 50,000 297,500
Manufacturing 12,959,110 428,960 495,594 3.8% 2,286,651 17.6% $3.68 0 0 0
Totals 25,020,289 453,900 687,021 2.7% 3,754,598 15.0% $4.81 0 50,000 297,500
Flex 2,413,455 -1,496 74,428 3.1% 258,249 10.7% $4.77 0 0 0

More Related Content

What's hot

What's hot (20)

JLL Detroit Industrial Insight & Statistics - Q4 2017
JLL Detroit Industrial Insight & Statistics - Q4 2017JLL Detroit Industrial Insight & Statistics - Q4 2017
JLL Detroit Industrial Insight & Statistics - Q4 2017
 
JLL Pittsburgh Industrial Insight & Statistics - Q3 2019
JLL Pittsburgh Industrial Insight & Statistics - Q3 2019JLL Pittsburgh Industrial Insight & Statistics - Q3 2019
JLL Pittsburgh Industrial Insight & Statistics - Q3 2019
 
JLL Pittsburgh Industrial Insight & Statistics - Q1 2021
JLL Pittsburgh Industrial Insight & Statistics - Q1 2021JLL Pittsburgh Industrial Insight & Statistics - Q1 2021
JLL Pittsburgh Industrial Insight & Statistics - Q1 2021
 
JLL Pittsburgh Industrial Insight & Statistics - Q2 2021
JLL Pittsburgh Industrial Insight & Statistics - Q2 2021JLL Pittsburgh Industrial Insight & Statistics - Q2 2021
JLL Pittsburgh Industrial Insight & Statistics - Q2 2021
 
JLL Pittsburgh Industrial Insight & Statistics - Q3 2020
JLL Pittsburgh Industrial Insight & Statistics - Q3 2020JLL Pittsburgh Industrial Insight & Statistics - Q3 2020
JLL Pittsburgh Industrial Insight & Statistics - Q3 2020
 
JLL Cleveland Industrial Outlook: Q4 2018
JLL Cleveland Industrial Outlook: Q4 2018JLL Cleveland Industrial Outlook: Q4 2018
JLL Cleveland Industrial Outlook: Q4 2018
 
JLL Cleveland Industrial Outlook: Q4 2018
JLL Cleveland Industrial Outlook: Q4 2018JLL Cleveland Industrial Outlook: Q4 2018
JLL Cleveland Industrial Outlook: Q4 2018
 
JLL Pittsburgh Office Insight & Statistics - Q3 2017
JLL Pittsburgh Office Insight & Statistics - Q3 2017JLL Pittsburgh Office Insight & Statistics - Q3 2017
JLL Pittsburgh Office Insight & Statistics - Q3 2017
 
JLL Pittsburgh Industrial Insight & Statistics - Q3 2017
JLL Pittsburgh Industrial Insight & Statistics - Q3 2017JLL Pittsburgh Industrial Insight & Statistics - Q3 2017
JLL Pittsburgh Industrial Insight & Statistics - Q3 2017
 
JLL Pittsburgh Industrial Insight & Statistics - Q1 2019
JLL Pittsburgh Industrial Insight & Statistics - Q1 2019JLL Pittsburgh Industrial Insight & Statistics - Q1 2019
JLL Pittsburgh Industrial Insight & Statistics - Q1 2019
 
JLL Pittsburgh Office Insight & Statistics - Q3 2021
JLL Pittsburgh Office Insight & Statistics - Q3 2021JLL Pittsburgh Office Insight & Statistics - Q3 2021
JLL Pittsburgh Office Insight & Statistics - Q3 2021
 
JLL West Michigan Industrial Insight & Statistics - Q1 2019
JLL West Michigan Industrial Insight & Statistics - Q1 2019JLL West Michigan Industrial Insight & Statistics - Q1 2019
JLL West Michigan Industrial Insight & Statistics - Q1 2019
 
JLL Pittsburgh Industrial Insight & Statistics - Q1 2017
JLL Pittsburgh Industrial Insight & Statistics - Q1 2017JLL Pittsburgh Industrial Insight & Statistics - Q1 2017
JLL Pittsburgh Industrial Insight & Statistics - Q1 2017
 
JLL Cleveland Industrial Outlook: Q1 2019
JLL Cleveland Industrial Outlook: Q1 2019JLL Cleveland Industrial Outlook: Q1 2019
JLL Cleveland Industrial Outlook: Q1 2019
 
JLL Columbus Industrial Outlook: Q3 2016
JLL Columbus Industrial Outlook: Q3 2016JLL Columbus Industrial Outlook: Q3 2016
JLL Columbus Industrial Outlook: Q3 2016
 
JLL Detroit Industrial Insight & Statistics - Q1 2017
JLL Detroit Industrial Insight & Statistics - Q1 2017JLL Detroit Industrial Insight & Statistics - Q1 2017
JLL Detroit Industrial Insight & Statistics - Q1 2017
 
JLL Pittsburgh Industrial Insight & Statistics - Q4 2019
JLL Pittsburgh Industrial Insight & Statistics - Q4 2019JLL Pittsburgh Industrial Insight & Statistics - Q4 2019
JLL Pittsburgh Industrial Insight & Statistics - Q4 2019
 
JLL Detroit Industrial Insight & Statistics - Q3 2016
JLL Detroit Industrial Insight & Statistics - Q3 2016JLL Detroit Industrial Insight & Statistics - Q3 2016
JLL Detroit Industrial Insight & Statistics - Q3 2016
 
JLL West Michigan Industrial Insight & Statistics - Q3 2018
JLL West Michigan Industrial Insight & Statistics - Q3 2018JLL West Michigan Industrial Insight & Statistics - Q3 2018
JLL West Michigan Industrial Insight & Statistics - Q3 2018
 
JLL Cleveland Industrial Outlook Q4 2019
JLL Cleveland Industrial Outlook Q4 2019JLL Cleveland Industrial Outlook Q4 2019
JLL Cleveland Industrial Outlook Q4 2019
 

Viewers also liked

I see the lord
I see the lordI see the lord
I see the lord
Aron Thie
 
Michelle danner acting school tw
Michelle danner acting school twMichelle danner acting school tw
Michelle danner acting school tw
Jeff Cheng
 
14. orthocenter touchpad
14. orthocenter touchpad14. orthocenter touchpad
14. orthocenter touchpad
Media4math
 

Viewers also liked (16)

France to Polis Chrysokous, Cyprus 2016/02/21
France to Polis Chrysokous, Cyprus 2016/02/21France to Polis Chrysokous, Cyprus 2016/02/21
France to Polis Chrysokous, Cyprus 2016/02/21
 
I see the lord
I see the lordI see the lord
I see the lord
 
неделя науки гимназия 11
неделя науки гимназия 11 неделя науки гимназия 11
неделя науки гимназия 11
 
300 module 5 the case of sam’s company
 300 module 5 the case of sam’s company 300 module 5 the case of sam’s company
300 module 5 the case of sam’s company
 
Michelle danner acting school tw
Michelle danner acting school twMichelle danner acting school tw
Michelle danner acting school tw
 
Análise do anúncio da Philco
Análise do anúncio da PhilcoAnálise do anúncio da Philco
Análise do anúncio da Philco
 
Comic book budget
Comic book budgetComic book budget
Comic book budget
 
Fotografías y Clichés Fotográficos
Fotografías y Clichés FotográficosFotografías y Clichés Fotográficos
Fotografías y Clichés Fotográficos
 
Creation of Referral Form - Dr. Oliver
Creation of Referral Form - Dr. OliverCreation of Referral Form - Dr. Oliver
Creation of Referral Form - Dr. Oliver
 
Harvinder music
Harvinder musicHarvinder music
Harvinder music
 
14. orthocenter touchpad
14. orthocenter touchpad14. orthocenter touchpad
14. orthocenter touchpad
 
BMS
BMSBMS
BMS
 
Semana 1 y 2 instrumentacion y control
Semana 1 y 2 instrumentacion y controlSemana 1 y 2 instrumentacion y control
Semana 1 y 2 instrumentacion y control
 
Lurra planeta: zubia santillana
Lurra planeta: zubia santillanaLurra planeta: zubia santillana
Lurra planeta: zubia santillana
 
Revoluciones liberales y nacionalismo
Revoluciones liberales y nacionalismoRevoluciones liberales y nacionalismo
Revoluciones liberales y nacionalismo
 
A study on training and development conducted at bharathi associates
A study on training and development conducted at bharathi associatesA study on training and development conducted at bharathi associates
A study on training and development conducted at bharathi associates
 

Similar to JLL Pittsburgh Industrial Insight & Statistics - Q3 2016

Similar to JLL Pittsburgh Industrial Insight & Statistics - Q3 2016 (16)

JLL Pittsburgh Industrial Insight & Statistics - Q4 2018
JLL Pittsburgh Industrial Insight & Statistics - Q4 2018JLL Pittsburgh Industrial Insight & Statistics - Q4 2018
JLL Pittsburgh Industrial Insight & Statistics - Q4 2018
 
JLL Detroit Industrial Insight & Statistics - Q4 2018
JLL Detroit Industrial Insight & Statistics - Q4 2018JLL Detroit Industrial Insight & Statistics - Q4 2018
JLL Detroit Industrial Insight & Statistics - Q4 2018
 
JLL Pittsburgh Industrial Insight & Statistics - Q2 2018
JLL Pittsburgh Industrial Insight & Statistics - Q2 2018JLL Pittsburgh Industrial Insight & Statistics - Q2 2018
JLL Pittsburgh Industrial Insight & Statistics - Q2 2018
 
JLL Detroit Industrial Insight & Statistics - Q2 2016
JLL Detroit Industrial Insight & Statistics - Q2 2016JLL Detroit Industrial Insight & Statistics - Q2 2016
JLL Detroit Industrial Insight & Statistics - Q2 2016
 
JLL Pittsburgh Industrial Insight & Statistics - Q3 2018
JLL Pittsburgh Industrial Insight & Statistics - Q3 2018JLL Pittsburgh Industrial Insight & Statistics - Q3 2018
JLL Pittsburgh Industrial Insight & Statistics - Q3 2018
 
JLL Detroit Industrial Insight & Statistics - Q3 2017
JLL Detroit Industrial Insight & Statistics - Q3 2017JLL Detroit Industrial Insight & Statistics - Q3 2017
JLL Detroit Industrial Insight & Statistics - Q3 2017
 
JLL Cincinnati Industrial Outlook - Q3 2016
JLL Cincinnati Industrial Outlook - Q3 2016JLL Cincinnati Industrial Outlook - Q3 2016
JLL Cincinnati Industrial Outlook - Q3 2016
 
JLL Cleveland Industrial Outlook: Q1 2017
JLL Cleveland Industrial Outlook: Q1 2017JLL Cleveland Industrial Outlook: Q1 2017
JLL Cleveland Industrial Outlook: Q1 2017
 
Jll cincinnati industrial outlook q1 2017
Jll cincinnati industrial outlook   q1 2017Jll cincinnati industrial outlook   q1 2017
Jll cincinnati industrial outlook q1 2017
 
Q3 2014 industrial market report
Q3 2014 industrial market reportQ3 2014 industrial market report
Q3 2014 industrial market report
 
JLL Cincinnati Industrial Outlook Q1 2021
JLL Cincinnati Industrial Outlook Q1 2021JLL Cincinnati Industrial Outlook Q1 2021
JLL Cincinnati Industrial Outlook Q1 2021
 
JLL Cincinnati Industrial Outlook Q4 2017
JLL Cincinnati Industrial Outlook Q4 2017JLL Cincinnati Industrial Outlook Q4 2017
JLL Cincinnati Industrial Outlook Q4 2017
 
JLL Pittsburgh Industrial Insight & Statistics - Q4 2020
JLL Pittsburgh Industrial Insight & Statistics - Q4 2020JLL Pittsburgh Industrial Insight & Statistics - Q4 2020
JLL Pittsburgh Industrial Insight & Statistics - Q4 2020
 
JLL Cincinnati Industrial Outlook Q3 2017
JLL Cincinnati Industrial Outlook  Q3 2017JLL Cincinnati Industrial Outlook  Q3 2017
JLL Cincinnati Industrial Outlook Q3 2017
 
JLL Pittsburgh Industrial Insight & Statistics - Q2 2019
JLL Pittsburgh Industrial Insight & Statistics - Q2 2019JLL Pittsburgh Industrial Insight & Statistics - Q2 2019
JLL Pittsburgh Industrial Insight & Statistics - Q2 2019
 
Q2 2014 industrial market report
Q2 2014 industrial market reportQ2 2014 industrial market report
Q2 2014 industrial market report
 

More from Tobiah Bilski

More from Tobiah Bilski (17)

Pittsburgh Office Insight & Stats Q1 2022
Pittsburgh Office Insight & Stats Q1 2022Pittsburgh Office Insight & Stats Q1 2022
Pittsburgh Office Insight & Stats Q1 2022
 
JLL Pittsburgh Industrial Insight & Statistics - Q4 2021
JLL Pittsburgh Industrial Insight & Statistics - Q4 2021JLL Pittsburgh Industrial Insight & Statistics - Q4 2021
JLL Pittsburgh Industrial Insight & Statistics - Q4 2021
 
Pittsburgh Office Insight & Stats Q4 2021
Pittsburgh Office Insight & Stats Q4 2021Pittsburgh Office Insight & Stats Q4 2021
Pittsburgh Office Insight & Stats Q4 2021
 
JLL Pittsburgh Industrial Insight & Statistics - Q3 2021
JLL Pittsburgh Industrial Insight & Statistics - Q3 2021JLL Pittsburgh Industrial Insight & Statistics - Q3 2021
JLL Pittsburgh Industrial Insight & Statistics - Q3 2021
 
JLL Pittsburgh Office Insight & Statistics - Q2 2021
JLL Pittsburgh Office Insight & Statistics - Q2 2021JLL Pittsburgh Office Insight & Statistics - Q2 2021
JLL Pittsburgh Office Insight & Statistics - Q2 2021
 
JLL Pittsburgh Office Insight & Statistics - Q1 2021
JLL Pittsburgh Office Insight & Statistics - Q1 2021JLL Pittsburgh Office Insight & Statistics - Q1 2021
JLL Pittsburgh Office Insight & Statistics - Q1 2021
 
JLL Pittsburgh Industrial Insight & Statistics - Q2 2020
JLL Pittsburgh Industrial Insight & Statistics - Q2 2020JLL Pittsburgh Industrial Insight & Statistics - Q2 2020
JLL Pittsburgh Industrial Insight & Statistics - Q2 2020
 
JLL Pittsburgh Office Insight & Statistics - Q2 2020
JLL Pittsburgh Office Insight & Statistics - Q2 2020JLL Pittsburgh Office Insight & Statistics - Q2 2020
JLL Pittsburgh Office Insight & Statistics - Q2 2020
 
JLL Pittsburgh Office Insight & Statistics - Q1 2020
JLL Pittsburgh Office Insight & Statistics - Q1 2020JLL Pittsburgh Office Insight & Statistics - Q1 2020
JLL Pittsburgh Office Insight & Statistics - Q1 2020
 
JLL Pittsburgh Industrial Insight & Statistics - Q1 2020
JLL Pittsburgh Industrial Insight & Statistics - Q1 2020JLL Pittsburgh Industrial Insight & Statistics - Q1 2020
JLL Pittsburgh Industrial Insight & Statistics - Q1 2020
 
JLL Pittsburgh Office Insight & Statistics - Q4 2019
JLL Pittsburgh Office Insight & Statistics - Q4 2019JLL Pittsburgh Office Insight & Statistics - Q4 2019
JLL Pittsburgh Office Insight & Statistics - Q4 2019
 
JLL Pittsburgh Office Insight & Statistics - Q3 2019
 JLL Pittsburgh Office Insight & Statistics - Q3 2019 JLL Pittsburgh Office Insight & Statistics - Q3 2019
JLL Pittsburgh Office Insight & Statistics - Q3 2019
 
JLL Pittsburgh Office Insight & Statistics - Q2 2019
JLL Pittsburgh Office Insight & Statistics - Q2 2019JLL Pittsburgh Office Insight & Statistics - Q2 2019
JLL Pittsburgh Office Insight & Statistics - Q2 2019
 
JLL Pittsburgh Office Insight & Statistics - Q1 2019
JLL Pittsburgh Office Insight & Statistics - Q1 2019JLL Pittsburgh Office Insight & Statistics - Q1 2019
JLL Pittsburgh Office Insight & Statistics - Q1 2019
 
JLL Pittsburgh Office Insight & Statistics - Q4 2018
JLL Pittsburgh Office Insight & Statistics - Q4 2018JLL Pittsburgh Office Insight & Statistics - Q4 2018
JLL Pittsburgh Office Insight & Statistics - Q4 2018
 
JLL Pittsburgh Office Insight & Statistics - Q3 2018
JLL Pittsburgh Office Insight & Statistics - Q3 2018JLL Pittsburgh Office Insight & Statistics - Q3 2018
JLL Pittsburgh Office Insight & Statistics - Q3 2018
 
JLL Pittsburgh Office Insight & Statistics - Q2 2018
JLL Pittsburgh Office Insight & Statistics - Q2 2018 JLL Pittsburgh Office Insight & Statistics - Q2 2018
JLL Pittsburgh Office Insight & Statistics - Q2 2018
 

Recently uploaded

Bptp The Amaario Launch Luxury Project Sector 37D Gurgaon Dwarka Expressway...
Bptp The Amaario Launch  Luxury Project  Sector 37D Gurgaon Dwarka Expressway...Bptp The Amaario Launch  Luxury Project  Sector 37D Gurgaon Dwarka Expressway...
Bptp The Amaario Launch Luxury Project Sector 37D Gurgaon Dwarka Expressway...
ApartmentWala1
 
Cheap Rate ✨➥9711108085▻✨Call Girls In Amar Colony (Delhi)
Cheap Rate ✨➥9711108085▻✨Call Girls In Amar Colony (Delhi)Cheap Rate ✨➥9711108085▻✨Call Girls In Amar Colony (Delhi)
Cheap Rate ✨➥9711108085▻✨Call Girls In Amar Colony (Delhi)
delhi24hrs1
 
9990771857 Call Girls in Dwarka Sector 1 Delhi (Call Girls) Delhi
9990771857 Call Girls in Dwarka Sector 1 Delhi (Call Girls) Delhi9990771857 Call Girls in Dwarka Sector 1 Delhi (Call Girls) Delhi
9990771857 Call Girls in Dwarka Sector 1 Delhi (Call Girls) Delhi
delhimodel235
 
Cheap Rate ✨➥9711108085▻✨Call Girls In Malviya Nagar(Delhi)
Cheap Rate ✨➥9711108085▻✨Call Girls In Malviya Nagar(Delhi)Cheap Rate ✨➥9711108085▻✨Call Girls In Malviya Nagar(Delhi)
Cheap Rate ✨➥9711108085▻✨Call Girls In Malviya Nagar(Delhi)
delhi24hrs1
 
Call Girls In Krishna Nagar Delhi (Escort)↫8447779280↬@SHOT 1500- NIGHT 5500→...
Call Girls In Krishna Nagar Delhi (Escort)↫8447779280↬@SHOT 1500- NIGHT 5500→...Call Girls In Krishna Nagar Delhi (Escort)↫8447779280↬@SHOT 1500- NIGHT 5500→...
Call Girls In Krishna Nagar Delhi (Escort)↫8447779280↬@SHOT 1500- NIGHT 5500→...
asmaqueen5
 
9990771857 Call Girls in Dwarka Sector 2 Delhi (Call Girls) Delhi
9990771857 Call Girls in Dwarka Sector 2 Delhi (Call Girls) Delhi9990771857 Call Girls in Dwarka Sector 2 Delhi (Call Girls) Delhi
9990771857 Call Girls in Dwarka Sector 2 Delhi (Call Girls) Delhi
delhimodel235
 
MEQ Mainstreet Equity Corp Q2 2024 Investor Presentation
MEQ Mainstreet Equity Corp Q2 2024 Investor PresentationMEQ Mainstreet Equity Corp Q2 2024 Investor Presentation
MEQ Mainstreet Equity Corp Q2 2024 Investor Presentation
MEQ - Mainstreet Equity Corp.
 
Cheap Rate ✨➥9711108085▻✨Call Girls In Bhajanpura (Delhi)
Cheap Rate ✨➥9711108085▻✨Call Girls In Bhajanpura (Delhi)Cheap Rate ✨➥9711108085▻✨Call Girls In Bhajanpura (Delhi)
Cheap Rate ✨➥9711108085▻✨Call Girls In Bhajanpura (Delhi)
delhi24hrs1
 
9990771857 Call Girls Dwarka Sector 9 Delhi (Call Girls ) Delhi
9990771857 Call Girls Dwarka Sector 9 Delhi (Call Girls ) Delhi9990771857 Call Girls Dwarka Sector 9 Delhi (Call Girls ) Delhi
9990771857 Call Girls Dwarka Sector 9 Delhi (Call Girls ) Delhi
delhimodel235
 

Recently uploaded (20)

Kohinoor Hinjewadi Phase 2 Pune E-Brochure.pdf
Kohinoor Hinjewadi Phase 2 Pune  E-Brochure.pdfKohinoor Hinjewadi Phase 2 Pune  E-Brochure.pdf
Kohinoor Hinjewadi Phase 2 Pune E-Brochure.pdf
 
Bptp The Amaario Launch Luxury Project Sector 37D Gurgaon Dwarka Expressway...
Bptp The Amaario Launch  Luxury Project  Sector 37D Gurgaon Dwarka Expressway...Bptp The Amaario Launch  Luxury Project  Sector 37D Gurgaon Dwarka Expressway...
Bptp The Amaario Launch Luxury Project Sector 37D Gurgaon Dwarka Expressway...
 
Cheap Rate ✨➥9711108085▻✨Call Girls In Amar Colony (Delhi)
Cheap Rate ✨➥9711108085▻✨Call Girls In Amar Colony (Delhi)Cheap Rate ✨➥9711108085▻✨Call Girls In Amar Colony (Delhi)
Cheap Rate ✨➥9711108085▻✨Call Girls In Amar Colony (Delhi)
 
Yashwin Enchante Uppar Kharadi Pune E-Brochue.pdf
Yashwin Enchante Uppar Kharadi Pune  E-Brochue.pdfYashwin Enchante Uppar Kharadi Pune  E-Brochue.pdf
Yashwin Enchante Uppar Kharadi Pune E-Brochue.pdf
 
9990771857 Call Girls in Dwarka Sector 1 Delhi (Call Girls) Delhi
9990771857 Call Girls in Dwarka Sector 1 Delhi (Call Girls) Delhi9990771857 Call Girls in Dwarka Sector 1 Delhi (Call Girls) Delhi
9990771857 Call Girls in Dwarka Sector 1 Delhi (Call Girls) Delhi
 
Cheap Rate ✨➥9711108085▻✨Call Girls In Malviya Nagar(Delhi)
Cheap Rate ✨➥9711108085▻✨Call Girls In Malviya Nagar(Delhi)Cheap Rate ✨➥9711108085▻✨Call Girls In Malviya Nagar(Delhi)
Cheap Rate ✨➥9711108085▻✨Call Girls In Malviya Nagar(Delhi)
 
Greater Vancouver Realtors Statistics Package April 2024
Greater Vancouver Realtors Statistics Package April 2024Greater Vancouver Realtors Statistics Package April 2024
Greater Vancouver Realtors Statistics Package April 2024
 
Call Girls In Krishna Nagar Delhi (Escort)↫8447779280↬@SHOT 1500- NIGHT 5500→...
Call Girls In Krishna Nagar Delhi (Escort)↫8447779280↬@SHOT 1500- NIGHT 5500→...Call Girls In Krishna Nagar Delhi (Escort)↫8447779280↬@SHOT 1500- NIGHT 5500→...
Call Girls In Krishna Nagar Delhi (Escort)↫8447779280↬@SHOT 1500- NIGHT 5500→...
 
Kalpataru Exquisite Wakad Pune E-Brochure.pdf
Kalpataru Exquisite Wakad Pune  E-Brochure.pdfKalpataru Exquisite Wakad Pune  E-Brochure.pdf
Kalpataru Exquisite Wakad Pune E-Brochure.pdf
 
9990771857 Call Girls in Dwarka Sector 2 Delhi (Call Girls) Delhi
9990771857 Call Girls in Dwarka Sector 2 Delhi (Call Girls) Delhi9990771857 Call Girls in Dwarka Sector 2 Delhi (Call Girls) Delhi
9990771857 Call Girls in Dwarka Sector 2 Delhi (Call Girls) Delhi
 
Eldeco Dwarka Project In Delhi-brochure.pdf.pdf
Eldeco Dwarka Project In Delhi-brochure.pdf.pdfEldeco Dwarka Project In Delhi-brochure.pdf.pdf
Eldeco Dwarka Project In Delhi-brochure.pdf.pdf
 
Rohan Harita Tathawade Pune Brochure.pdf
Rohan Harita Tathawade Pune Brochure.pdfRohan Harita Tathawade Pune Brochure.pdf
Rohan Harita Tathawade Pune Brochure.pdf
 
Vanam At Purva Soukhyam Guduvanchery.pdf.pdf
Vanam At Purva Soukhyam Guduvanchery.pdf.pdfVanam At Purva Soukhyam Guduvanchery.pdf.pdf
Vanam At Purva Soukhyam Guduvanchery.pdf.pdf
 
MEQ Mainstreet Equity Corp Q2 2024 Investor Presentation
MEQ Mainstreet Equity Corp Q2 2024 Investor PresentationMEQ Mainstreet Equity Corp Q2 2024 Investor Presentation
MEQ Mainstreet Equity Corp Q2 2024 Investor Presentation
 
Mapusa Beach ( Call Girls ) Goa ✔ 8617370543 ✅ By Goa Call Girls For Pick Up ...
Mapusa Beach ( Call Girls ) Goa ✔ 8617370543 ✅ By Goa Call Girls For Pick Up ...Mapusa Beach ( Call Girls ) Goa ✔ 8617370543 ✅ By Goa Call Girls For Pick Up ...
Mapusa Beach ( Call Girls ) Goa ✔ 8617370543 ✅ By Goa Call Girls For Pick Up ...
 
Yedi Mavi TOBB Zeytinburnu - Listing Turkey
Yedi Mavi TOBB Zeytinburnu - Listing TurkeyYedi Mavi TOBB Zeytinburnu - Listing Turkey
Yedi Mavi TOBB Zeytinburnu - Listing Turkey
 
Cheap Rate ✨➥9711108085▻✨Call Girls In Bhajanpura (Delhi)
Cheap Rate ✨➥9711108085▻✨Call Girls In Bhajanpura (Delhi)Cheap Rate ✨➥9711108085▻✨Call Girls In Bhajanpura (Delhi)
Cheap Rate ✨➥9711108085▻✨Call Girls In Bhajanpura (Delhi)
 
SVN Live 5.6.24 Weekly Property Broadcast
SVN Live 5.6.24 Weekly Property BroadcastSVN Live 5.6.24 Weekly Property Broadcast
SVN Live 5.6.24 Weekly Property Broadcast
 
Kohinoor Teiko Hinjewadi Phase 2 Pune E-Brochure.pdf
Kohinoor Teiko Hinjewadi Phase 2 Pune  E-Brochure.pdfKohinoor Teiko Hinjewadi Phase 2 Pune  E-Brochure.pdf
Kohinoor Teiko Hinjewadi Phase 2 Pune E-Brochure.pdf
 
9990771857 Call Girls Dwarka Sector 9 Delhi (Call Girls ) Delhi
9990771857 Call Girls Dwarka Sector 9 Delhi (Call Girls ) Delhi9990771857 Call Girls Dwarka Sector 9 Delhi (Call Girls ) Delhi
9990771857 Call Girls Dwarka Sector 9 Delhi (Call Girls ) Delhi
 

JLL Pittsburgh Industrial Insight & Statistics - Q3 2016

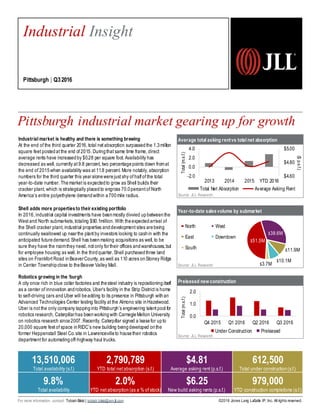
  • 1. Average total asking rentvs total net absorption Source: JLL Research Year-to-date salesvolume by submarket Source: JLL Research Preleased new construction Source: JLL Research Industrial market is healthy and there is something brewing At the end of the third quarter 2016, total net absorption surpassed the 1.3million square feet postedat the end of 2015. Duringthat same time frame, direct average rents have increasedby $0.28 per square foot. Availability has decreased as well, currently at 9.8 percent, two percentagepoints down fromat the end of 2015when availability was at 11.8 percent. More notably, absorption numbers for the third quarter this yearalonewerejust shy of half of the total year-to-date number. Themarket is expectedto grow as Shell builds their cracker plant, which is strategically placedto engross 70.0percent of North America’s entire polyethylene demandwithin a700mile radius. Shell adds more propertiesto their existing portfolio In 2016, industrial capital investments have beenmostly divvied upbetweenthe West and North submarkets, totaling $90.1million. With theexpectedarrival of the Shell cracker plant, industrial properties anddevelopment sites arebeing continually swallowed up nearthe plant by investors looking to cashin with the anticipated futuredemand. Shell has beenmaking acquisitions as well, to be sure they have the roomthey need, not only fortheir offices andwarehouses, but for employee housing as well. In the thirdquarter, Shell purchasedthree land sites on Frankfort Road inBeaverCounty, as well as 110 acres onStoney Ridge in Center Townshipclose to theBeaver Valley Mall. Robotics growing in the ‘burgh A city once rich in blue collar factories and thesteel industry is repositioningitself as a center of innovation androbotics. Uber’s facility in the Strip District is home to self-driving cars and Uber will beadding to its presence in Pittsburgh withan Advanced Technologies Center testing facility at the Almono site inHazelwood. Uber is not the only company tappinginto Pittsburgh’s engineering talent pool for robotics research, Caterpillarhas beenworkingwith CarnegieMellon University on robotics research since2007. Recently, Caterpillar signed a leasefor upto 20,000 square feet of space inRIDC’s new building beingdeveloped onthe former Heppenstall Steel Co. site in Lawrencevilleto housetheir robotics department for automatingoff-highway haul trucks. Industrial Insight Pittsburgh | Q32016 13,510,006 Total availability (s.f.) 2,790,789 YTD total net absorption (s.f.) $4.81 Average asking rent (p.s.f.) 612,500 Total under construction(s.f.) 9.8% Total availability 2.0% YTD net absorption(as a % of stock) $6.25 New build asking rents (p.s.f.) 979,000 YTD construction completions (s.f.) ©2016 Jones Lang LaSalle IP, Inc. All rights reserved.For more information, contact: Tobiah Bilski | tobiah.bilski@am.jll.com 770,000 191,000 260,000 North West East Downtown South $3.7M $10.1M $11.9M $38.6M $51.5M 0.0 1.0 2.0 Q4 2015 Q1 2016 Q2 2016 Q3 2016 Under Construction Preleased $4.60 $4.80 $5.00 -2.0 0.0 2.0 4.0 2013 2014 2015 YTD 2016 Total Net Absorption Average Asking Rent Total(m.s.f.)Total(m.s.f.) ($p.s.f.) Pittsburgh industrial market gearing up for growth
  • 2. Industrial Statistics Pittsburgh | Q32016 ©2016 Jones Lang LaSalle IP, Inc. All rights reserved.For more information, contact: Tobiah Bilski | tobiah.bilski@am.jll.com Inventory (s.f.) Quarterly total net absorption (s.f.) YTD total net absorption (s.f.) YTD total net absorption (% of stock) Total availability (s.f.) Total availability (%) Average total asking rent ($ p.s.f.) Quarterly completions (s.f.) YTD completions (s.f.) Under construction (s.f.) Pittsburgh Totals Warehouse & Distribution 82,961,466 839,160 1,626,925 2.0% 9,505,629 11.5% $5.27 568,000 923,000 612,500 Manufacturing 54,930,448 417,828 1,163,864 2.1% 4,004,377 7.3% $3.72 56,000 56,000 0 Totals 137,891,914 1,256,988 2,790,789 2.0% 13,510,006 9.8% $4.81 624,000 979,000 612,500 Flex 20,633,880 -98,701 383,027 1.9% 2,733,279 13.2% $9.99 0 54,000 68,000 Beaver County Warehouse & Distribution 4,526,997 219,563 283,532 6.3% 700,816 15.5% $5.39 0 0 0 Manufacturing 4,517,893 0 38,000 0.8% 157,200 3.5% $2.65 0 0 0 Totals 9,044,890 219,563 321,532 3.6% 858,016 9.5% $4.89 0 0 0 Flex 579,085 -5,025 9,739 1.7% 107,596 18.6% $10.00 0 0 0 Butler County Warehouse & Distribution 3,615,353 -10,492 -30,225 -0.8% 283,537 7.8% $7.68 0 305,000 135,000 Manufacturing 3,588,175 43,000 71,500 2.0% 419,289 11.7% $1.20 56,000 56,000 0 Totals 7,203,528 32,508 41,275 0.6% 702,826 9.8% $3.81 56,000 361,000 135,000 Flex 386,900 0 0 0.0% 11,000 2.8% $10.00 0 0 0 Downtown Warehouse & Distribution 18,444,302 -35,468 11,048 0.1% 1,396,636 7.6% $5.25 0 0 0 Manufacturing 4,823,443 26,573 263,096 5.5% 120,577 2.5% $7.15 0 0 0 Totals 23,267,745 -8,895 274,144 1.2% 1,517,213 6.5% $5.40 0 0 0 Flex 3,047,812 -46,848 55,182 1.8% 381,129 12.5% $8.10 0 0 0 East Warehouse & Distribution 6,565,485 -7,272 14,679 0.2% 641,705 9.8% $5.14 0 0 0 Manufacturing 4,594,489 35,199 9,981 0.2% 370,926 8.1% $4.00 0 0 0 Totals 11,159,974 27,927 24,660 0.2% 1,012,631 9.1% $4.72 0 0 0 Flex 2,858,912 15,375 195,831 6.8% 639,572 22.4% $10.50 0 0 0 Northeast Warehouse & Distribution 6,291,992 30,740 99,792 1.6% 320,511 5.1% $5.15 0 0 0 Manufacturing 6,408,774 -29,790 157,310 2.5% 123,536 1.9% $5.75 0 0 0 Totals 12,700,766 950 257,102 2.0% 444,047 3.5% $5.32 0 0 0 Flex 3,006,818 -7,650 50,449 1.7% 283,938 9.4% $10.75 0 0 0 Northwest Warehouse & Distribution 10,204,144 78,700 339,301 3.3% 1,105,103 10.8% $5.96 0 0 0 Manufacturing 3,479,451 0 58,300 1.7% 40,040 1.2% $4.00 0 0 0 Totals 13,683,595 78,700 397,601 2.9% 1,145,143 8.4% $5.89 0 0 0 Flex 2,109,466 9,049 19,018 0.9% 174,200 8.3% $12.27 0 0 0 South Warehouse & Distribution 5,381,206 -48,760 -96,359 -1.8% 541,600 10.1% $3.35 0 0 0 Manufacturing 8,033,856 -86,114 -81,114 -1.0% 177,782 2.2% $6.75 0 0 0 Totals 13,415,062 -134,874 -177,473 -1.3% 719,382 5.4% $4.19 0 0 0 Flex 1,634,737 -14,600 28,510 1.7% 108,564 6.6% $11.66 0 0 0 Washington County Warehouse & Distribution 5,449,811 3,827 285,230 5.2% 1,927,313 35.4% $4.75 0 0 0 Manufacturing 4,716,380 0 147,025 3.1% 230,350 4.9% $4.95 0 0 0 Totals 10,166,191 3,827 432,255 4.3% 2,157,663 21.2% $4.77 0 0 0 Flex 1,404,532 -56,750 -105,861 -7.5% 303,709 21.6% $9.00 0 0 0 West Warehouse & Distribution 10,468,325 581,522 525,090 5.0% 1,204,671 11.5% $6.34 568,000 568,000 180,000 Manufacturing 2,760,269 0 4,172 0.2% 159,916 5.8% $5.00 0 0 0 Totals 13,228,594 581,522 529,262 4.0% 1,364,587 10.3% $6.18 568,000 568,000 180,000 Flex 3,192,163 9,244 55,731 1.7% 465,322 14.6% $12.59 0 54,000 68,000 Westmoreland County Warehouse & Distribution 12,061,179 24,940 191,427 1.6% 1,467,947 12.2% $4.40 0 50,000 297,500 Manufacturing 12,959,110 428,960 495,594 3.8% 2,286,651 17.6% $3.68 0 0 0 Totals 25,020,289 453,900 687,021 2.7% 3,754,598 15.0% $4.81 0 50,000 297,500 Flex 2,413,455 -1,496 74,428 3.1% 258,249 10.7% $4.77 0 0 0