Downloaded 598 times
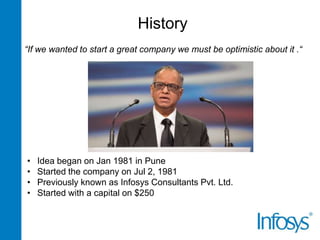
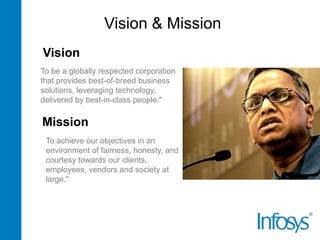
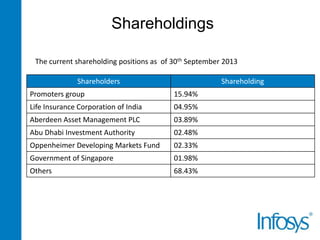
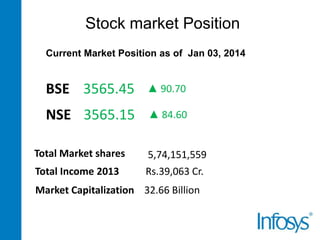
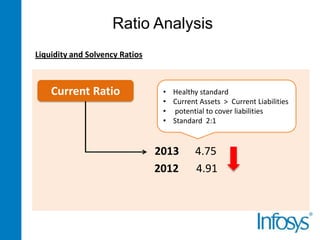
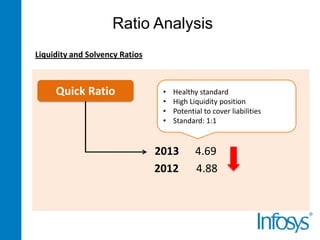
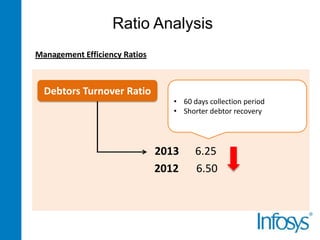
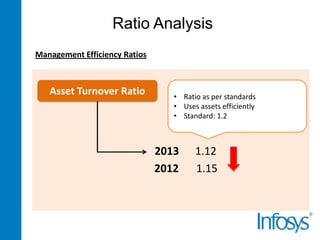
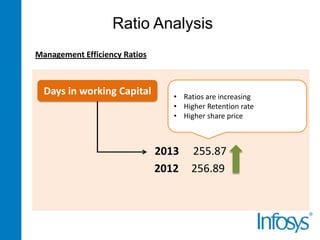
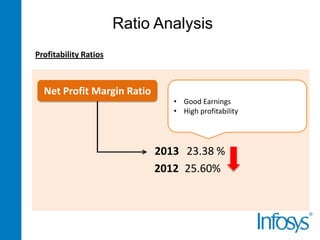

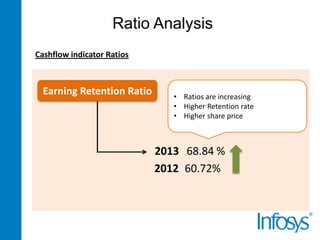
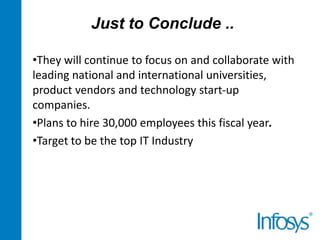


The financial analysis presentation outlines the history, vision, and current financial position of a company formerly known as Infosys Consultants Pvt. Ltd., established in 1981. It provides a detailed overview of shareholdings, market positions, liquidity ratios, management efficiency metrics, and profitability ratios as of 2013, including plans for growth such as hiring 30,000 employees. The company aims to maintain ethical corporate leadership and continue collaborations to enhance its standing in the IT industry.


