Wix.com Ltd (WIX) Stock Analysis
•
0 likes•38 views

The document provides a detailed stock report on Wix.com Ltd (WIX) dated May 18th, 2022. It summarizes the company's financial performance, metrics, and ratios compared to its sector and exchange. Analyst ratings and recommendations are also presented. The stock is given an overall bearish fundamental analysis score of 2.9 out of 10 based on factors like high volatility, low earnings growth, and being overpriced relative to peers.

Recommended
More Related Content
Similar to Wix.com Ltd (WIX) Stock Analysis
Similar to Wix.com Ltd (WIX) Stock Analysis (20)
More from Stock Target Advisor
More from Stock Target Advisor (20)
Recently uploaded
Recently uploaded (20)
Wix.com Ltd (WIX) Stock Analysis
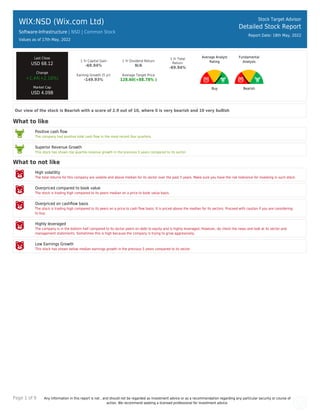
- 1. Page 1 of 9 Any information in this report is not , and should not be regarded as investment advice or as a recommendation regarding any particular security or course of action. We recommend seeking a licensed professional for investment advice. WIX:NSD (Wix.com Ltd) Software-Infrastructure | NSD | Common Stock Values as of 17th May, 2022 Stock Target Advisor Detailed Stock Report Report Date: 18th May, 2022 Last Close USD 68.12 Change +1.44(+2.16%) Market Cap USD 4.09B 1 Yr Capital Gain -69.94% 1 Yr Dividend Return N/A 1 Yr Total Return -69.94% Earning Growth (5 yr) -149.93% Average Target Price 128.60(+88.78% ) Average Analyst Rating Buy Fundamental Analysis Bearish Our view of the stock is Bearish with a score of 2.9 out of 10, where 0 is very bearish and 10 very bullish What to like Positive cash flow The company had positive total cash flow in the most recent four quarters. Superior Revenue Growth This stock has shown top quartile revenue growth in the previous 5 years compared to its sector. What to not like High volatility The total returns for this company are volatile and above median for its sector over the past 5 years. Make sure you have the risk tolerance for investing in such stock. Overpriced compared to book value The stock is trading high compared to its peers median on a price to book value basis. Overpriced on cashflow basis The stock is trading high compared to its peers on a price to cash flow basis. It is priced above the median for its sectors. Proceed with caution if you are considering to buy. Highly leveraged The company is in the bottom half compared to its sector peers on debt to equity and is highly leveraged. However, do check the news and look at its sector and management statements. Sometimes this is high because the company is trying to grow aggressively. Low Earnings Growth This stock has shown below median earnings growth in the previous 5 years compared to its sector
- 2. Page 2 of 9 Any information in this report is not , and should not be regarded as investment advice or as a recommendation regarding any particular security or course of action. We recommend seeking a licensed professional for investment advice. WIX:NSD (Wix.com Ltd) Software-Infrastructure | | Common Stock Stock Target Advisor Detailed Stock Report Report Date: 18th May, 2022 Adjusted Closing Share Volume Relative Returns Relative Performance (Total Returns) Security Capital Gain Dividend Return Total Return WIX Wix.com Ltd -69.7% 0 -69.7% QQQ Invesco QQQ Trust Series 1 -5.6% +0.4% -5.2% Company Overview Wix.com Ltd., together with its subsidiaries, develops and markets a cloud-based platform that enables anyone to create a website or web application in North America, Europe, Latin America, Asia, and internationally. The company offers Wix Editor, a drag-and-drop visual development and website editing environment platform; Wix ADI that enables users to create a website for their specific needs; and Corvid by Wix to create websites and web applications. It also provides Ascend by Wix, which offers its users access to a suite of approximately 20 products or features enabling them to connect with their customers, automate their work, and grow their business; Wix Logo Maker that allows users to generate a logo using artificial intelligence; Wix Answers, a support infrastructure enabling its users to help their users across various channels; and Wix Payments, a payment platform, which helps its users receive payments from their users through their Wix Website. In addition, the company offers various vertical-specific applications that business owners use to operate various aspects of their business online. Further, it provides a range of complementary services, including App Market that offers its registered users the ability to install and uninstall a range of free and paid web applications; Wix Arena, an online marketplace that brings users seeking help in creating and managing a website, together with Web experts; and Wix App, a native mobile application, which enables users to manage their Websites and Wix operating systems. As of December 31, 2021, the company had approximately 222 million registered users and 6 million premium subscriptions. The company was formerly known as Wixpress Ltd. Wix.com Ltd. was incorporated in 2006 and is headquartered in Tel Aviv, Israel.
- 3. Page 3 of 9 Any information in this report is not , and should not be regarded as investment advice or as a recommendation regarding any particular security or course of action. We recommend seeking a licensed professional for investment advice. Company Website https://www.wix.com Address 40 Namal Tel Aviv Street, Tel Aviv, Israel, 6350671 Fiscal Year End December Employees 4789 Technical Indicators Value Value Beta 1.44 52 Week High 309.00 Short Ratio 3.64 52 Week Low 56.24 Shorted Shares 3,470,399 200 Day Moving Average 151.74 Shorted Shares Previous Month 2,398,629 50 Day Moving Average 85.63 Shares Held By Insiders 339.40% Short Percentage 7.00% Shares Held by Institutions 87.75 Dividend Yield N/A
- 4. Page 4 of 9 Any information in this report is not , and should not be regarded as investment advice or as a recommendation regarding any particular security or course of action. We recommend seeking a licensed professional for investment advice. WIX:NSD (Wix.com Ltd) Software-Infrastructure | | Common Stock Stock Target Advisor Detailed Stock Report Report Date: 18th May, 2022 Market Performance Market Performance vs. Industry / Classification (Software-Infrastructure) Market Performance vs. Exchange (Nasdaq Global Select) Value Sector Median Percentile Rank Grade Market Median Percentile Rank Grade YTD Capital Gain -56.83% -31.8% 20% -18.6% 17% Dividend Return N/A 0.5% N/A 0.8% N/A Total Return -56.83% -31.8% 20% -18.2% 17% Trailing 12 Months Capital Gain -69.94% -22.7% 16% -18.6% 19% Dividend Return N/A 1.9% N/A 2.3% N/A Total Return -69.94% -22.7% 16% -16.7% 19% Trailing 5 Years Capital Gain -7.70% 37.9% 28% 7.2% 39% Dividend Return N/A 12.3% N/A 11.2% N/A Total Return -7.70% 40.7% 28% 18.1% 33% Average Annual (5 Year Horizon) Capital Gain 39.25% 19.5% 74% 3.1% 85% Dividend Return N/A 2.2% N/A 1.8% N/A Total Return 39.25% 19.5% 73% 5.1% 85% Risk Return Profile Volatility (Standard Deviation) 57.14% 39.7% 30% 32.3% 26% Risk Adjusted Return 68.68% N/A 70% 21.8% 89% Market Capitalization 4.09B 1.38B 65% 0.36B 87%
- 5. Page 5 of 9 Any information in this report is not , and should not be regarded as investment advice or as a recommendation regarding any particular security or course of action. We recommend seeking a licensed professional for investment advice. Key Financial Ratios Ratios vs. Industry / Classification (Computer Hardware) Ratios vs. Exchange (Nasdaq Global Select) Value Sector Median Percentile Rank Grade Market Median Percentile Rank Grade Market Value peratio N/A 40.0 N/A 16.0 N/A pbratio 23.0 4.6 16% 1.6 3% pcfratio 62.3 14.4 17% 0.0 4% pfcfratio N/A 25.1 N/A 9.9 N/A Management Effectiveness retequity -54.15% -11.4% 23% 0.8% 22% retinvcap -35.35% -4.7% 23% -0.4% 26% retass -10.29% -3.1% 32% 0.4% 30% debtequityratio 633.41% 49.1% 4% 32.3% 4% Technical Ratios yield N/A 1.8% N/A 3.7% N/A sratio 3.64 4.44 60% 3.09 44% spercent 6.23% 3.7% 33% 2.9% 28% beta 1.44 1.05 25% 1.08 28%
- 6. Page 6 of 9 Any information in this report is not , and should not be regarded as investment advice or as a recommendation regarding any particular security or course of action. We recommend seeking a licensed professional for investment advice. WIX:NSD (Wix.com Ltd) Software-Infrastructure | | Common Stock Stock Target Advisor Detailed Stock Report Report Date: 18th May, 2022 Recent Analyst Ratings Price Action Rating Action Analyst Rating Price date Target Down RBC Royalbank NA USD 75 2022-05-17 Assigns STA Research Buy USD 80 2022-05-17 Target Down Evercore ISI NA USD 105 2022-05-17 Target Down Citigroup NA USD 91 2022-05-17 Target Down Needham & Company LLC Buy USD 85 2022-05-17 Downgraded by Piper Sandler Neutral » Underweight USD 105 » USD 78 2022-04-25 Initiated by Benchmark Hold 2022-04-14 Downgraded by Atlantic Securities Overweight » Neutral USD 100 2022-03-01 Target Lowered by Morgan Stanley Overweight USD 215 » USD 135 2022-02-17 Maintains JMP Securities Market Outperform USD 250 » USD 140 2022-02-17 Target Lowered by Truist Securities Buy USD 290 » USD 170 2022-02-17 Target Lowered by Wolfe Research Outperform USD 200 » USD 150 2022-02-17 Target Lowered by Bank of America Securities Buy USD 320 » USD 200 2022-02-17 Target Lowered by Barclays USD 170 » USD 105 2022-02-17 Maintains Needham & Company LLC Buy USD 175 » USD 125 2022-02-17 Maintains RBC Royalbank Sector Perform USD 200 » USD 85 2022-02-17 Maintains Piper Sandler Neutral USD 156 » USD 105 2022-02-17 Downgraded by Guggenheim Securities Buy » Neutral 2022-02-16 Target Lowered by Wedbush USD 200 » USD 162 2022-02-14 Maintains Needham & Company LLC Buy USD 250 » USD 175 2022-02-01 Maintains Piper Sandler Neutral USD 218 » USD 156 2022-01-12 Target Lowered by JMP Securities Outperform USD 282 » USD 250 2021-11-22 Target Lowered by Oppenheimer Holdings Outperform USD 275 » USD 250 2021-11-15 Maintains Piper Sandler Neutral USD 252 » USD 218 2021-11-12 Maintains Needham & Company LLC Buy USD 265 » USD 250 2021-11-12
- 7. Page 7 of 9 Any information in this report is not , and should not be regarded as investment advice or as a recommendation regarding any particular security or course of action. We recommend seeking a licensed professional for investment advice. WIX:NSD (Wix.com Ltd) Software-Infrastructure | | Common Stock Stock Target Advisor Detailed Stock Report Report Date: 18th May, 2022 Annual Financial (USD)
- 8. Page 8 of 9 Any information in this report is not , and should not be regarded as investment advice or as a recommendation regarding any particular security or course of action. We recommend seeking a licensed professional for investment advice. WIX:NSD (Wix.com Ltd) Software-Infrastructure | | Common Stock Stock Target Advisor Detailed Stock Report Report Date: 18th May, 2022 Quarterly Financial (USD)
- 9. Page 9 of 9 Any information in this report is not , and should not be regarded as investment advice or as a recommendation regarding any particular security or course of action. We recommend seeking a licensed professional for investment advice. WIX:NSD (Wix.com Ltd) Software-Infrastructure | | Common Stock Stock Target Advisor Detailed Stock Report Report Date: 18th May, 2022 Largest Industry Peers for Software-Infrastructure Symbol Company Name Price(Change) Market Cap MSFT Microsoft Corporation +5.32 (+2.0%) USD 1,909.77B ADBE Adobe Inc +6.79 (+1.7%) USD 190.35B PANW Palo Alto Networks Inc. Common.. +5.09 (+1.1%) USD 48.36B FTNT Fortinet Inc +7.24 (+2.6%) USD 42.81B SNPS Synopsys Inc +9.08 (+3.3%) USD 42.25B CRWD CrowdStrike Holdings Inc +0.88 (+0.6%) USD 36.26B ZS Zscaler Inc +1.70 (+1.2%) USD 21.62B VRSN VeriSign Inc +3.97 (+2.4%) USD 18.09B MDB MongoDB Inc -4.72 (-1.9%) USD 17.03B SPLK Splunk Inc +1.35 (+1.4%) USD 16.38B ETFs Containing WIX Symbol Company Name Weight Mer Price(Change) Market Cap DBES 0.00 % 0.45 % N/A N/A ISRHF iShares V Public Limited Compa.. 0.00 % 0.00 % +0.16 (+0.0%) N/A ISRNF iShares V Public Limited Compa.. 0.00 % 0.00 % N/A N/A ISRWF iShares II Public Limited Comp.. 0.00 % 0.00 % N/A N/A ISRVF iShares Public Limited Company.. 0.00 % 0.00 % N/A N/A ISRIF iShares IV Public Limited Comp.. 0.00 % 0.00 % N/A N/A ISRZF iShares II Public Limited Comp.. 0.00 % 0.00 % +0.22 (+0.0%) N/A ISRUF iShares V Public Limited Compa.. 0.00 % 0.00 % +0.20 (+0.0%) N/A ISRCF iShares V Public Limited Compa.. 0.00 % 0.00 % +0.55 (+0.0%) N/A EIS iShares MSCI Israel ETF 0.00 % 0.59 % +2.26 (+0.0%) USD 0.16B The Stock Target Advisor platform run millions of calculations every day on over 30,000 Canadian and American stocks, comparing and ranking their financial and market performance against their sectors and exchange. We represent the percentile ranking using the following grading system. Letter Grade Percentage Letter Grade Percentage Letter Grade Percentage A+ 97%-100% A 93%-96% A- 90%-92% B+ 97%-89% B 83%-86% B- 80%-82% C+ 77%-79% C 73%-76% C- 70%-72% D+ 67%-69% D 63%-66% D- 60%-62% F 0%-59%