SlideShare a Scribd company logo
1 of 10
Download to read offline
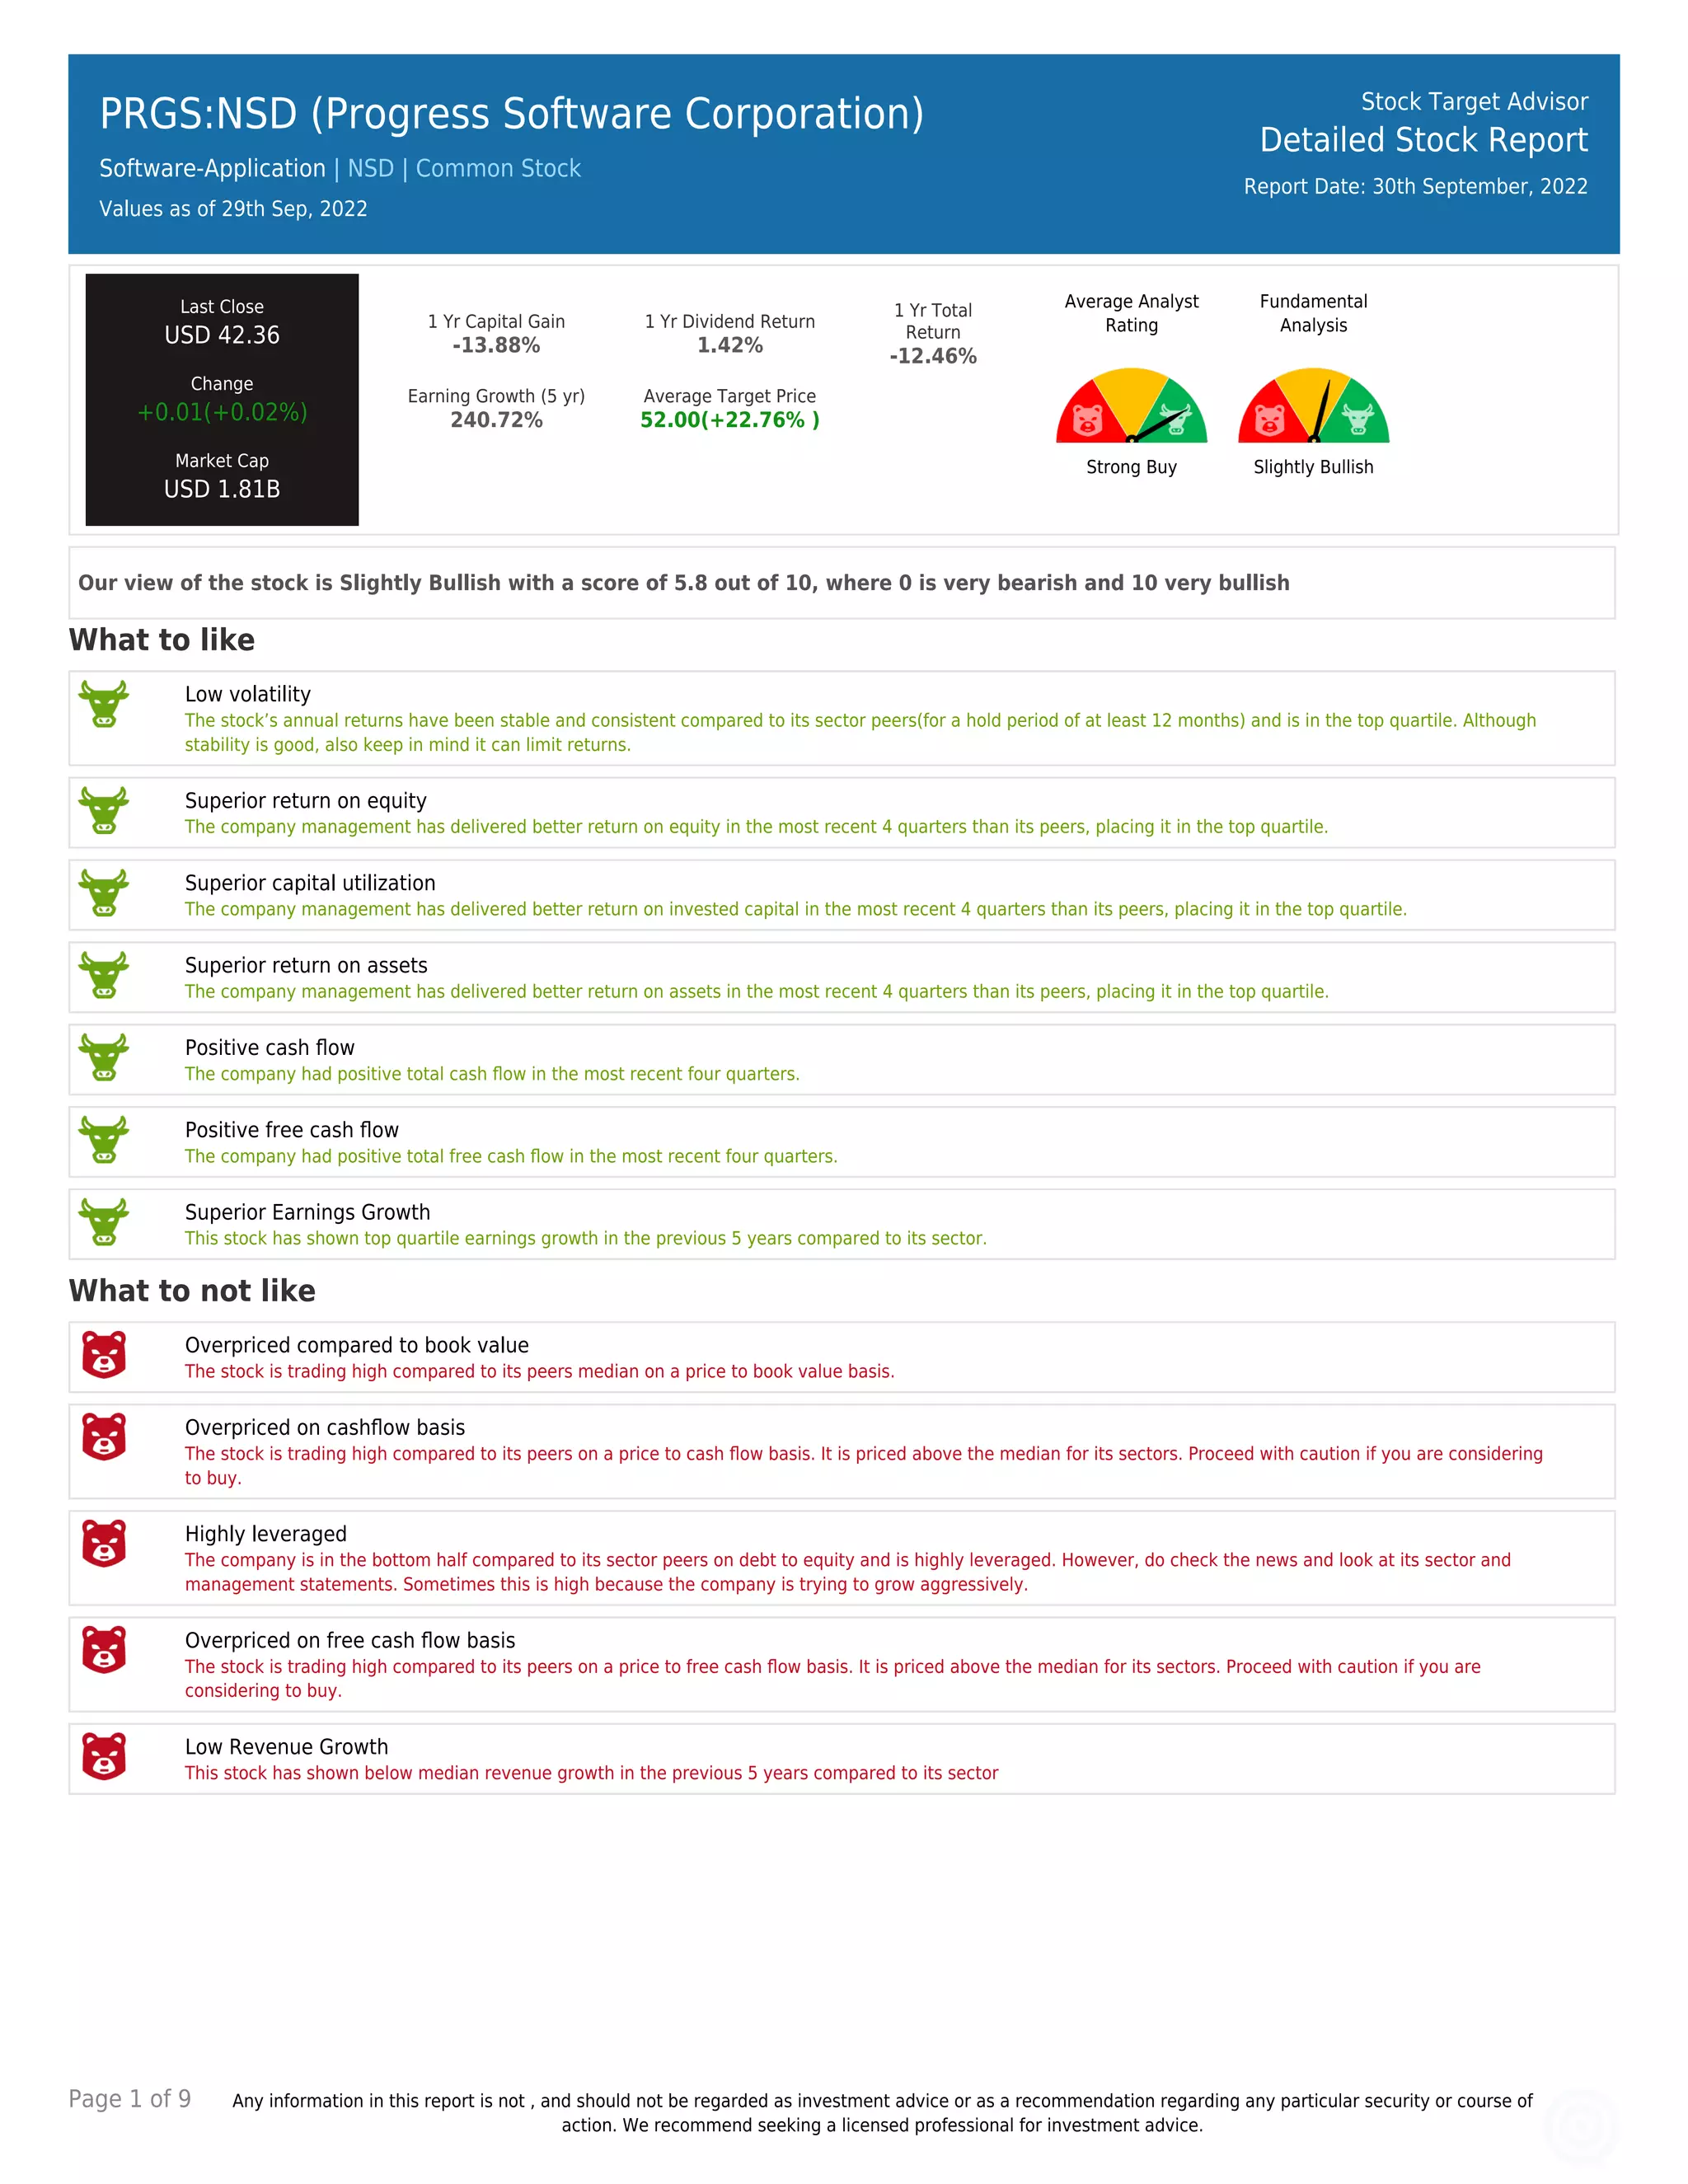
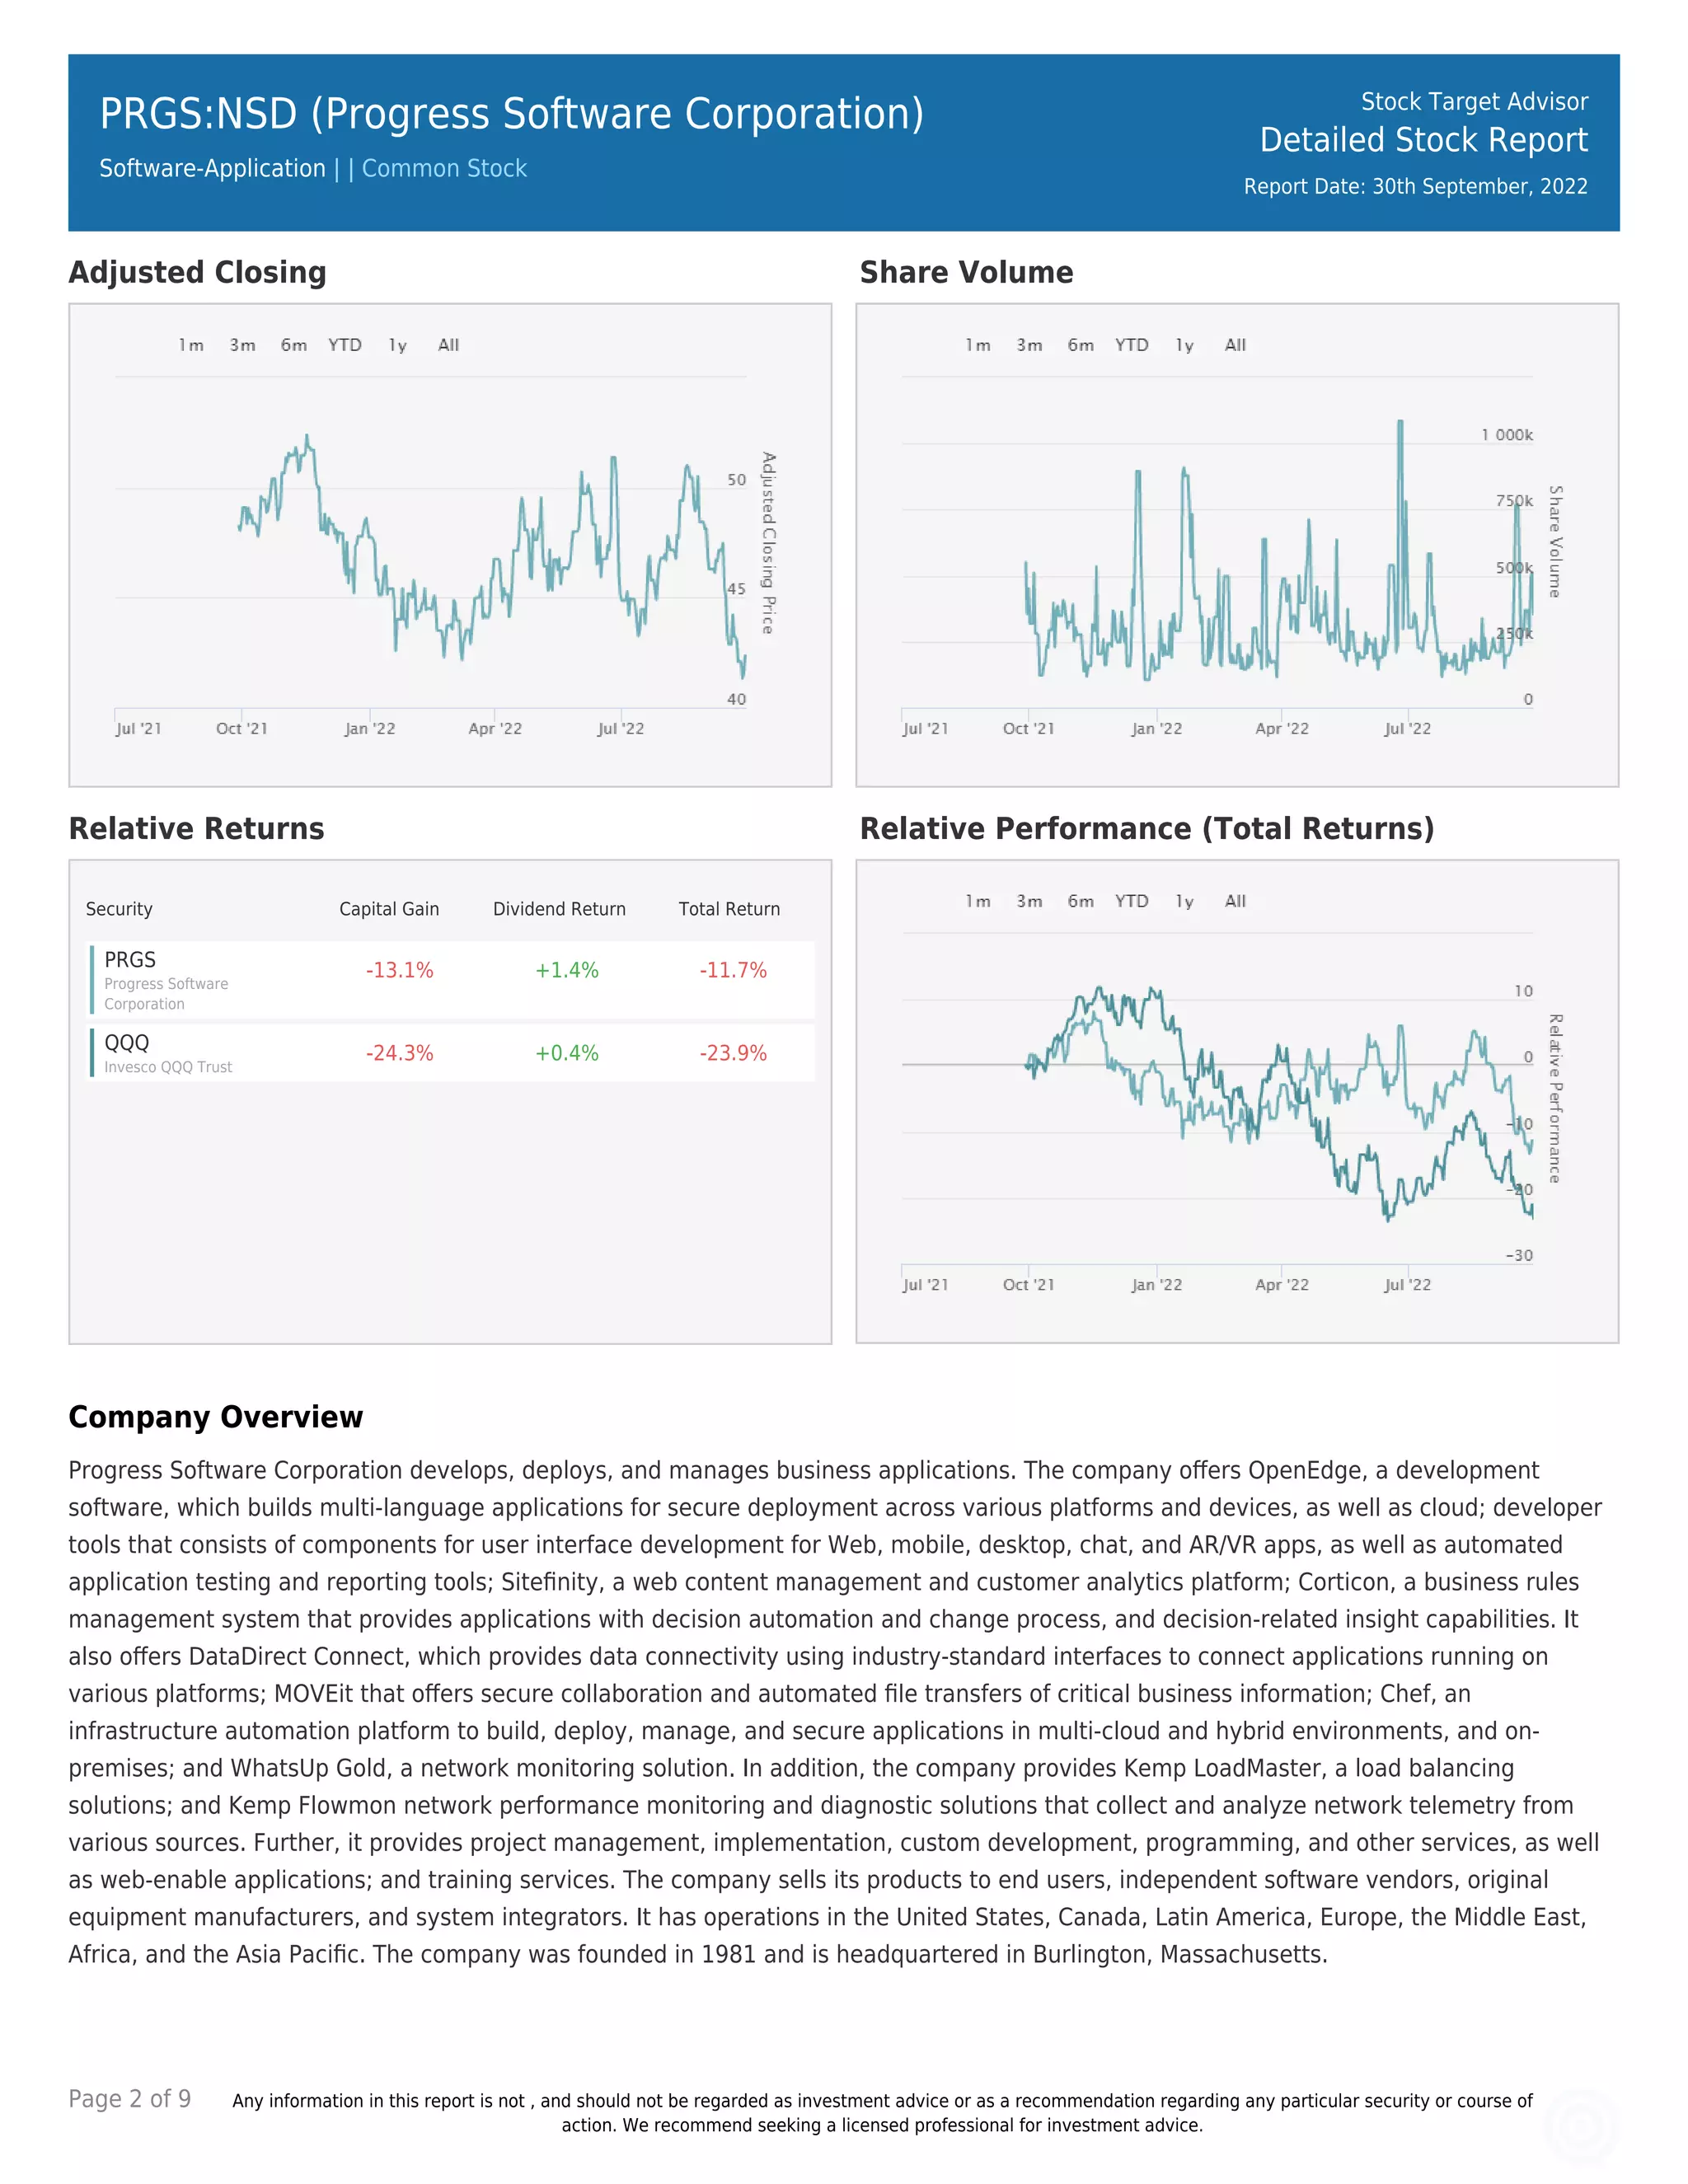
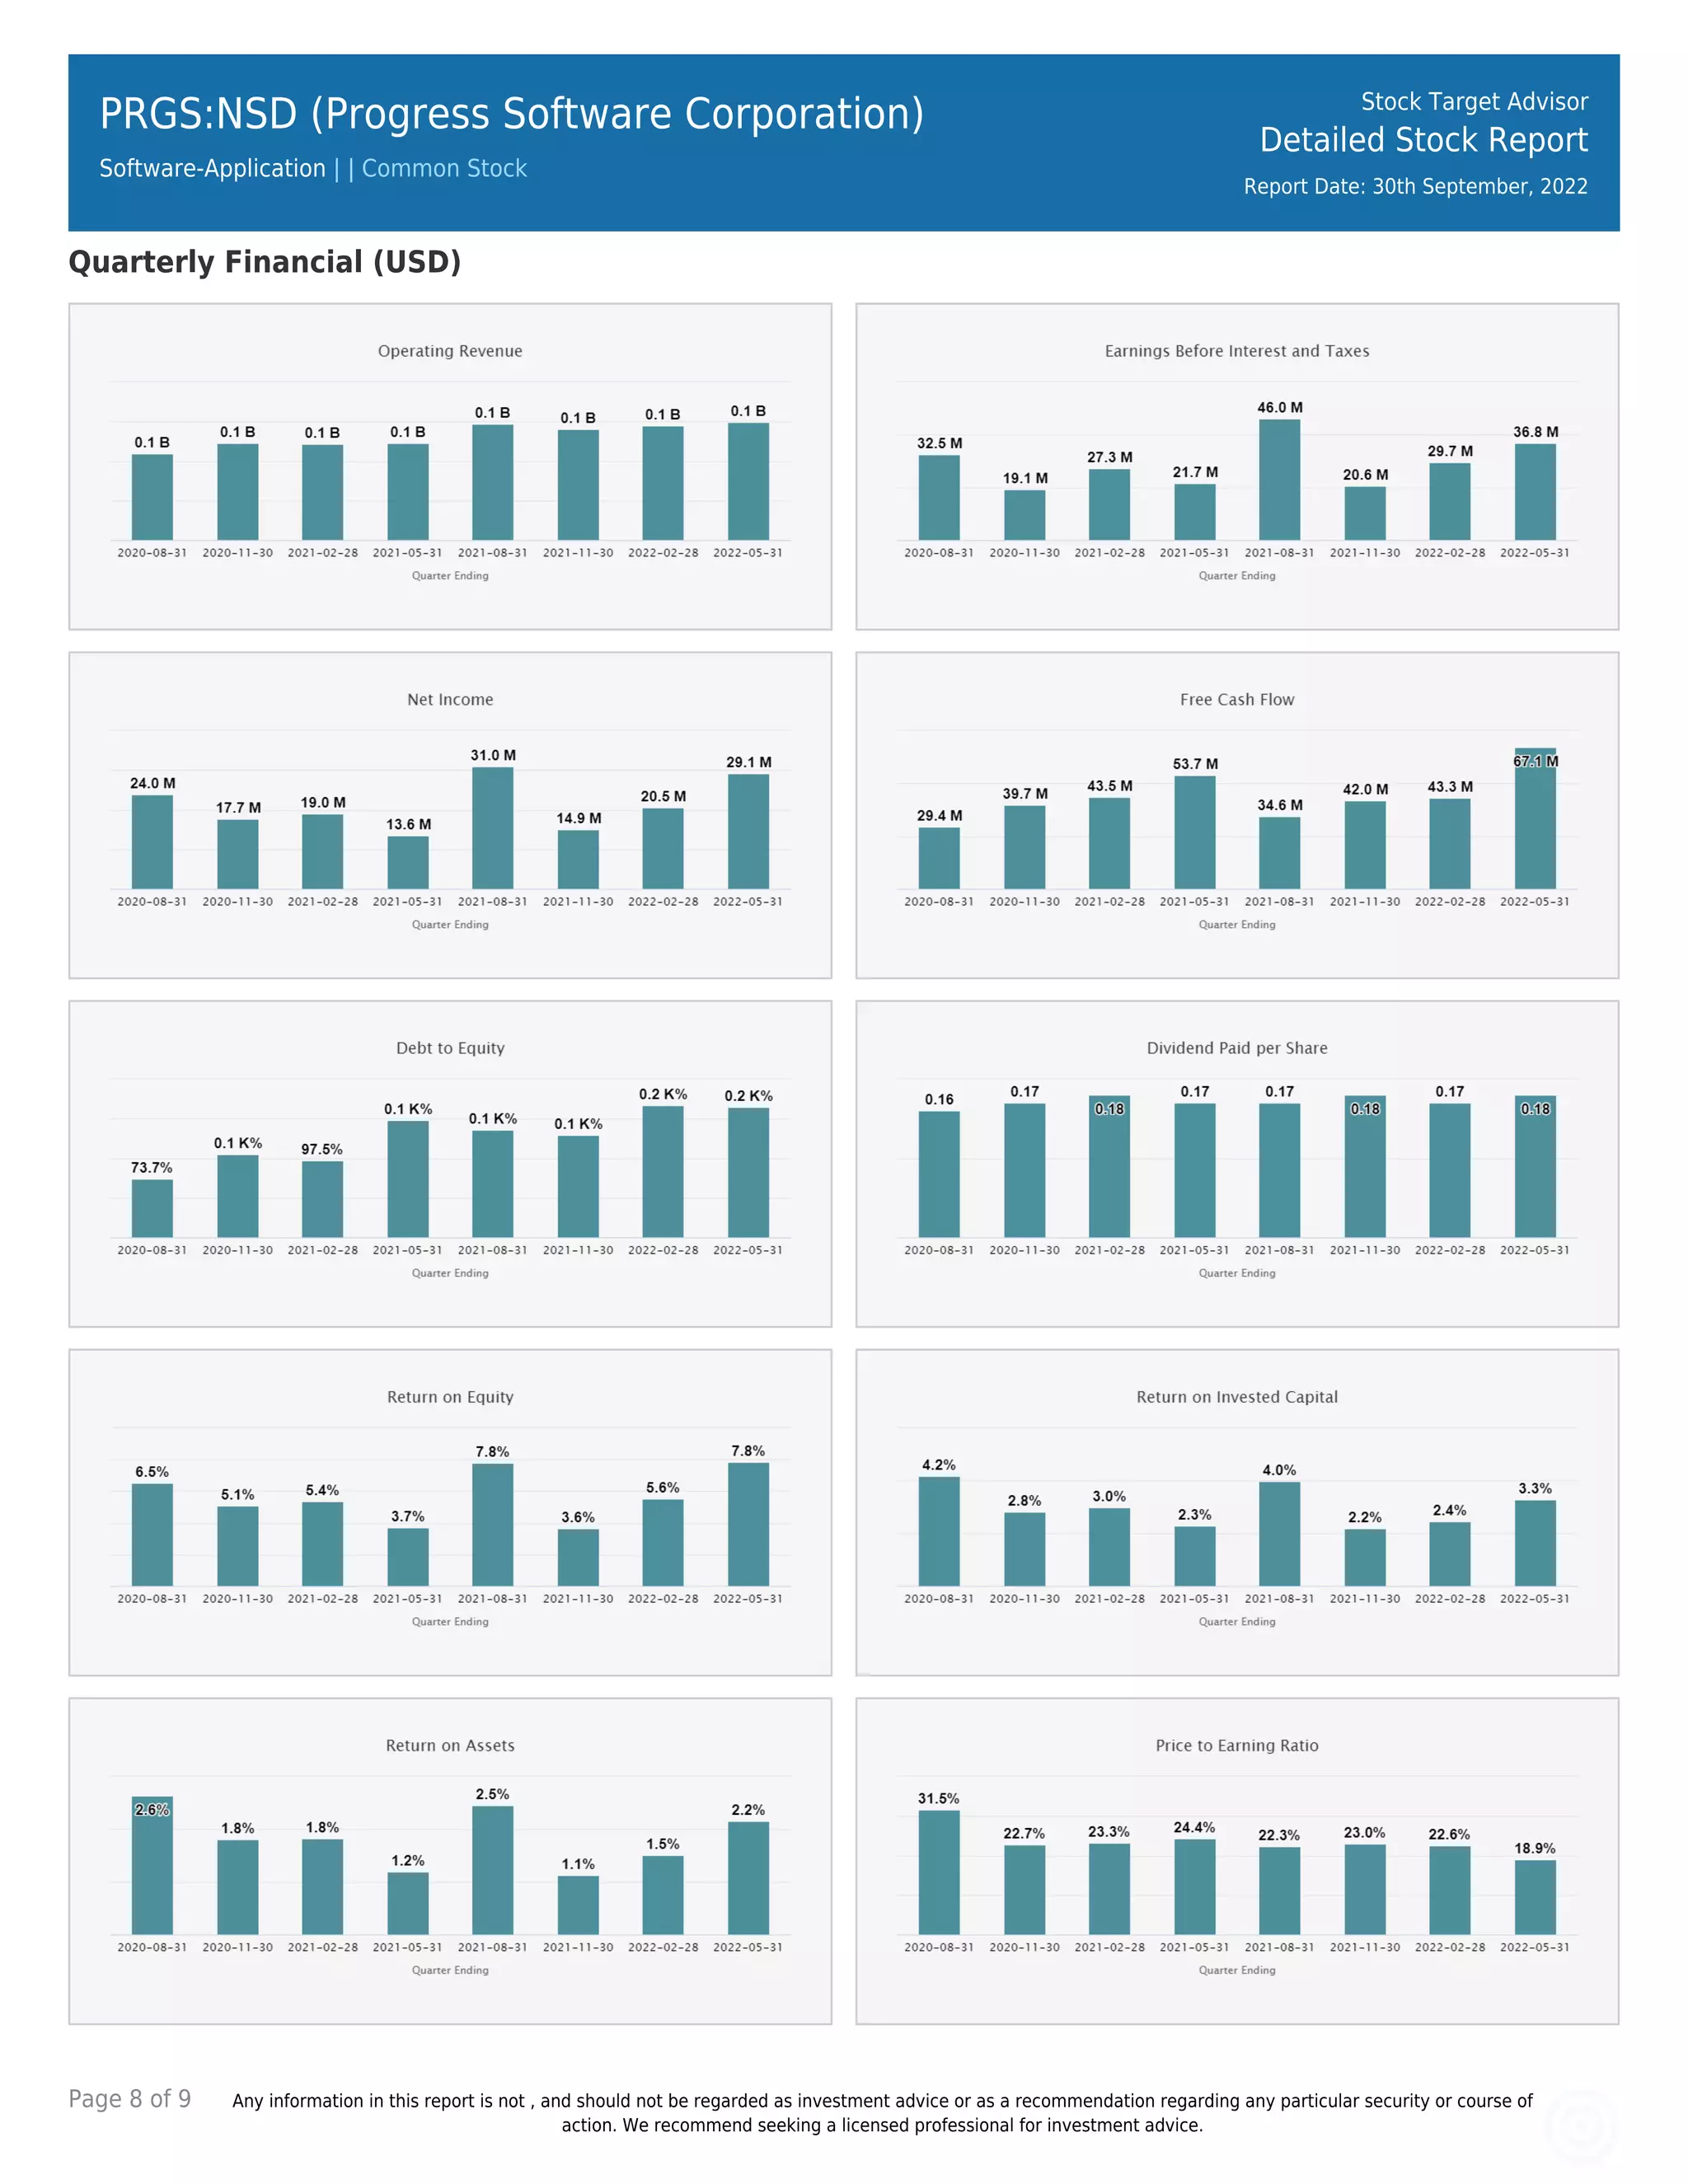
Page 1 of 9 Any information in this report is not , and should not be regarded as investment advice or as a recommendation regarding any particular security or course of
action. We recommend seeking a licensed professional for investment advice.
PRGS:NSD (Progress Software Corporation)
Software-Application | NSD | Common Stock
Values as of 29th Sep, 2022
Stock Target Advisor
Detailed Stock Report
Report Date: 30th September, 2022
Last Close
USD 42.36
Change
+0.01(+0.02%)
Market Cap
USD 1.81B
1 Yr Capital Gain
-13.88%
1 Yr Dividend Return
1.42%
1 Yr Total
Return
-12.46%
Earning Growth (5 yr)
240.72%
Average Target Price
52.00(+22.76% )
Average Analyst
Rating
Strong Buy
Fundamental
Analysis
Slightly Bullish
Our view of the stock is Slightly Bullish with a score of 5.8 out of 10, where 0 is very bearish and 10 very bullish
What to like
Low volatility
The stock’s annual returns have been stable and consistent compared to its sector peers(for a hold period of at least 12 months) and is in the top quartile. Although
stability is good, also keep in mind it can limit returns.
Superior return on equity
The company management has delivered better return on equity in the most recent 4 quarters than its peers, placing it in the top quartile.
Superior capital utilization
The company management has delivered better return on invested capital in the most recent 4 quarters than its peers, placing it in the top quartile.
Superior return on assets
The company management has delivered better return on assets in the most recent 4 quarters than its peers, placing it in the top quartile.
Positive cash flow
The company had positive total cash flow in the most recent four quarters.
Positive free cash flow
The company had positive total free cash flow in the most recent four quarters.
Superior Earnings Growth
This stock has shown top quartile earnings growth in the previous 5 years compared to its sector.
What to not like
Overpriced compared to book value
The stock is trading high compared to its peers median on a price to book value basis.
Overpriced on cashflow basis
The stock is trading high compared to its peers on a price to cash flow basis. It is priced above the median for its sectors. Proceed with caution if you are considering
to buy.
Highly leveraged
The company is in the bottom half compared to its sector peers on debt to equity and is highly leveraged. However, do check the news and look at its sector and
management statements. Sometimes this is high because the company is trying to grow aggressively.
Overpriced on free cash flow basis
The stock is trading high compared to its peers on a price to free cash flow basis. It is priced above the median for its sectors. Proceed with caution if you are
considering to buy.
Low Revenue Growth
This stock has shown below median revenue growth in the previous 5 years compared to its sector
Page 2 of 9 Any information in this report is not , and should not be regarded as investment advice or as a recommendation regarding any particular security or course of
action. We recommend seeking a licensed professional for investment advice.
PRGS:NSD (Progress Software Corporation)
Software-Application | | Common Stock
Stock Target Advisor
Detailed Stock Report
Report Date: 30th September, 2022
Adjusted Closing Share Volume
Relative Returns Relative Performance (Total Returns)
Security Capital Gain Dividend Return Total Return
PRGS
Progress Software
Corporation
-13.1% +1.4% -11.7%
QQQ
Invesco QQQ Trust
-24.3% +0.4% -23.9%
Company Overview
Progress Software Corporation develops, deploys, and manages business applications. The company offers OpenEdge, a development
software, which builds multi-language applications for secure deployment across various platforms and devices, as well as cloud; developer
tools that consists of components for user interface development for Web, mobile, desktop, chat, and AR/VR apps, as well as automated
application testing and reporting tools; Sitefinity, a web content management and customer analytics platform; Corticon, a business rules
management system that provides applications with decision automation and change process, and decision-related insight capabilities. It
also offers DataDirect Connect, which provides data connectivity using industry-standard interfaces to connect applications running on
various platforms; MOVEit that offers secure collaboration and automated file transfers of critical business information; Chef, an
infrastructure automation platform to build, deploy, manage, and secure applications in multi-cloud and hybrid environments, and on-
premises; and WhatsUp Gold, a network monitoring solution. In addition, the company provides Kemp LoadMaster, a load balancing
solutions; and Kemp Flowmon network performance monitoring and diagnostic solutions that collect and analyze network telemetry from
various sources. Further, it provides project management, implementation, custom development, programming, and other services, as well
as web-enable applications; and training services. The company sells its products to end users, independent software vendors, original
equipment manufacturers, and system integrators. It has operations in the United States, Canada, Latin America, Europe, the Middle East,
Africa, and the Asia Pacific. The company was founded in 1981 and is headquartered in Burlington, Massachusetts.
Page 3 of 9 Any information in this report is not , and should not be regarded as investment advice or as a recommendation regarding any particular security or course of
action. We recommend seeking a licensed professional for investment advice.
Company Website
https://www.progress.com
Address
15 Wayside Road, Burlington, MA, United States, 01803
Fiscal Year End
November
Employees
2103
Technical Indicators
Value Value
Beta 1.00 52 Week High 53.20
Short Ratio 13.57 52 Week Low 40.33
Shorted Shares 2,635,573 200 Day Moving Average 46.44
Shorted Shares Previous Month 2,790,389 50 Day Moving Average 46.82
Shares Held By Insiders 160.70% Short Percentage 5.00%
Shares Held by Institutions 105.61 Dividend Yield 1.66%
Page 4 of 9 Any information in this report is not , and should not be regarded as investment advice or as a recommendation regarding any particular security or course of
action. We recommend seeking a licensed professional for investment advice.
PRGS:NSD (Progress Software Corporation)
Software-Application | | Common Stock
Stock Target Advisor
Detailed Stock Report
Report Date: 30th September, 2022
Market Performance
Market Performance vs. Industry / Classification (Software-Application) Market Performance vs. Exchange (Nasdaq Global Select)
Value Sector Median
Percentile
Rank
Grade Market Median Percentile Rank Grade
YTD
Capital Gain -12.24% -50.1% 89% -28.6% 67%
Dividend Return 1.09% 1.1% 50% 1.7% 32%
Total Return -11.16% -50.1% 89% -27.6% 67%
Trailing 12 Months
Capital Gain -13.88% -54.8% 88% -30.6% 66%
Dividend Return 1.42% 1.4% 53% 2.4% 30%
Total Return -12.46% -54.8% 90% -28.9% 65%
Trailing 5 Years
Capital Gain 10.98% 2.0% 51% -9.1% 63%
Dividend Return 8.49% 10.5% 36% 10.4% 37%
Total Return 19.47% 18.7% 51% 0.9% 62%
Average Annual (5 Year Horizon)
Capital Gain 4.96% 1.1% 53% 0.2% 63%
Dividend Return 1.62% 1.1% 61% 1.8% 45%
Total Return 6.58% 4.0% 54% 0.7% 63%
Risk Return Profile
Volatility (Standard
Deviation)
17.10% 38.7% 93% 33.4% 75%
Risk Adjusted Return 38.46% N/A 66% 10.9% 73%
Market Capitalization 1.81B 0.42B 71% 0.27B 83%
Page 5 of 9 Any information in this report is not , and should not be regarded as investment advice or as a recommendation regarding any particular security or course of
action. We recommend seeking a licensed professional for investment advice.
Key Financial Ratios
Ratios vs. Industry / Classification (Computer Hardware) Ratios vs. Exchange (Nasdaq Global Select)
Value Sector Median
Percentile
Rank
Grade Market Median Percentile Rank Grade
Market Value
peratio 19.4 32.1 63% 17.0 45%
pbratio 4.9 2.8 30% 1.4 16%
pcfratio 10.1 6.3 44% -1.3 21%
pfcfratio 11.1 0.0 26% -0.1 20%
Management Effectiveness
retequity 25.88% -18.5% 93% -7.9% 91%
retinvcap 11.64% -9.6% 84% -1.7% 79%
retass 6.63% -5.3% 91% -1.0% 88%
debtequityratio 129.59% 25.7% 23% 29.9% 17%
Technical Ratios
yield 1.66% 1.7% 47% 3.0% 28%
sratio 13.57 3.05 5% 2.66 6%
spercent 9.28% 3.1% 14% 2.4% 17%
beta 1.00 1.13 57% 1.06 55%
Page 6 of 9 Any information in this report is not , and should not be regarded as investment advice or as a recommendation regarding any particular security or course of
action. We recommend seeking a licensed professional for investment advice.
PRGS:NSD (Progress Software Corporation)
Software-Application | | Common Stock
Stock Target Advisor
Detailed Stock Report
Report Date: 30th September, 2022
Recent Analyst Ratings
Price Action Rating Action Analyst Rating Price date
Target Lowered by Citigroup USD 52 » USD 46 2022-09-29
Target Down Jefferies Financial LLC USD 45 2022-09-29
Target Down JP Morgan & Company USD 56 2022-09-29
Initiates Coverage On Jefferies Financial LLC Hold USD 52 2022-09-09
Initiated by Guggenheim Securities Buy USD 60 2022-08-12
Maintains Oppenheimer Holdings Outperform USD 60 » USD 53 2022-06-29
Target Raised by Citigroup USD 48 » USD 52 2022-03-30
Initiates Coverage On JP Morgan & Company Overweight USD 60 2021-10-22
Target Raised by Citigroup Neutral USD 48 » USD 50 2021-09-24
Target Raised by Oppenheimer Holdings Outperform USD 54 » USD 60 2021-09-24
Initiated by Citigroup Neutral USD 48 2021-08-06
Initiates Coverage On Oppenheimer Holdings Outperform USD 54 2021-07-15
Initiated by Guggenheim Securities Buy USD 56 2021-06-08
Maintains Wedbush Outperform USD 45 » USD 55 2021-01-15
Reiterated by Wedbush Outperform USD 45 2020-08-26
Target Raised by Benchmark Buy USD 39 » USD 43 2020-06-26
Target Lowered by Wedbush Outperform USD 58 » USD 42 2020-03-27
Reiterated by Benchmark Buy USD 49 » USD 57 2020-01-17
Initiates Sidoti & Co. Buy USD 53 2019-10-22
Upgrades Wedbush Neutral » Outperform USD 44 » USD 52 2019-07-26
Upgrades Benchmark Hold » Buy 2019-07-17
Upgrades Benchmark Buy USD 49 2019-07-17
Reiterates Wedbush Neutral USD 42 » USD 44 2019-07-02
Set Price Target National Securities Buy USD 50 2019-06-28
Reiterates Wedbush Neutral USD 36 » USD 42 2019-03-29
Page 7 of 9 Any information in this report is not , and should not be regarded as investment advice or as a recommendation regarding any particular security or course of
action. We recommend seeking a licensed professional for investment advice.
PRGS:NSD (Progress Software Corporation)
Software-Application | | Common Stock
Stock Target Advisor
Detailed Stock Report
Report Date: 30th September, 2022
Annual Financial (USD)
Page 8 of 9 Any information in this report is not , and should not be regarded as investment advice or as a recommendation regarding any particular security or course of
action. We recommend seeking a licensed professional for investment advice.
PRGS:NSD (Progress Software Corporation)
Software-Application | | Common Stock
Stock Target Advisor
Detailed Stock Report
Report Date: 30th September, 2022
Quarterly Financial (USD)
Page 9 of 9 Any information in this report is not , and should not be regarded as investment advice or as a recommendation regarding any particular security or course of
action. We recommend seeking a licensed professional for investment advice.
PRGS:NSD (Progress Software Corporation)
Software-Application | | Common Stock
Stock Target Advisor
Detailed Stock Report
Report Date: 30th September, 2022
Largest Industry Peers for Software-Application
Symbol Company Name Price(Change) Market Cap
INTU Intuit Inc -12.48 (-3.0%) USD 112.97B
TEAM Atlassian Corp Plc -5.81 (-2.7%) USD 55.27B
CDNS Cadence Design Systems Inc -2.28 (-1.4%) USD 44.68B
ADSK Autodesk Inc -1.52 (-0.8%) USD 41.22B
WDAY Workday Inc -0.59 (-0.4%) USD 40.15B
TTD Trade Desk Inc -2.16 (-3.4%) USD 30.62B
DDOG Datadog Inc -2.31 (-2.6%) USD 27.34B
ZM Zoom Video Communications Inc -1.42 (-1.9%) USD 22.16B
ANSS ANSYS Inc -4.66 (-2.0%) USD 20.22B
NUAN Nuance Communications Inc N/A USD 17.88B
ETFs Containing PRGS
Symbol Company Name Weight Mer Price(Change) Market Cap
WFH Direxion Work From Home ETF 0.00 % 0.00 % -0.87 (-2.0%) USD 0.05B
The Stock Target Advisor platform run millions of calculations every day on over 30,000 Canadian and American stocks, comparing and
ranking their financial and market performance against their sectors and exchange.
We represent the percentile ranking using the following grading system.
Letter Grade Percentage Letter Grade Percentage Letter Grade Percentage
A+ 97%-100% A 93%-96% A- 90%-92%
B+ 97%-89% B 83%-86% B- 80%-82%
C+ 77%-79% C 73%-76% C- 70%-72%
D+ 67%-69% D 63%-66% D- 60%-62%
F 0%-59%

More Related Content

Similar to Progress Software Corporation.pdf

Similar to Progress Software Corporation.pdf (20)

Salesforce.com.pdf
Salesforce.com.pdfSalesforce.com.pdf
Salesforce.com.pdf
 
Coupa Software Incorporated (COUP) Stock Analysis Report
Coupa Software Incorporated (COUP) Stock Analysis ReportCoupa Software Incorporated (COUP) Stock Analysis Report
Coupa Software Incorporated (COUP) Stock Analysis Report
 
Zoom Video Communications Inc.pdf
Zoom Video Communications Inc.pdfZoom Video Communications Inc.pdf
Zoom Video Communications Inc.pdf
 
Microsoft Corporation
Microsoft CorporationMicrosoft Corporation
Microsoft Corporation
 
Guidewire Software Inc (GWRE) Stock Analysis Report
Guidewire Software Inc (GWRE) Stock Analysis ReportGuidewire Software Inc (GWRE) Stock Analysis Report
Guidewire Software Inc (GWRE) Stock Analysis Report
 
NVIDIA Corporation (NVDA) Stock Analysis
 NVIDIA Corporation (NVDA) Stock Analysis NVIDIA Corporation (NVDA) Stock Analysis
NVIDIA Corporation (NVDA) Stock Analysis
 
Microsoft Corporation (MSFT) Stock Analysis Report
Microsoft Corporation (MSFT) Stock Analysis ReportMicrosoft Corporation (MSFT) Stock Analysis Report
Microsoft Corporation (MSFT) Stock Analysis Report
 
NIO Stock Forecast.pdf
NIO Stock Forecast.pdfNIO Stock Forecast.pdf
NIO Stock Forecast.pdf
 
NVDA Stock Forecast.pdf
NVDA Stock Forecast.pdfNVDA Stock Forecast.pdf
NVDA Stock Forecast.pdf
 
NVDA Corporation
NVDA CorporationNVDA Corporation
NVDA Corporation
 
Microsoft Corporation
Microsoft CorporationMicrosoft Corporation
Microsoft Corporation
 
Dynatrace Inc (DT) Stock Analysis
Dynatrace Inc (DT) Stock AnalysisDynatrace Inc (DT) Stock Analysis
Dynatrace Inc (DT) Stock Analysis
 
Block Inc (SQ) Stock Analysis Report
Block Inc (SQ) Stock Analysis ReportBlock Inc (SQ) Stock Analysis Report
Block Inc (SQ) Stock Analysis Report
 
Workday Inc (WDAY) Stock Analysis
Workday Inc (WDAY) Stock AnalysisWorkday Inc (WDAY) Stock Analysis
Workday Inc (WDAY) Stock Analysis
 
DELLStock Forecast.pdf
DELLStock Forecast.pdfDELLStock Forecast.pdf
DELLStock Forecast.pdf
 
The Lovesac Company (LOVE) Stock Analysis Report
The Lovesac Company (LOVE) Stock Analysis ReportThe Lovesac Company (LOVE) Stock Analysis Report
The Lovesac Company (LOVE) Stock Analysis Report
 
STEM Inc
STEM IncSTEM Inc
STEM Inc
 
Why did Prothena stock go up today?
Why did Prothena stock go up today?Why did Prothena stock go up today?
Why did Prothena stock go up today?
 
Amazon.com Inc (AMZN) Stock Analysis
Amazon.com Inc (AMZN) Stock AnalysisAmazon.com Inc (AMZN) Stock Analysis
Amazon.com Inc (AMZN) Stock Analysis
 
Moderna Inc
Moderna IncModerna Inc
Moderna Inc
 

More from Stocktargetadvisor.com

More from Stocktargetadvisor.com (20)

caledonia mining corporation
caledonia mining corporationcaledonia mining corporation
caledonia mining corporation
 
Tetra Bio Pharma Inc
Tetra Bio Pharma IncTetra Bio Pharma Inc
Tetra Bio Pharma Inc
 
Welltower Inc
Welltower IncWelltower Inc
Welltower Inc
 
MRVL | Marvell Technology Inc. Analyst Estimates & Rating
MRVL | Marvell Technology Inc. Analyst Estimates & RatingMRVL | Marvell Technology Inc. Analyst Estimates & Rating
MRVL | Marvell Technology Inc. Analyst Estimates & Rating
 
WMG - Warner Music Group Corp Forecast
WMG - Warner Music Group Corp ForecastWMG - Warner Music Group Corp Forecast
WMG - Warner Music Group Corp Forecast
 
PPG Industries Inc. Analyst Estimates & Rating
PPG Industries Inc. Analyst Estimates & RatingPPG Industries Inc. Analyst Estimates & Rating
PPG Industries Inc. Analyst Estimates & Rating
 
Tesla Inc
Tesla IncTesla Inc
Tesla Inc
 
Halliburton Company
Halliburton CompanyHalliburton Company
Halliburton Company
 
Owl Rock Capital Corp
Owl Rock Capital CorpOwl Rock Capital Corp
Owl Rock Capital Corp
 
Twitter Inc.
Twitter Inc.Twitter Inc.
Twitter Inc.
 
Airbnb Inc (ABNB) Stock Price & News
Airbnb Inc (ABNB) Stock Price & NewsAirbnb Inc (ABNB) Stock Price & News
Airbnb Inc (ABNB) Stock Price & News
 
WMT: Walmart Inc. Stock Price, Quote and News
WMT: Walmart Inc. Stock Price, Quote and NewsWMT: Walmart Inc. Stock Price, Quote and News
WMT: Walmart Inc. Stock Price, Quote and News
 
HAS Hasbro, Inc. Stock Price & Overview
HAS Hasbro, Inc. Stock Price & OverviewHAS Hasbro, Inc. Stock Price & Overview
HAS Hasbro, Inc. Stock Price & Overview
 
LUMN-Lumen Technologies Inc
LUMN-Lumen Technologies Inc LUMN-Lumen Technologies Inc
LUMN-Lumen Technologies Inc
 
APPL Apple Inc
APPL Apple IncAPPL Apple Inc
APPL Apple Inc
 
Moderna stock Analysis
Moderna stock AnalysisModerna stock Analysis
Moderna stock Analysis
 
Apple Stock News
Apple Stock NewsApple Stock News
Apple Stock News
 
Tesla Inc.pdf
Tesla Inc.pdfTesla Inc.pdf
Tesla Inc.pdf
 
Tesla Trap is Forming Again. Tesla News
Tesla Trap is Forming Again. Tesla NewsTesla Trap is Forming Again. Tesla News
Tesla Trap is Forming Again. Tesla News
 
Tamarack Valley Energy Announces Closing of Previously Announced Equity Finan...
Tamarack Valley Energy Announces Closing of Previously Announced Equity Finan...Tamarack Valley Energy Announces Closing of Previously Announced Equity Finan...
Tamarack Valley Energy Announces Closing of Previously Announced Equity Finan...
 

Recently uploaded

20240429 Calibre April 2024 Investor Presentation.pdf
20240429 Calibre April 2024 Investor Presentation.pdf20240429 Calibre April 2024 Investor Presentation.pdf
20240429 Calibre April 2024 Investor Presentation.pdf
Adnet Communications
 
VIP Call Girl Service Andheri West ⚡ 9920725232 What It Takes To Be The Best ...
VIP Call Girl Service Andheri West ⚡ 9920725232 What It Takes To Be The Best ...VIP Call Girl Service Andheri West ⚡ 9920725232 What It Takes To Be The Best ...
VIP Call Girl Service Andheri West ⚡ 9920725232 What It Takes To Be The Best ...
dipikadinghjn ( Why You Choose Us? ) Escorts
 
VIP Call Girl in Mira Road 💧 9920725232 ( Call Me ) Get A New Crush Everyday ...
VIP Call Girl in Mira Road 💧 9920725232 ( Call Me ) Get A New Crush Everyday ...VIP Call Girl in Mira Road 💧 9920725232 ( Call Me ) Get A New Crush Everyday ...
VIP Call Girl in Mira Road 💧 9920725232 ( Call Me ) Get A New Crush Everyday ...
dipikadinghjn ( Why You Choose Us? ) Escorts
 
VIP Independent Call Girls in Andheri 🌹 9920725232 ( Call Me ) Mumbai Escorts...
VIP Independent Call Girls in Andheri 🌹 9920725232 ( Call Me ) Mumbai Escorts...VIP Independent Call Girls in Andheri 🌹 9920725232 ( Call Me ) Mumbai Escorts...
VIP Independent Call Girls in Andheri 🌹 9920725232 ( Call Me ) Mumbai Escorts...
dipikadinghjn ( Why You Choose Us? ) Escorts
 

Recently uploaded (20)

(INDIRA) Call Girl Mumbai Call Now 8250077686 Mumbai Escorts 24x7
(INDIRA) Call Girl Mumbai Call Now 8250077686 Mumbai Escorts 24x7(INDIRA) Call Girl Mumbai Call Now 8250077686 Mumbai Escorts 24x7
(INDIRA) Call Girl Mumbai Call Now 8250077686 Mumbai Escorts 24x7
 
Call Girls Koregaon Park Call Me 7737669865 Budget Friendly No Advance Booking
Call Girls Koregaon Park Call Me 7737669865 Budget Friendly No Advance BookingCall Girls Koregaon Park Call Me 7737669865 Budget Friendly No Advance Booking
Call Girls Koregaon Park Call Me 7737669865 Budget Friendly No Advance Booking
 
03_Emmanuel Ndiaye_Degroof Petercam.pptx
03_Emmanuel Ndiaye_Degroof Petercam.pptx03_Emmanuel Ndiaye_Degroof Petercam.pptx
03_Emmanuel Ndiaye_Degroof Petercam.pptx
 
Booking open Available Pune Call Girls Wadgaon Sheri 6297143586 Call Hot Ind...
Booking open Available Pune Call Girls Wadgaon Sheri  6297143586 Call Hot Ind...Booking open Available Pune Call Girls Wadgaon Sheri  6297143586 Call Hot Ind...
Booking open Available Pune Call Girls Wadgaon Sheri 6297143586 Call Hot Ind...
 
20240429 Calibre April 2024 Investor Presentation.pdf
20240429 Calibre April 2024 Investor Presentation.pdf20240429 Calibre April 2024 Investor Presentation.pdf
20240429 Calibre April 2024 Investor Presentation.pdf
 
Top Rated Pune Call Girls Viman Nagar ⟟ 6297143586 ⟟ Call Me For Genuine Sex...
Top Rated  Pune Call Girls Viman Nagar ⟟ 6297143586 ⟟ Call Me For Genuine Sex...Top Rated  Pune Call Girls Viman Nagar ⟟ 6297143586 ⟟ Call Me For Genuine Sex...
Top Rated Pune Call Girls Viman Nagar ⟟ 6297143586 ⟟ Call Me For Genuine Sex...
 
The Economic History of the U.S. Lecture 26.pdf
The Economic History of the U.S. Lecture 26.pdfThe Economic History of the U.S. Lecture 26.pdf
The Economic History of the U.S. Lecture 26.pdf
 
VIP Call Girl Service Andheri West ⚡ 9920725232 What It Takes To Be The Best ...
VIP Call Girl Service Andheri West ⚡ 9920725232 What It Takes To Be The Best ...VIP Call Girl Service Andheri West ⚡ 9920725232 What It Takes To Be The Best ...
VIP Call Girl Service Andheri West ⚡ 9920725232 What It Takes To Be The Best ...
 
The Economic History of the U.S. Lecture 23.pdf
The Economic History of the U.S. Lecture 23.pdfThe Economic History of the U.S. Lecture 23.pdf
The Economic History of the U.S. Lecture 23.pdf
 
The Economic History of the U.S. Lecture 25.pdf
The Economic History of the U.S. Lecture 25.pdfThe Economic History of the U.S. Lecture 25.pdf
The Economic History of the U.S. Lecture 25.pdf
 
Best VIP Call Girls Noida Sector 18 Call Me: 8448380779
Best VIP Call Girls Noida Sector 18 Call Me: 8448380779Best VIP Call Girls Noida Sector 18 Call Me: 8448380779
Best VIP Call Girls Noida Sector 18 Call Me: 8448380779
 
Gurley shaw Theory of Monetary Economics.
Gurley shaw Theory of Monetary Economics.Gurley shaw Theory of Monetary Economics.
Gurley shaw Theory of Monetary Economics.
 
06_Joeri Van Speybroek_Dell_MeetupDora&Cybersecurity.pdf
06_Joeri Van Speybroek_Dell_MeetupDora&Cybersecurity.pdf06_Joeri Van Speybroek_Dell_MeetupDora&Cybersecurity.pdf
06_Joeri Van Speybroek_Dell_MeetupDora&Cybersecurity.pdf
 
VIP Call Girl in Mira Road 💧 9920725232 ( Call Me ) Get A New Crush Everyday ...
VIP Call Girl in Mira Road 💧 9920725232 ( Call Me ) Get A New Crush Everyday ...VIP Call Girl in Mira Road 💧 9920725232 ( Call Me ) Get A New Crush Everyday ...
VIP Call Girl in Mira Road 💧 9920725232 ( Call Me ) Get A New Crush Everyday ...
 
Solution Manual for Financial Accounting, 11th Edition by Robert Libby, Patri...
Solution Manual for Financial Accounting, 11th Edition by Robert Libby, Patri...Solution Manual for Financial Accounting, 11th Edition by Robert Libby, Patri...
Solution Manual for Financial Accounting, 11th Edition by Robert Libby, Patri...
 
The Economic History of the U.S. Lecture 17.pdf
The Economic History of the U.S. Lecture 17.pdfThe Economic History of the U.S. Lecture 17.pdf
The Economic History of the U.S. Lecture 17.pdf
 
VIP Independent Call Girls in Andheri 🌹 9920725232 ( Call Me ) Mumbai Escorts...
VIP Independent Call Girls in Andheri 🌹 9920725232 ( Call Me ) Mumbai Escorts...VIP Independent Call Girls in Andheri 🌹 9920725232 ( Call Me ) Mumbai Escorts...
VIP Independent Call Girls in Andheri 🌹 9920725232 ( Call Me ) Mumbai Escorts...
 
(DIYA) Bhumkar Chowk Call Girls Just Call 7001035870 [ Cash on Delivery ] Pun...
(DIYA) Bhumkar Chowk Call Girls Just Call 7001035870 [ Cash on Delivery ] Pun...(DIYA) Bhumkar Chowk Call Girls Just Call 7001035870 [ Cash on Delivery ] Pun...
(DIYA) Bhumkar Chowk Call Girls Just Call 7001035870 [ Cash on Delivery ] Pun...
 
The Economic History of the U.S. Lecture 18.pdf
The Economic History of the U.S. Lecture 18.pdfThe Economic History of the U.S. Lecture 18.pdf
The Economic History of the U.S. Lecture 18.pdf
 
Pooja 9892124323 : Call Girl in Juhu Escorts Service Free Home Delivery
Pooja 9892124323 : Call Girl in Juhu Escorts Service Free Home DeliveryPooja 9892124323 : Call Girl in Juhu Escorts Service Free Home Delivery
Pooja 9892124323 : Call Girl in Juhu Escorts Service Free Home Delivery
 

Progress Software Corporation.pdf

  • 1.
  • 2. Page 1 of 9 Any information in this report is not , and should not be regarded as investment advice or as a recommendation regarding any particular security or course of action. We recommend seeking a licensed professional for investment advice. PRGS:NSD (Progress Software Corporation) Software-Application | NSD | Common Stock Values as of 29th Sep, 2022 Stock Target Advisor Detailed Stock Report Report Date: 30th September, 2022 Last Close USD 42.36 Change +0.01(+0.02%) Market Cap USD 1.81B 1 Yr Capital Gain -13.88% 1 Yr Dividend Return 1.42% 1 Yr Total Return -12.46% Earning Growth (5 yr) 240.72% Average Target Price 52.00(+22.76% ) Average Analyst Rating Strong Buy Fundamental Analysis Slightly Bullish Our view of the stock is Slightly Bullish with a score of 5.8 out of 10, where 0 is very bearish and 10 very bullish What to like Low volatility The stock’s annual returns have been stable and consistent compared to its sector peers(for a hold period of at least 12 months) and is in the top quartile. Although stability is good, also keep in mind it can limit returns. Superior return on equity The company management has delivered better return on equity in the most recent 4 quarters than its peers, placing it in the top quartile. Superior capital utilization The company management has delivered better return on invested capital in the most recent 4 quarters than its peers, placing it in the top quartile. Superior return on assets The company management has delivered better return on assets in the most recent 4 quarters than its peers, placing it in the top quartile. Positive cash flow The company had positive total cash flow in the most recent four quarters. Positive free cash flow The company had positive total free cash flow in the most recent four quarters. Superior Earnings Growth This stock has shown top quartile earnings growth in the previous 5 years compared to its sector. What to not like Overpriced compared to book value The stock is trading high compared to its peers median on a price to book value basis. Overpriced on cashflow basis The stock is trading high compared to its peers on a price to cash flow basis. It is priced above the median for its sectors. Proceed with caution if you are considering to buy. Highly leveraged The company is in the bottom half compared to its sector peers on debt to equity and is highly leveraged. However, do check the news and look at its sector and management statements. Sometimes this is high because the company is trying to grow aggressively. Overpriced on free cash flow basis The stock is trading high compared to its peers on a price to free cash flow basis. It is priced above the median for its sectors. Proceed with caution if you are considering to buy. Low Revenue Growth This stock has shown below median revenue growth in the previous 5 years compared to its sector
  • 3. Page 2 of 9 Any information in this report is not , and should not be regarded as investment advice or as a recommendation regarding any particular security or course of action. We recommend seeking a licensed professional for investment advice. PRGS:NSD (Progress Software Corporation) Software-Application | | Common Stock Stock Target Advisor Detailed Stock Report Report Date: 30th September, 2022 Adjusted Closing Share Volume Relative Returns Relative Performance (Total Returns) Security Capital Gain Dividend Return Total Return PRGS Progress Software Corporation -13.1% +1.4% -11.7% QQQ Invesco QQQ Trust -24.3% +0.4% -23.9% Company Overview Progress Software Corporation develops, deploys, and manages business applications. The company offers OpenEdge, a development software, which builds multi-language applications for secure deployment across various platforms and devices, as well as cloud; developer tools that consists of components for user interface development for Web, mobile, desktop, chat, and AR/VR apps, as well as automated application testing and reporting tools; Sitefinity, a web content management and customer analytics platform; Corticon, a business rules management system that provides applications with decision automation and change process, and decision-related insight capabilities. It also offers DataDirect Connect, which provides data connectivity using industry-standard interfaces to connect applications running on various platforms; MOVEit that offers secure collaboration and automated file transfers of critical business information; Chef, an infrastructure automation platform to build, deploy, manage, and secure applications in multi-cloud and hybrid environments, and on- premises; and WhatsUp Gold, a network monitoring solution. In addition, the company provides Kemp LoadMaster, a load balancing solutions; and Kemp Flowmon network performance monitoring and diagnostic solutions that collect and analyze network telemetry from various sources. Further, it provides project management, implementation, custom development, programming, and other services, as well as web-enable applications; and training services. The company sells its products to end users, independent software vendors, original equipment manufacturers, and system integrators. It has operations in the United States, Canada, Latin America, Europe, the Middle East, Africa, and the Asia Pacific. The company was founded in 1981 and is headquartered in Burlington, Massachusetts.
  • 4. Page 3 of 9 Any information in this report is not , and should not be regarded as investment advice or as a recommendation regarding any particular security or course of action. We recommend seeking a licensed professional for investment advice. Company Website https://www.progress.com Address 15 Wayside Road, Burlington, MA, United States, 01803 Fiscal Year End November Employees 2103 Technical Indicators Value Value Beta 1.00 52 Week High 53.20 Short Ratio 13.57 52 Week Low 40.33 Shorted Shares 2,635,573 200 Day Moving Average 46.44 Shorted Shares Previous Month 2,790,389 50 Day Moving Average 46.82 Shares Held By Insiders 160.70% Short Percentage 5.00% Shares Held by Institutions 105.61 Dividend Yield 1.66%
  • 5. Page 4 of 9 Any information in this report is not , and should not be regarded as investment advice or as a recommendation regarding any particular security or course of action. We recommend seeking a licensed professional for investment advice. PRGS:NSD (Progress Software Corporation) Software-Application | | Common Stock Stock Target Advisor Detailed Stock Report Report Date: 30th September, 2022 Market Performance Market Performance vs. Industry / Classification (Software-Application) Market Performance vs. Exchange (Nasdaq Global Select) Value Sector Median Percentile Rank Grade Market Median Percentile Rank Grade YTD Capital Gain -12.24% -50.1% 89% -28.6% 67% Dividend Return 1.09% 1.1% 50% 1.7% 32% Total Return -11.16% -50.1% 89% -27.6% 67% Trailing 12 Months Capital Gain -13.88% -54.8% 88% -30.6% 66% Dividend Return 1.42% 1.4% 53% 2.4% 30% Total Return -12.46% -54.8% 90% -28.9% 65% Trailing 5 Years Capital Gain 10.98% 2.0% 51% -9.1% 63% Dividend Return 8.49% 10.5% 36% 10.4% 37% Total Return 19.47% 18.7% 51% 0.9% 62% Average Annual (5 Year Horizon) Capital Gain 4.96% 1.1% 53% 0.2% 63% Dividend Return 1.62% 1.1% 61% 1.8% 45% Total Return 6.58% 4.0% 54% 0.7% 63% Risk Return Profile Volatility (Standard Deviation) 17.10% 38.7% 93% 33.4% 75% Risk Adjusted Return 38.46% N/A 66% 10.9% 73% Market Capitalization 1.81B 0.42B 71% 0.27B 83%
  • 6. Page 5 of 9 Any information in this report is not , and should not be regarded as investment advice or as a recommendation regarding any particular security or course of action. We recommend seeking a licensed professional for investment advice. Key Financial Ratios Ratios vs. Industry / Classification (Computer Hardware) Ratios vs. Exchange (Nasdaq Global Select) Value Sector Median Percentile Rank Grade Market Median Percentile Rank Grade Market Value peratio 19.4 32.1 63% 17.0 45% pbratio 4.9 2.8 30% 1.4 16% pcfratio 10.1 6.3 44% -1.3 21% pfcfratio 11.1 0.0 26% -0.1 20% Management Effectiveness retequity 25.88% -18.5% 93% -7.9% 91% retinvcap 11.64% -9.6% 84% -1.7% 79% retass 6.63% -5.3% 91% -1.0% 88% debtequityratio 129.59% 25.7% 23% 29.9% 17% Technical Ratios yield 1.66% 1.7% 47% 3.0% 28% sratio 13.57 3.05 5% 2.66 6% spercent 9.28% 3.1% 14% 2.4% 17% beta 1.00 1.13 57% 1.06 55%
  • 7. Page 6 of 9 Any information in this report is not , and should not be regarded as investment advice or as a recommendation regarding any particular security or course of action. We recommend seeking a licensed professional for investment advice. PRGS:NSD (Progress Software Corporation) Software-Application | | Common Stock Stock Target Advisor Detailed Stock Report Report Date: 30th September, 2022 Recent Analyst Ratings Price Action Rating Action Analyst Rating Price date Target Lowered by Citigroup USD 52 » USD 46 2022-09-29 Target Down Jefferies Financial LLC USD 45 2022-09-29 Target Down JP Morgan & Company USD 56 2022-09-29 Initiates Coverage On Jefferies Financial LLC Hold USD 52 2022-09-09 Initiated by Guggenheim Securities Buy USD 60 2022-08-12 Maintains Oppenheimer Holdings Outperform USD 60 » USD 53 2022-06-29 Target Raised by Citigroup USD 48 » USD 52 2022-03-30 Initiates Coverage On JP Morgan & Company Overweight USD 60 2021-10-22 Target Raised by Citigroup Neutral USD 48 » USD 50 2021-09-24 Target Raised by Oppenheimer Holdings Outperform USD 54 » USD 60 2021-09-24 Initiated by Citigroup Neutral USD 48 2021-08-06 Initiates Coverage On Oppenheimer Holdings Outperform USD 54 2021-07-15 Initiated by Guggenheim Securities Buy USD 56 2021-06-08 Maintains Wedbush Outperform USD 45 » USD 55 2021-01-15 Reiterated by Wedbush Outperform USD 45 2020-08-26 Target Raised by Benchmark Buy USD 39 » USD 43 2020-06-26 Target Lowered by Wedbush Outperform USD 58 » USD 42 2020-03-27 Reiterated by Benchmark Buy USD 49 » USD 57 2020-01-17 Initiates Sidoti & Co. Buy USD 53 2019-10-22 Upgrades Wedbush Neutral » Outperform USD 44 » USD 52 2019-07-26 Upgrades Benchmark Hold » Buy 2019-07-17 Upgrades Benchmark Buy USD 49 2019-07-17 Reiterates Wedbush Neutral USD 42 » USD 44 2019-07-02 Set Price Target National Securities Buy USD 50 2019-06-28 Reiterates Wedbush Neutral USD 36 » USD 42 2019-03-29
  • 8. Page 7 of 9 Any information in this report is not , and should not be regarded as investment advice or as a recommendation regarding any particular security or course of action. We recommend seeking a licensed professional for investment advice. PRGS:NSD (Progress Software Corporation) Software-Application | | Common Stock Stock Target Advisor Detailed Stock Report Report Date: 30th September, 2022 Annual Financial (USD)
  • 9. Page 8 of 9 Any information in this report is not , and should not be regarded as investment advice or as a recommendation regarding any particular security or course of action. We recommend seeking a licensed professional for investment advice. PRGS:NSD (Progress Software Corporation) Software-Application | | Common Stock Stock Target Advisor Detailed Stock Report Report Date: 30th September, 2022 Quarterly Financial (USD)
  • 10. Page 9 of 9 Any information in this report is not , and should not be regarded as investment advice or as a recommendation regarding any particular security or course of action. We recommend seeking a licensed professional for investment advice. PRGS:NSD (Progress Software Corporation) Software-Application | | Common Stock Stock Target Advisor Detailed Stock Report Report Date: 30th September, 2022 Largest Industry Peers for Software-Application Symbol Company Name Price(Change) Market Cap INTU Intuit Inc -12.48 (-3.0%) USD 112.97B TEAM Atlassian Corp Plc -5.81 (-2.7%) USD 55.27B CDNS Cadence Design Systems Inc -2.28 (-1.4%) USD 44.68B ADSK Autodesk Inc -1.52 (-0.8%) USD 41.22B WDAY Workday Inc -0.59 (-0.4%) USD 40.15B TTD Trade Desk Inc -2.16 (-3.4%) USD 30.62B DDOG Datadog Inc -2.31 (-2.6%) USD 27.34B ZM Zoom Video Communications Inc -1.42 (-1.9%) USD 22.16B ANSS ANSYS Inc -4.66 (-2.0%) USD 20.22B NUAN Nuance Communications Inc N/A USD 17.88B ETFs Containing PRGS Symbol Company Name Weight Mer Price(Change) Market Cap WFH Direxion Work From Home ETF 0.00 % 0.00 % -0.87 (-2.0%) USD 0.05B The Stock Target Advisor platform run millions of calculations every day on over 30,000 Canadian and American stocks, comparing and ranking their financial and market performance against their sectors and exchange. We represent the percentile ranking using the following grading system. Letter Grade Percentage Letter Grade Percentage Letter Grade Percentage A+ 97%-100% A 93%-96% A- 90%-92% B+ 97%-89% B 83%-86% B- 80%-82% C+ 77%-79% C 73%-76% C- 70%-72% D+ 67%-69% D 63%-66% D- 60%-62% F 0%-59%