dMY Technology Group Inc. IV (DMYQ) Stock Analysis
•
0 likes•49 views

dMY Technology Group, Inc. IV focuses on effecting a merger, capital stock exchange, asset acquisition, stock purchase, reorganization, or similar business combination with one or more businesses. The company was founded in 2020 and is based in Las Vegas, Nevada. Stock Target Advisor’s own stock analysis of dMY Technology Group Inc. IV is Neutral, which is based on 0 positive signals and 0 negative signals. At the last closing, dMY Technology Group Inc. IV’s stock price was USD 11.35. dMY Technology Group Inc. IV’s stock price has changed by +0.00% over the past week, +0.00% over the past month and +15.70% over the last year.

Recommended
More Related Content
Similar to dMY Technology Group Inc. IV (DMYQ) Stock Analysis
Similar to dMY Technology Group Inc. IV (DMYQ) Stock Analysis (20)
More from Stock Target Advisor
More from Stock Target Advisor (20)
Recently uploaded
Recently uploaded (20)
dMY Technology Group Inc. IV (DMYQ) Stock Analysis
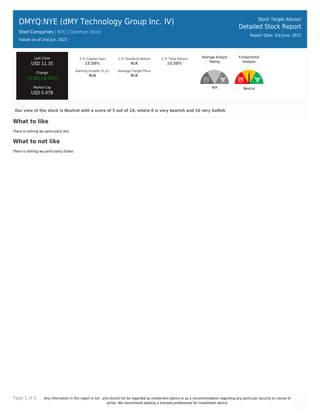
- 1. Page 1 of 9 Any information in this report is not , and should not be regarded as investment advice or as a recommendation regarding any particular security or course of action. We recommend seeking a licensed professional for investment advice. DMYQ:NYE (dMY Technology Group Inc. IV) Shell Companies | NYE | Common Stock Values as of 2nd Jun, 2022 Stock Target Advisor Detailed Stock Report Report Date: 3rd June, 2022 Last Close USD 11.35 Change +0.00(+0.00%) Market Cap USD 0.47B 1 Yr Capital Gain 15.58% 1 Yr Dividend Return N/A 1 Yr Total Return 15.58% Earning Growth (5 yr) N/A Average Target Price N/A Average Analyst Rating N/A Fundamental Analysis Neutral Our view of the stock is Neutral with a score of 5 out of 10, where 0 is very bearish and 10 very bullish What to like There is nothing we particularly like What to not like There is nothing we particularly dislike
- 2. Page 2 of 9 Any information in this report is not , and should not be regarded as investment advice or as a recommendation regarding any particular security or course of action. We recommend seeking a licensed professional for investment advice. DMYQ:NYE (dMY Technology Group Inc. IV) Shell Companies | | Common Stock Stock Target Advisor Detailed Stock Report Report Date: 3rd June, 2022 Adjusted Closing Share Volume Relative Returns Relative Performance (Total Returns) Security Capital Gain Dividend Return Total Return DMYQ dMY Technology Group Inc. IV +15.7% 0 +15.7% VTI Vanguard Total Stock Market Index Fund ETF Shares -4.3% +1.4% -2.9% Company Overview dMY Technology Group, Inc. IV focuses on effecting a merger, capital stock exchange, asset acquisition, stock purchase, reorganization, or similar business combination with one or more businesses. The company was founded in 2020 and is based in Las Vegas, Nevada.
- 3. Page 3 of 9 Any information in this report is not , and should not be regarded as investment advice or as a recommendation regarding any particular security or course of action. We recommend seeking a licensed professional for investment advice. Company Website https://www.dmytechnology.com Address 1180 North Town Center Drive, Las Vegas, NV, United States, 89144 Fiscal Year End December Technical Indicators Value Value Beta N/A 52 Week High 12.15 Short Ratio 0.46 52 Week Low 8.89 Shorted Shares 486,658 200 Day Moving Average 10.01 Shorted Shares Previous Month 107,711 50 Day Moving Average 10.29 Shares Held By Insiders N/A Short Percentage N/A Shares Held by Institutions 84.74 Dividend Yield N/A
- 4. Page 4 of 9 Any information in this report is not , and should not be regarded as investment advice or as a recommendation regarding any particular security or course of action. We recommend seeking a licensed professional for investment advice. DMYQ:NYE (dMY Technology Group Inc. IV) Shell Companies | | Common Stock Stock Target Advisor Detailed Stock Report Report Date: 3rd June, 2022 Market Performance Market Performance vs. Industry / Classification (Shell Companies) Market Performance vs. Exchange (Nasdaq Global Select) Value Sector Median Percentile Rank Grade Market Median Percentile Rank Grade YTD Capital Gain N/A 0.5% N/A -9.9% N/A Dividend Return N/A N/A N/A 1.2% N/A Total Return N/A 0.5% N/A -9.0% N/A Trailing 12 Months Capital Gain 15.58% 0.4% N/A -8.7% N/A Dividend Return N/A N/A N/A 2.8% N/A Total Return 15.58% 0.4% N/A -6.1% N/A Trailing 5 Years Capital Gain N/A -64.0% N/A 9.0% N/A Dividend Return N/A 6.5% N/A 12.8% N/A Total Return N/A -61.5% N/A 24.5% N/A Average Annual (5 Year Horizon) Capital Gain 1.03% 0.0% N/A 4.9% N/A Dividend Return N/A 1.0% N/A 2.2% N/A Total Return 1.03% 0.0% N/A 8.0% N/A Risk Return Profile Volatility (Standard Deviation) 3.85% 0.6% N/A 23.1% N/A Risk Adjusted Return 26.72% N/A N/A 39.9% N/A Market Capitalization 0.47B 0.35B N/A 1.03B N/A
- 5. Page 5 of 9 Any information in this report is not , and should not be regarded as investment advice or as a recommendation regarding any particular security or course of action. We recommend seeking a licensed professional for investment advice. Key Financial Ratios Ratios vs. Industry / Classification (Computer Hardware) Ratios vs. Exchange (Nasdaq Global Select) Value Sector Median Percentile Rank Grade Market Median Percentile Rank Grade Market Value peratio N/A 41.2 N/A 16.2 N/A pbratio N/A 1.3 N/A 1.6 N/A pcfratio N/A -301.0 N/A 7.4 N/A pfcfratio N/A 73.8 N/A 10.8 N/A Management Effectiveness retequity -9,999,999.00 % 46.7% N/A 10.2% N/A retinvcap -11.50% -0.1% N/A 5.7% N/A retass N/A -0.5% N/A 2.5% N/A debtequityratio N/A -5.1% N/A 68.2% N/A Technical Ratios yield N/A N/A N/A 3.0% N/A sratio 0.46 0.16 N/A 2.08 N/A spercent 0.52% 0.0% N/A 3.7% N/A beta N/A 0.38 N/A 1.03 N/A
- 6. Page 6 of 9 Any information in this report is not , and should not be regarded as investment advice or as a recommendation regarding any particular security or course of action. We recommend seeking a licensed professional for investment advice. DMYQ:NYE (dMY Technology Group Inc. IV) Shell Companies | | Common Stock Stock Target Advisor Detailed Stock Report Report Date: 3rd June, 2022 Recent Analyst Ratings Price Action Rating Action Analyst Rating Price date Initiated by Westpark Capital Buy USD 16 2021-11-12 Initiated by Northland Capital Outperform USD 16 2021-11-09 Initiates Coverage On Benchmark Buy USD 17 2021-11-08 Initiates Coverage On Craig Hallum Buy USD 15 2021-09-27
- 7. Page 7 of 9 Any information in this report is not , and should not be regarded as investment advice or as a recommendation regarding any particular security or course of action. We recommend seeking a licensed professional for investment advice. DMYQ:NYE (dMY Technology Group Inc. IV) Shell Companies | | Common Stock Stock Target Advisor Detailed Stock Report Report Date: 3rd June, 2022 Annual Financial (USD)
- 8. Page 8 of 9 Any information in this report is not , and should not be regarded as investment advice or as a recommendation regarding any particular security or course of action. We recommend seeking a licensed professional for investment advice. DMYQ:NYE (dMY Technology Group Inc. IV) Shell Companies | | Common Stock Stock Target Advisor Detailed Stock Report Report Date: 3rd June, 2022 Quarterly Financial (USD)
- 9. Page 9 of 9 Any information in this report is not , and should not be regarded as investment advice or as a recommendation regarding any particular security or course of action. We recommend seeking a licensed professional for investment advice. DMYQ:NYE (dMY Technology Group Inc. IV) Shell Companies | | Common Stock Stock Target Advisor Detailed Stock Report Report Date: 3rd June, 2022 Largest Industry Peers for Shell Companies Symbol Company Name Price(Change) Market Cap CCIV Churchill Capital Corp IV N/A USD 6.27B BFT Foley Trasimene Acquisition Co.. N/A USD 2.77B ASZ Austerlitz Acquisition II Corp N/A USD 1.93B FEAC Flying Eagle Acquisition Corp N/A USD 1.52B SHLL Tortoise Acquisition Corp N/A USD 1.31B AAC Ares Acquisition Corp -0.01 (-0.1%) USD 1.23B SBE Switchback Energy Acquisition .. N/A USD 1.21B CPUH Compute Health Acquisition Cor.. +0.01 (+0.1%) USD 1.06B CRHC Cohn Robbins Holdings Corp N/A USD 1.03B GSAH GS Acquisition Holdings Corp I.. N/A USD 0.99B The Stock Target Advisor platform run millions of calculations every day on over 30,000 Canadian and American stocks, comparing and ranking their financial and market performance against their sectors and exchange. We represent the percentile ranking using the following grading system. Letter Grade Percentage Letter Grade Percentage Letter Grade Percentage A+ 97%-100% A 93%-96% A- 90%-92% B+ 97%-89% B 83%-86% B- 80%-82% C+ 77%-79% C 73%-76% C- 70%-72% D+ 67%-69% D 63%-66% D- 60%-62% F 0%-59%