XPeng Inc (XPEV) Stock Analysis Report
•
0 likes•45 views

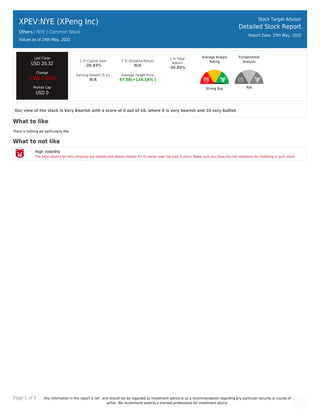
Based on the XPeng Inc stock forecasts from 10 analysts, the average analyst target price for XPeng Inc is USD 47.58 over the next 12 months. XPeng Inc’s average analyst rating is Strong Buy. Stock Target Advisor’s own stock analysis of XPeng Inc is Very Bearish, which is based on 0 positive signals and 1 negative signals. At the last closing, XPeng Inc’s stock price was USD 20.32. XPeng Inc’s stock price has changed by -15.16% over the past week, -14.87% over the past month and -30.24% over the last year.

Recommended
Recommended
More Related Content
Similar to XPeng Inc (XPEV) Stock Analysis Report
Similar to XPeng Inc (XPEV) Stock Analysis Report (20)
More from Stock Target Advisor
More from Stock Target Advisor (20)
Recently uploaded
Recently uploaded (20)
XPeng Inc (XPEV) Stock Analysis Report
- 1. Page 1 of 9 Any information in this report is not , and should not be regarded as investment advice or as a recommendation regarding any particular security or course of action. We recommend seeking a licensed professional for investment advice. XPEV:NYE (XPeng Inc) Others | NYE | Common Stock Values as of 24th May, 2022 Stock Target Advisor Detailed Stock Report Report Date: 25th May, 2022 Last Close USD 20.32 Change -1.66(-7.55%) Market Cap USD 0 1 Yr Capital Gain -30.84% 1 Yr Dividend Return N/A 1 Yr Total Return -30.84% Earning Growth (5 yr) N/A Average Target Price 47.58(+134.18% ) Average Analyst Rating Strong Buy Fundamental Analysis N/A Our view of the stock is Very Bearish with a score of 0 out of 10, where 0 is very bearish and 10 very bullish What to like There is nothing we particularly like What to not like High volatility The total returns for this company are volatile and above median for its sector over the past 5 years. Make sure you have the risk tolerance for investing in such stock.
- 2. Page 2 of 9 Any information in this report is not , and should not be regarded as investment advice or as a recommendation regarding any particular security or course of action. We recommend seeking a licensed professional for investment advice. XPEV:NYE (XPeng Inc) Others | | Common Stock Stock Target Advisor Detailed Stock Report Report Date: 25th May, 2022 Adjusted Closing Share Volume Relative Returns Relative Performance (Total Returns) Security Capital Gain Dividend Return Total Return XPEV XPeng Inc -30.2% 0 -30.2% VTI Vanguard Index Funds - Vanguard Total Stock Market ETF -9.4% +1.4% -8.1%
- 3. Page 3 of 9 Any information in this report is not , and should not be regarded as investment advice or as a recommendation regarding any particular security or course of action. We recommend seeking a licensed professional for investment advice. Technical Indicators Value Value Beta N/A 52 Week High N/A Short Ratio N/A 52 Week Low N/A Shorted Shares N/A 200 Day Moving Average N/A Shorted Shares Previous Month N/A 50 Day Moving Average N/A Shares Held By Insiders N/A Short Percentage N/A Shares Held by Institutions N/A Dividend Yield N/A
- 4. Page 4 of 9 Any information in this report is not , and should not be regarded as investment advice or as a recommendation regarding any particular security or course of action. We recommend seeking a licensed professional for investment advice. XPEV:NYE (XPeng Inc) Others | | Common Stock Stock Target Advisor Detailed Stock Report Report Date: 25th May, 2022 Market Performance Market Performance vs. Industry / Classification (Others) Market Performance vs. Exchange (Nasdaq Global Select) Value Sector Median Percentile Rank Grade Market Median Percentile Rank Grade YTD Capital Gain -59.63% -15.7% 6% -13.3% 4% Dividend Return N/A 0.7% N/A 1.0% N/A Total Return -59.63% -15.2% 6% -12.4% 4% Trailing 12 Months Capital Gain -30.84% -12.1% 22% -11.0% 18% Dividend Return N/A 2.3% N/A 2.8% N/A Total Return -30.84% -9.7% 20% -8.2% 16% Trailing 5 Years Capital Gain N/A 422.5% N/A 5.3% N/A Dividend Return N/A 7.5% N/A 12.8% N/A Total Return N/A 422.5% N/A 20.9% N/A Average Annual (5 Year Horizon) Capital Gain 7.97% 0.0% 78% 4.8% 58% Dividend Return N/A 0.8% N/A 2.1% N/A Total Return 7.97% 0.4% 75% 8.0% 50% Risk Return Profile Volatility (Standard Deviation) 34.64% 9.3% 13% 22.8% 31% Risk Adjusted Return 23.00% N/A 55% 40.2% 31% Market Capitalization N/A 0.03B N/A 1.52B N/A
- 5. Page 5 of 9 Any information in this report is not , and should not be regarded as investment advice or as a recommendation regarding any particular security or course of action. We recommend seeking a licensed professional for investment advice. Key Financial Ratios Ratios vs. Industry / Classification (Computer Hardware) Ratios vs. Exchange (Nasdaq Global Select) Value Sector Median Percentile Rank Grade Market Median Percentile Rank Grade Market Value peratio N/A 25.5 N/A 16.1 N/A pbratio N/A 3.1 N/A 1.6 N/A pcfratio N/A 9.5 N/A 7.1 N/A pfcfratio N/A -5.2 N/A 10.9 N/A Management Effectiveness retequity N/A -31.1% N/A 10.0% N/A retinvcap N/A 5.1% N/A 5.5% N/A retass N/A -32.5% N/A 2.5% N/A debtequityratio N/A 122.1% N/A 68.5% N/A Technical Ratios yield N/A 2.0% N/A 3.1% N/A sratio N/A 2.40 N/A 2.12 N/A spercent N/A 120.0% N/A 3.6% N/A beta N/A 0.96 N/A 1.03 N/A
- 6. Page 6 of 9 Any information in this report is not , and should not be regarded as investment advice or as a recommendation regarding any particular security or course of action. We recommend seeking a licensed professional for investment advice. XPEV:NYE (XPeng Inc) Others | | Common Stock Stock Target Advisor Detailed Stock Report Report Date: 25th May, 2022 Recent Analyst Ratings Price Action Rating Action Analyst Rating Price date Maintains Bank of America Buy USD 46 » USD 40 2022-05-24 Target Lowered by Bank of America Securities USD 46 » USD 40 2022-05-24 Maintains JP Morgan & Company Overweight USD 42 » USD 35 2022-05-24 Maintains Barclays Overweight USD 39 » USD 30 2022-05-24 Initiated by HSBC Buy USD 37 2022-04-02 Target Lowered by Barclays Overweight USD 45 » USD 39 2022-03-29 Target Lowered by Citigroup Buy USD 92 » USD 67 2022-03-29 Initiated by China Renaissance Buy USD 55.6 2022-03-24 Initiated by CLSA Buy USD 42 2022-03-23 Target Lowered by Morgan Stanley USD 71 » USD 42 2022-03-23 Initiated by Barclays Overweight USD 33 2022-02-08 Initiates Coverage On Macquarie Research Outperform 2022-01-12 Target Raised by Citigroup In-Line » Buy USD 87 » USD 92 2021-11-24 Target Raised by Bank of America Securities Buy USD 63 » USD 66 2021-11-24 Target Raised by Citigroup Outperform » Buy USD 53.4 » USD 87 2021-11-11 Initiated by Sanford Bernstein Outperform USD 56 2021-10-28 Target Raised by Bank of America Securities Buy USD 61 » USD 63 2021-10-01 Target Raised by Bank of America Securities Buy USD 56 » USD 61 2021-08-27 Initiated by Daiwa Securities Buy 2021-08-04 Target Raised by Citigroup Buy USD 50.3 » USD 56.3 2021-07-02 Target Raised by Citigroup Buy USD 50 » USD 50.3 2021-06-02 Initiated by Nomura Buy USD 47 2021-05-26 Upgraded by VTB Capital Hold » Buy 2021-03-11 Upgrades Daiwa Securities Buy USD 34 2021-03-09 Initiates Coverage On Morgan Stanley Overweight USD 70 2021-01-29
- 7. Page 7 of 9 Any information in this report is not , and should not be regarded as investment advice or as a recommendation regarding any particular security or course of action. We recommend seeking a licensed professional for investment advice. XPEV:NYE (XPeng Inc) Others | | Common Stock Stock Target Advisor Detailed Stock Report Report Date: 25th May, 2022 Annual Financial (USD) No record found.
- 8. Page 8 of 9 Any information in this report is not , and should not be regarded as investment advice or as a recommendation regarding any particular security or course of action. We recommend seeking a licensed professional for investment advice. XPEV:NYE (XPeng Inc) Others | | Common Stock Stock Target Advisor Detailed Stock Report Report Date: 25th May, 2022 Quarterly Financial (USD) No record found.
- 9. Page 9 of 9 Any information in this report is not , and should not be regarded as investment advice or as a recommendation regarding any particular security or course of action. We recommend seeking a licensed professional for investment advice. XPEV:NYE (XPeng Inc) Others | | Common Stock Stock Target Advisor Detailed Stock Report Report Date: 25th May, 2022 Largest Industry Peers for Others Symbol Company Name Price(Change) Market Cap DTB DTB +0.29 (+1.5%) USD 26.58B TIME Clockwise Capital Innovation E.. -0.83 (-4.5%) USD 1.84B NRGU MicroSectors U.S. Big Oil Inde.. +3.16 (+0.6%) USD 1.52B PFV Amplify YieldShares Senior Loa.. N/A USD 1.49B PTBD Pacer Funds Trust - Pacer Tren.. -0.01 (0.0%) USD 0.80B BWSN BWSN +0.01 (+0.0%) USD 0.67B CLFMF iShares 1-5 Year Laddered Gove.. N/A USD 0.52B SGL Strategic Global Income Fund I.. N/A USD 0.51B SCHJ Schwab 1-5 Year Corporate Bond.. +0.18 (+0.4%) USD 0.37B OVL Overlay Shares Large Cap Equit.. -0.31 (-0.9%) USD 0.24B ETFs Containing XPEV Symbol Company Name Weight Mer Price(Change) Market Cap CHIQ Global X MSCI China Consumer D.. 0.00 % 0.65 % -0.95 (-2.5%) USD 0.31B PGJ Invesco Golden Dragon China ET.. 0.00 % 0.70 % -1.72 (-2.5%) USD 0.24B PZD Invesco MSCI Sustainable Futur.. 0.00 % 0.68 % N/A USD 0.43B QCLN First Trust NASDAQ Clean Edge .. 0.00 % 0.60 % -1.77 (-2.5%) USD 1.91B KGRN KraneShares MSCI China Clean T.. 0.00 % 0.79 % -1.46 (-2.5%) USD 0.13B KARS KraneShares Electric Vehicles .. 0.00 % 0.70 % -0.95 (-2.5%) USD 0.25B KALL KraneShares MSCI All China Ind.. 0.00 % 0.67 % -0.72 (-2.5%) USD 0.02B HAIL SPDR S&P Kensho Smart Mobility.. 0.00 % 0.46 % -1.38 (-2.5%) USD 0.10B SMOG VanEck Vectors Low Carbon Ener.. 0.00 % 0.00 % -2.54 (-2.5%) N/A KESG KraneShares Trust - KraneShare.. 0.00 % 0.00 % -0.86 (-2.5%) N/A The Stock Target Advisor platform run millions of calculations every day on over 30,000 Canadian and American stocks, comparing and ranking their financial and market performance against their sectors and exchange. We represent the percentile ranking using the following grading system. Letter Grade Percentage Letter Grade Percentage Letter Grade Percentage A+ 97%-100% A 93%-96% A- 90%-92% B+ 97%-89% B 83%-86% B- 80%-82% C+ 77%-79% C 73%-76% C- 70%-72% D+ 67%-69% D 63%-66% D- 60%-62% F 0%-59%