Nevada Copper Corp (NCU) Stock Analysis
•
0 likes•18 views

This report provides a detailed analysis of Nevada Copper Corp. (NCU), a copper exploration and development company. It finds the stock to be bearish overall based on its below median performance on factors like earnings growth, returns, market capitalization and cash flow. It provides an overview of the company and its financials, compares its performance to peers, and lists recent analyst ratings and targets.

Recommended
Recommended
More Related Content
Similar to Nevada Copper Corp (NCU) Stock Analysis
Similar to Nevada Copper Corp (NCU) Stock Analysis (20)
More from Stock Target Advisor
More from Stock Target Advisor (20)
Recently uploaded
Recently uploaded (20)
Nevada Copper Corp (NCU) Stock Analysis
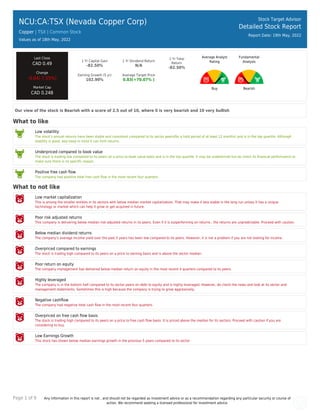
- 1. Page 1 of 9 Any information in this report is not , and should not be regarded as investment advice or as a recommendation regarding any particular security or course of action. We recommend seeking a licensed professional for investment advice. NCU:CA:TSX (Nevada Copper Corp) Copper | TSX | Common Stock Values as of 18th May, 2022 Stock Target Advisor Detailed Stock Report Report Date: 19th May, 2022 Last Close CAD 0.49 Change -0.04(-7.55%) Market Cap CAD 0.24B 1 Yr Capital Gain -82.50% 1 Yr Dividend Return N/A 1 Yr Total Return -82.50% Earning Growth (5 yr) 102.90% Average Target Price 0.83(+70.07% ) Average Analyst Rating Buy Fundamental Analysis Bearish Our view of the stock is Bearish with a score of 2.5 out of 10, where 0 is very bearish and 10 very bullish What to like Low volatility The stock’s annual returns have been stable and consistent compared to its sector peers(for a hold period of at least 12 months) and is in the top quartile. Although stability is good, also keep in mind it can limit returns. Underpriced compared to book value The stock is trading low compared to its peers on a price to book value basis and is in the top quartile. It may be underpriced but do check its financial performance to make sure there is no specific reason. Positive free cash flow The company had positive total free cash flow in the most recent four quarters. What to not like Low market capitalization This is among the smaller entities in its sectors with below median market capitalization. That may make it less stable in the long run unless it has a unique technology or market which can help it grow or get acquired in future. Poor risk adjusted returns This company is delivering below median risk adjusted returns in its peers. Even if it is outperforming on returns , the returns are unpredictable. Proceed with caution. Below median dividend returns The company’s average income yield over the past 5 years has been low compared to its peers. However, it is not a problem if you are not looking for income. Overpriced compared to earnings The stock is trading high compared to its peers on a price to earning basis and is above the sector median. Poor return on equity The company management has delivered below median return on equity in the most recent 4 quarters compared to its peers. Highly leveraged The company is in the bottom half compared to its sector peers on debt to equity and is highly leveraged. However, do check the news and look at its sector and management statements. Sometimes this is high because the company is trying to grow aggressively. Negative cashflow The company had negative total cash flow in the most recent four quarters. Overpriced on free cash flow basis The stock is trading high compared to its peers on a price to free cash flow basis. It is priced above the median for its sectors. Proceed with caution if you are considering to buy. Low Earnings Growth This stock has shown below median earnings growth in the previous 5 years compared to its sector
- 2. Page 2 of 9 Any information in this report is not , and should not be regarded as investment advice or as a recommendation regarding any particular security or course of action. We recommend seeking a licensed professional for investment advice. NCU:CA:TSX (Nevada Copper Corp) Copper | | Common Stock Stock Target Advisor Detailed Stock Report Report Date: 19th May, 2022 Adjusted Closing Share Volume Relative Returns Relative Performance (Total Returns) Security Capital Gain Dividend Return Total Return NCU:CA Nevada Copper Corp -83.4% 0 -83.4% XIU:CA iShares S&P/TSX 60 Index ETF +4.4% +2.7% +7.1% Company Overview Nevada Copper Corp. engages in the exploration, development, and operation of mineral properties in Nevada. The company explores for copper, iron magnetite, gold, and silver ores. Its holds 100% interests in the Pumpkin Hollow property located in Nevada, the United States. Nevada Copper Corp. was incorporated in 1999 and is based in Vancouver, British Columbia.
- 3. Page 3 of 9 Any information in this report is not , and should not be regarded as investment advice or as a recommendation regarding any particular security or course of action. We recommend seeking a licensed professional for investment advice. Company Website https://www.nevadacopper.com Address 800 West Pender Street, Vancouver, WA, United States Fiscal Year End December Technical Indicators Value Value Beta 2.10 52 Week High 2.80 Short Ratio 6.76 52 Week Low 0.45 Shorted Shares 2,526,221 200 Day Moving Average 0.78 Shorted Shares Previous Month 1,902,340 50 Day Moving Average 0.63 Shares Held By Insiders 5,934.30% Short Percentage N/A Shares Held by Institutions 3.60 Dividend Yield N/A
- 4. Page 4 of 9 Any information in this report is not , and should not be regarded as investment advice or as a recommendation regarding any particular security or course of action. We recommend seeking a licensed professional for investment advice. NCU:CA:TSX (Nevada Copper Corp) Copper | | Common Stock Stock Target Advisor Detailed Stock Report Report Date: 19th May, 2022 Market Performance Market Performance vs. Industry / Classification (Copper) Market Performance vs. Exchange (Nasdaq Global Select) Value Sector Median Percentile Rank Grade Market Median Percentile Rank Grade YTD Capital Gain -30.99% -15.2% 7% -9.8% 10% Dividend Return N/A 0.1% N/A 1.0% N/A Total Return -30.99% -15.2% 7% -9.2% 10% Trailing 12 Months Capital Gain -82.50% -23.1% 7% -5.7% 1% Dividend Return N/A 0.2% N/A 2.6% N/A Total Return -82.50% -19.7% 7% -4.1% 1% Trailing 5 Years Capital Gain -91.97% 31.2% 8% 5.4% 1% Dividend Return N/A 1.2% N/A 11.4% N/A Total Return -91.97% 44.0% 8% 17.0% 1% Average Annual (5 Year Horizon) Capital Gain -31.81% 35.0% 7% 4.6% 0% Dividend Return N/A 0.3% N/A 1.8% N/A Total Return -31.81% 35.0% 7% 6.3% 0% Risk Return Profile Volatility (Standard Deviation) 32.80% 82.8% 93% 15.9% 26% Risk Adjusted Return -96.97% N/A 7% 40.7% 1% Market Capitalization 0.24B 0.58B 20% 0.51B 46%
- 5. Page 5 of 9 Any information in this report is not , and should not be regarded as investment advice or as a recommendation regarding any particular security or course of action. We recommend seeking a licensed professional for investment advice. Key Financial Ratios Ratios vs. Industry / Classification (Computer Hardware) Ratios vs. Exchange (Nasdaq Global Select) Value Sector Median Percentile Rank Grade Market Median Percentile Rank Grade Market Value peratio 132.5 10.7 7% 13.7 5% pbratio 0.3 1.3 100% 1.5 98% pcfratio -30.2 3.7 93% 7.4 94% pfcfratio 482.4 8.3 8% 9.2 2% Management Effectiveness retequity 0.18% 10.8% 40% 8.9% 33% retinvcap -1.70% 10.0% 27% 4.3% 30% retass -0.26% 6.8% 33% 2.5% 28% debtequityratio 27.69% 27.7% 50% 50.5% 67% Technical Ratios yield N/A 0.3% N/A 3.4% N/A sratio 6.76 4.01 21% 1.76 19% spercent 0.26% 0.9% 69% 2.1% 75% beta 2.10 1.99 43% 1.04 10%
- 6. Page 6 of 9 Any information in this report is not , and should not be regarded as investment advice or as a recommendation regarding any particular security or course of action. We recommend seeking a licensed professional for investment advice. NCU:CA:TSX (Nevada Copper Corp) Copper | | Common Stock Stock Target Advisor Detailed Stock Report Report Date: 19th May, 2022 Recent Analyst Ratings Price Action Rating Action Analyst Rating Price date Maintains Scotiabank Capital Sector Perform CAD 0.8 2022-05-18 Assigns STA Research Speculative Buy CAD 0.75 2022-05-18 Upgrade Haywood Securities Buy CAD 0.8 2022-04-11 Target Down Scotiabank Capital Sector Perform CAD 0.8 2022-04-04 Target STA Research Buy CAD 1 2022-04-04 Target Down Scotiabank Capital Sector Perform CAD 0.85 2021-11-30 Target Down Scotiabank Capital NA CAD 1.25 2021-10-12 Target Lowered by Haywood Securities CAD 2 » CAD 1 2021-10-11 Target Down RBC Royalbank Outperform CAD 2 2021-09-29 Target Up Scotiabank Capital Sector Perform CAD 1.5 2021-09-22 Target Down Scotiabank Capital Sector Perform CAD 0.15 2021-09-02 Target Down RBC Royalbank Outperform CAD 0.5 » CAD 0.25 2021-09-02 Target Down Haywood Securities Buy CAD 0.2 2021-08-17 Target Down National Bank of Canada Financial Sector Perform CAD 0.15 2021-08-17 Target Up Haywood Securities NA CAD 0.3 2021-05-26 Target Up National Bank of Canada Financial Sector Perform CAD 0.3 2021-05-20 Target Lowered by National Bank of Canada Financial Sector Perform CAD 0.25 » CAD 0.2 2021-01-06 Target Up Scotiabank Capital Sector Perform CAD 0.2 2020-12-10 Target Lowered by Scotiabank Capital CAD 0.2 » CAD 0.15 2020-11-12 Upgraded by Scotiabank Capital Sector Perform » Outperform CAD 0.2 » CAD 0.25 2020-07-28 Target Lowered by Scotiabank Capital CAD 0.3 » CAD 0.2 2020-04-15 Target Lowered by Scotiabank Capital CAD 0.5 » CAD 0.3 2020-04-08 Target Lowered by National Bank of Canada Financial Sector Perform CAD 0.3 » CAD 0.25 2020-03-30 Target Lowered by Haywood Securities CAD 0.6 » CAD 0.25 2020-03-24 Downgraded by National Bank of Canada Financial Outperform » Sector Perform CAD 0.7 » CAD 0.3 2020-03-23
- 7. Page 7 of 9 Any information in this report is not , and should not be regarded as investment advice or as a recommendation regarding any particular security or course of action. We recommend seeking a licensed professional for investment advice. NCU:CA:TSX (Nevada Copper Corp) Copper | | Common Stock Stock Target Advisor Detailed Stock Report Report Date: 19th May, 2022 Annual Financial (CAD)
- 8. Page 8 of 9 Any information in this report is not , and should not be regarded as investment advice or as a recommendation regarding any particular security or course of action. We recommend seeking a licensed professional for investment advice. NCU:CA:TSX (Nevada Copper Corp) Copper | | Common Stock Stock Target Advisor Detailed Stock Report Report Date: 19th May, 2022 Quarterly Financial (CAD)
- 9. Page 9 of 9 Any information in this report is not , and should not be regarded as investment advice or as a recommendation regarding any particular security or course of action. We recommend seeking a licensed professional for investment advice. NCU:CA:TSX (Nevada Copper Corp) Copper | | Common Stock Stock Target Advisor Detailed Stock Report Report Date: 19th May, 2022 Largest Industry Peers for Copper Symbol Company Name Price(Change) Market Cap FM:CA First Quantum Minerals Ltd -2.00 (-5.5%) CAD 25.31B KAT:CA Katanga Mining Limited N/A CAD 9.49B LUN:CA Lundin Mining Corporation -0.38 (-3.6%) CAD 8.20B TRQ:CA Turquoise Hill Resources Ltd -1.76 (-4.9%) CAD 7.23B CS:CA Capstone Mining Corp -0.25 (-5.0%) CAD 3.43B HBM:CA Hudbay Minerals Inc -0.33 (-4.5%) CAD 1.93B ERO:CA Ero Copper Corp -0.36 (-2.4%) CAD 1.35B AYM:CA Atalaya Mining Plc +0.35 (+6.1%) CAD 0.80B TKO:CA Taseko Mines Limited -0.06 (-2.9%) CAD 0.58B CMMC:CA Copper Mountain Mining Corpora.. -0.22 (-8.1%) CAD 0.57B The Stock Target Advisor platform run millions of calculations every day on over 30,000 Canadian and American stocks, comparing and ranking their financial and market performance against their sectors and exchange. We represent the percentile ranking using the following grading system. Letter Grade Percentage Letter Grade Percentage Letter Grade Percentage A+ 97%-100% A 93%-96% A- 90%-92% B+ 97%-89% B 83%-86% B- 80%-82% C+ 77%-79% C 73%-76% C- 70%-72% D+ 67%-69% D 63%-66% D- 60%-62% F 0%-59%