HLEG thematic workshop on Measuring Trust and Social Capital, 10 June 2016, Paris, France. More information at: www.oecd.org/statistics/measuring-economic-social-progress/hleg-workshop-on-measuring-trust-and-social-capital-2016.htm
2. www.qog.pol.gu.se
Overview
• Definitions and measures of institutional quality: focus on corruption
• Critiques of current measures
• Evalutation of perceptions measures using new survey data
• Brief thoughts on advantages/disadvantages of using survey methods
• Very brief results on relationship between institutional quality & trust at sub-
national level
3. www.qog.pol.gu.se
Defining ’corruption’ and how we measure it
• Broadly defined as: ‘the sale by government officials of government property for
personal gain’. (Shleifer and Vishny, 1993: 2)
• Like trust/ social capital, corruption difficult to measure (but for some different reasons).
• Clandestine nature makes direct measurement almost impossible
• Occurs at many levels (petty to grand corruption) & varies by sector (Gingrich 2013)
• Shown to ’matter’ for a host of socio-ecnomic outcomes of interest
Mainly applied measures thus far:
• survey methods:
a. ’perceptions’ – experts, NGO’s, citizens – World Bank, CPI
b. tracking experiences (bribery) – TI’s Global Barometer
2. ’objective’
a. direct: convictions or charges,
b. risk measures: (procurment competition, infrastructure spending deviations)
4. www.qog.pol.gu.se
Our contribution at QOG measuring institutions: EQI
European Quality of Government Index
(EQI – Charron, Lapuente & Rothstein
2013; Charron, Dijkstra & Lapuente
2015)
-QoG = public sector with low
corrupiton, high imparitality and quality
services
-combines 16 survey indicators of these
3 concepts in several sectors
-items are based on perceptions &
experiences of citizens (85,000)
-strongly correlated with many
indicators of development; trust
5. www.qog.pol.gu.se
How well do corruption perception measures reflect actual
levels of public sector corruption?
• Many argue not very well, in particular the widely used perceptions measures…
puts valid inferences into question
• They reflect somthing other than corruption (Kurtz & Shrank 2007), too complex
(Politt 2011), based on Western understanding of corruption (Thomas 2009) or
problematic in time series (Andersson & Heywood 2009)
• Whole country bias (Charron et al 2014)
• Expert assessments don’t match citizen experiences (Razafindrakoto and Roubaud,
2010)
• Citizen perceptions don’t match citizen experiences (Olken 2009; Rose & Mishler
2010)
2 questions:
1.are these too ‘noisy’ to be used as valid cross-national/regional metrics?
2. are expert and citizen assessments of corruption consistent across countries?
6. www.qog.pol.gu.se
Assessing some of these questions
• Use of 2 large surveys which track corruption, impartiality and quality of public services in
European countries (’European Quality of Government Index ’EQI’ – Charron et al, 2014 &
2015).
• 34,000 & 85,000 randomly selected citizen respondents, 200 & 400 sampled in REGIONS
(nuts 2) within 18 & 24 contries respectively. 35 questions in total:
• 4 questions about corruption perceptions – health, education, law, others bribe
• 4 questions about corruption experience (petty bribery)
Europe as a case – 'reverse Sanatra', if not valid here, where?
5 main tests of validity I'll discuss:
1.Compare the RANKINGS of countries and regions: with & without experience
2.Correlations with perceptions/experience regression residuals & outside factors
3.Compare expert country rankings with those produced by citizens
4.Compare with objective corruption risk measures
5.Rasch analysis – equivilance of questions across countries, question scaling
7. www.qog.pol.gu.se
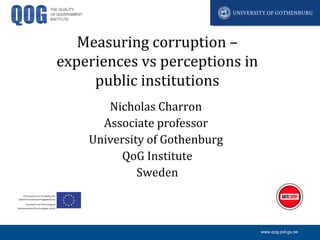
1: comparison of rankings
• Perceptions measures are about
relative comparisons, RANKINGS, etc.
- not necessarily about exact
numbers
• split our samples into those that have
paid a bribe, and those that have not,
and compare the corruption
perceptions between those two
groups
• what do we see? Pretty consistent
rankings of countries and even
regions
Austria
Belgium
Bulgaria
Croatia
Czech Republic
DenmarkFinland
France
Germany
Greece
Hungary
Ireland
Italy
Netherlands
Poland
Portugal
Romania
Serbia
Slovakia
Spain
Sweden
Turkey
Ukraine
UK
Kosovo
beta: 0.85
s.e: 0.11
Rsq: 0.71
234567
corruptionperceptionsinaggregatedsamplewithoutexperience
3 4 5 6 7 8 9
corruption perceptions in aggregated sample with experience
FR10
FR21 FR22
FR23
FR24
FR25
FR26
FR30
FR41
FR42FR43FR51
FR52FR53FR61FR62FR63FR71FR72
FR81
FR82
FR83
FR91
FR92FR93FR94
BG31
BG32
BG33
BG34
BG41
BG42
PT11
PT15
PT16 PT17
PT18
PT20
PT30
DK01 DK05
SE1SE2 SE3
BE1
BE2
BE3
HR03
HR04
GR1GR2GR3
GR4
DE1
DE2 DE3 DE4DE5DE6DE7DE8DE9 DEADEB DECDED
DEE
DEF
DEG
ITC1
ITC2
ITC3ITC4
ITD1ITD2
ITD3
ITD4
ITD5ITE1
ITE2ITE3
ITE4
ITF1
ITF2
ITF3
ITF4
ITF5
ITF6
ITG1
ITG2 ES11
ES12
ES13 ES21ES22
ES23
ES24ES30ES41 ES42
ES43
ES51 ES52ES53
ES61
ES62
ES70
UKCUKD UKE
UKFUKG
UKH UKI UKJ
UKKUKLUKM UKN
HU1HU2HU3
CZ01
CZ02
CZ03
CZ04
CZ05CZ06
CZ07
CZ08
SK01SK02SK03
SK04
RO11
RO12
RO21
RO22RO31
RO32
RO41RO42
AT11
AT12
AT13
AT21AT22
AT31
AT32 AT33
AT34
NL11 NL12NL13NL21
NL22
NL23NL31
NL32NL33NL34NL41
NL42
PL11PL12PL21
PL22
PL31PL32PL33
PL34
PL41
PL42PL43
PL51
PL52PL61PL62PL63
FI13 FI18 FI19FI1A
FI20
IE01
IE02
TR1
TR2
TR3
TR4
TR5
TR6
TR7
TR8 TR9
TRA
TRB
TRC
RS11
RS21
RS22
RS22
RS23
Kharkov
Zakarpatt
Odessa
CrimeaKiev
Lviv
Rsq: 0.62
obs: 209
02468
perceptionsofthosewithoutcorruptionexp.
0 2 4 6 8 10
perceptions of those with corruption exp.
Aggregated responses: samples with vs. without corruption experience
Perceptions of Corruption in European Regions
8. www.qog.pol.gu.se
2: how much outside noise?
Two tests:
1.Aggregate perceptions by country &
region for split samples of citizens with
& without experience. Regress non-
experience on experience,
2.Aggregate mean perceptions &
proportion of respondents with
experience by country & region.
Regress perceptions mean on
experience proportion,
-look at correltions of residuals &
outside factors
Beta (p-value) R² obs
COUNTRY LEVEL
PPP p.c. (log) -0.02 (0.92) 0.005 23, 24
Econ. Ineq. 0.04 (0.15) 0.09 23, 24
Gender pay gap 6.05 (0.11) 0.13 23, 24
Unemployment (%) 0.02 (0.46) 0.05 23, 24
Pop. Denistiy (log) -0.21 (0.09) 0.14 23, 24
ethno-linguistic frac. -1.61 (0.39) 0.03 23, 24
Life expectancy 0.02 (0.52) 0.02 23, 24
political rights 0.06 (0.52) 0.002 23, 24
press freedom -0.02 (0.73) 0.005 23, 24
corruption (CPI) -0.03 (0.67) 0.008 23, 24
REGIONAL LEVEL
PPP p.c. (log, 2007-09 ave) 0.01(.06) 0.002 186
Econ. Inequality -.003(.79) 0.02 178
Unemployment 0.009(.11) 0.01 209
Pop. Density (log) -0.002(.99) 0.0001 186
% non-EU born(log) -0.003(.96) 0.0001 180
Life Expectancy -0.004(.74) 0.0006 186
capital region (0/1) 0.14(.21) 0.01 209
autonomous (0/1) -0.20(.11) 0.01 209
Socio-economic factors
Demographic factors
Geo-political factors
Political factors
Economic factors
Demographic factors
9. www.qog.pol.gu.se
3. EXPERTS VS CITIZEN PERCEPTIONS: 24 COUNTRIES
24
23
22
21
20
19
18
17
16
15
14
13
12
11
10
9
8
7
6
5
4
3
2
1
DK
FI
IE
NL
UK
SE
DE
AT
PL
TR
BE
ES
FR
IT
HU
CZ
PT
BG
RO
GR
SK
HR
RS
UA
Citizen Percep. CPI
WGI ICRG
Citizen Exp.
12. www.qog.pol.gu.se
5. Rasch Analysis (Annoni & Charron 2016)
• Used in education in psycology to assess validity of a set test/ survey questions
designed to measure an underlying latent concept
• Data driven method, model assumed to be ’correct’
• Can help us test:
- ’equivilance’ across countries, other categories
- If the scaling is appropriate (or if we have too many categories, nuetral category,)
- Internal consistancy of the individual components, how they cluster
Key findings:
-corruption questions proved equivilant across all countries.
-scaling issues: eliminate nuetral category and reduce scale
-identified one question that can be exchanged next round
13. www.qog.pol.gu.se
Some general conclusions
• Corruption (& related QoG concepts) are latent, multifaceted, clandestine and
thus will never completely be observable in total.
• Given a well-crafted survey, it is efficient (time-wise) in data collection, Gives
policy-makers a ’snap-shot’ of what citizens think in the aggregate
• citizens compliment to measures based on ’expert’ assessments
• Analysis shows that perceptions measures (in Europe) maybe slightly less
problematic than some argue
• Tougher to use in over time analyses, as ‘benchmark’ measure of progress
• Attention away from country means
• Perceptions matter! (stock market, elections, etc. often driven by expectations of
what others will do…)
• Policy vs research: certain research questions, a perception/experienced based
citizen (or expert) survey meausure is prefered to an objective measure alternative
14. www.qog.pol.gu.se
Relationship with social trust
• ’informal institutions’
• Both concepts very important in
explaining growth, development,
inequality, etc.
• Similar methods and pitfalls of
measurment
• 2013 EQI asked the binary ’trust others’
question
• Measures are strongly linked, across and
within countries..