Downloaded 24 times
![Institute of Technology of Cambodia 2016-2017 Case study: Smartphone Preference
1). Khen Chanthorn 2). Kech Sengthai 3). Ken Keomhong 4). Kam Chanreaksmee
5). Kry Reothea
3
Problems:
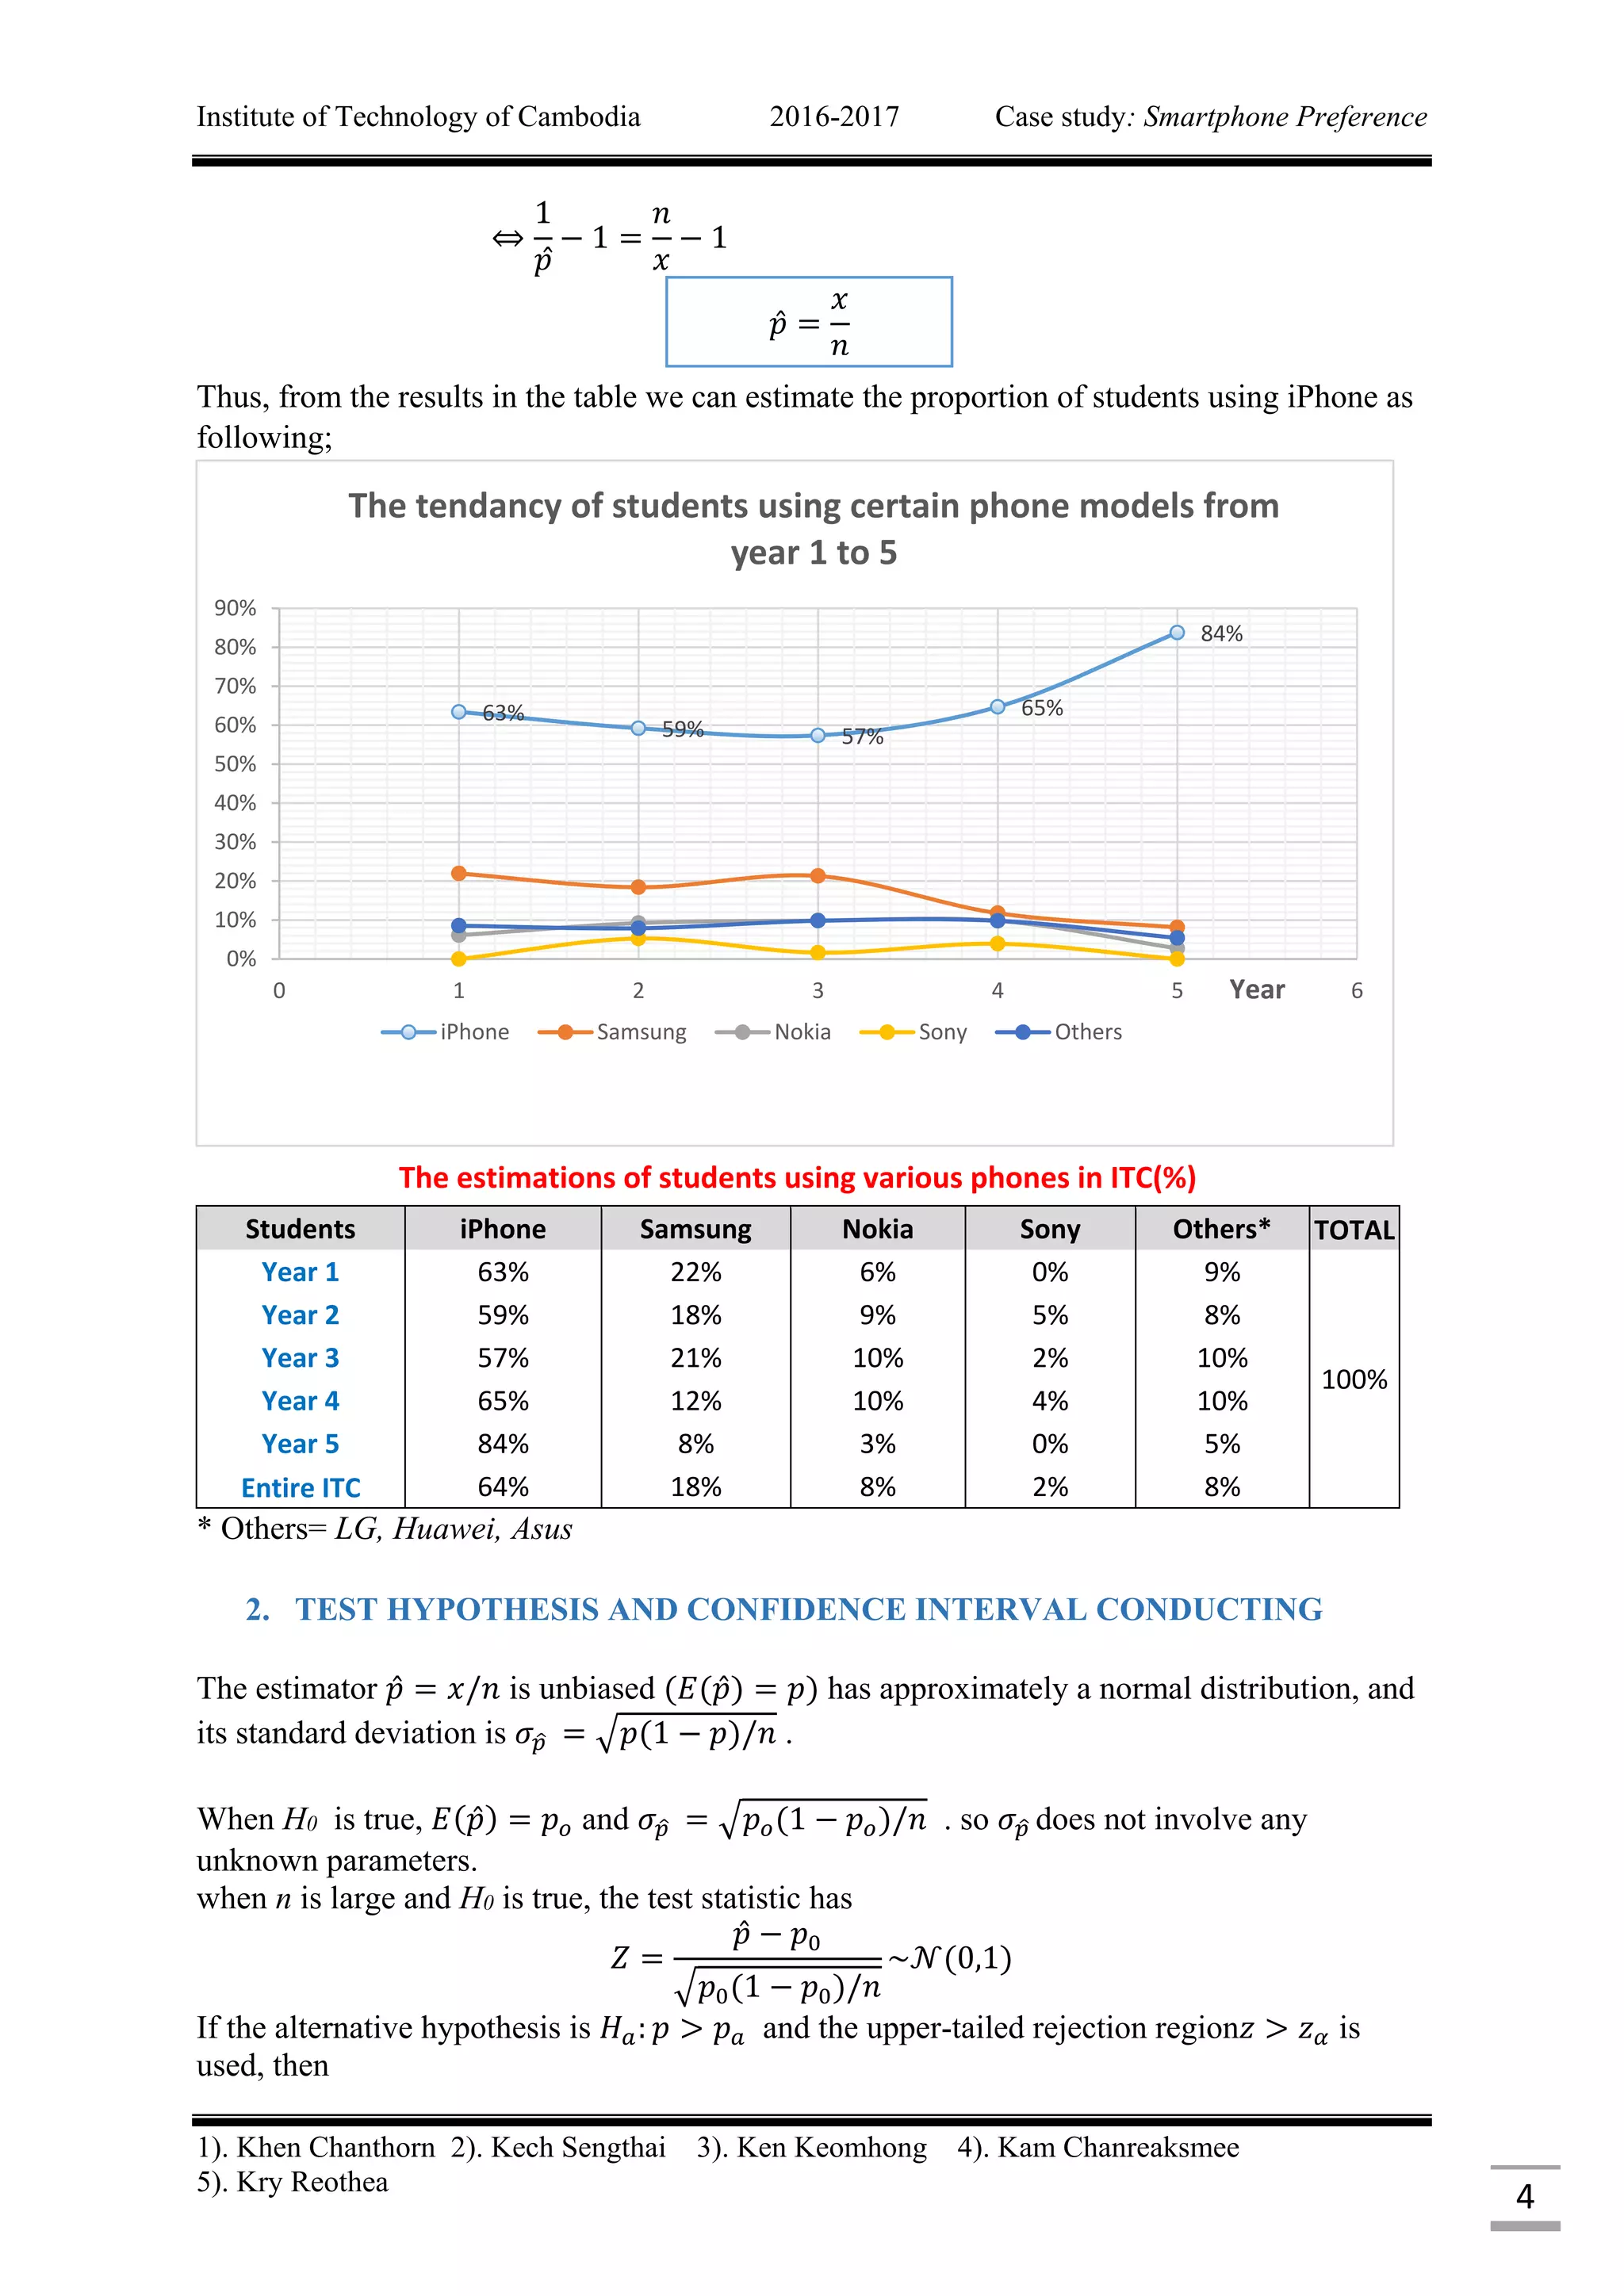
In order to know the preference of the student in ITC in using Smartphone, we decided to do
a survey among 307 students from year 1st
to year 5th
randomly. After surveying, the results
showed that the numbers of students who use iPhone, Samsung, Nokia, Sony and other
models is respectively listed as the table below.
Data of students using different phones models
Phone Type
Students
iPhone Samsung Nokia Sony other Total
Year 1 52 18 5 0 7 82
Year 2 45 14 7 4 6 76
Year 3 35 13 6 1 6 61
Year 4 33 6 5 2 5 51
Year 5 31 3 1 0 2 37
Total 196 54 24 7 26 307
* Others= Huawei, LG, ASUS
II. ANALYSIS OF DATA
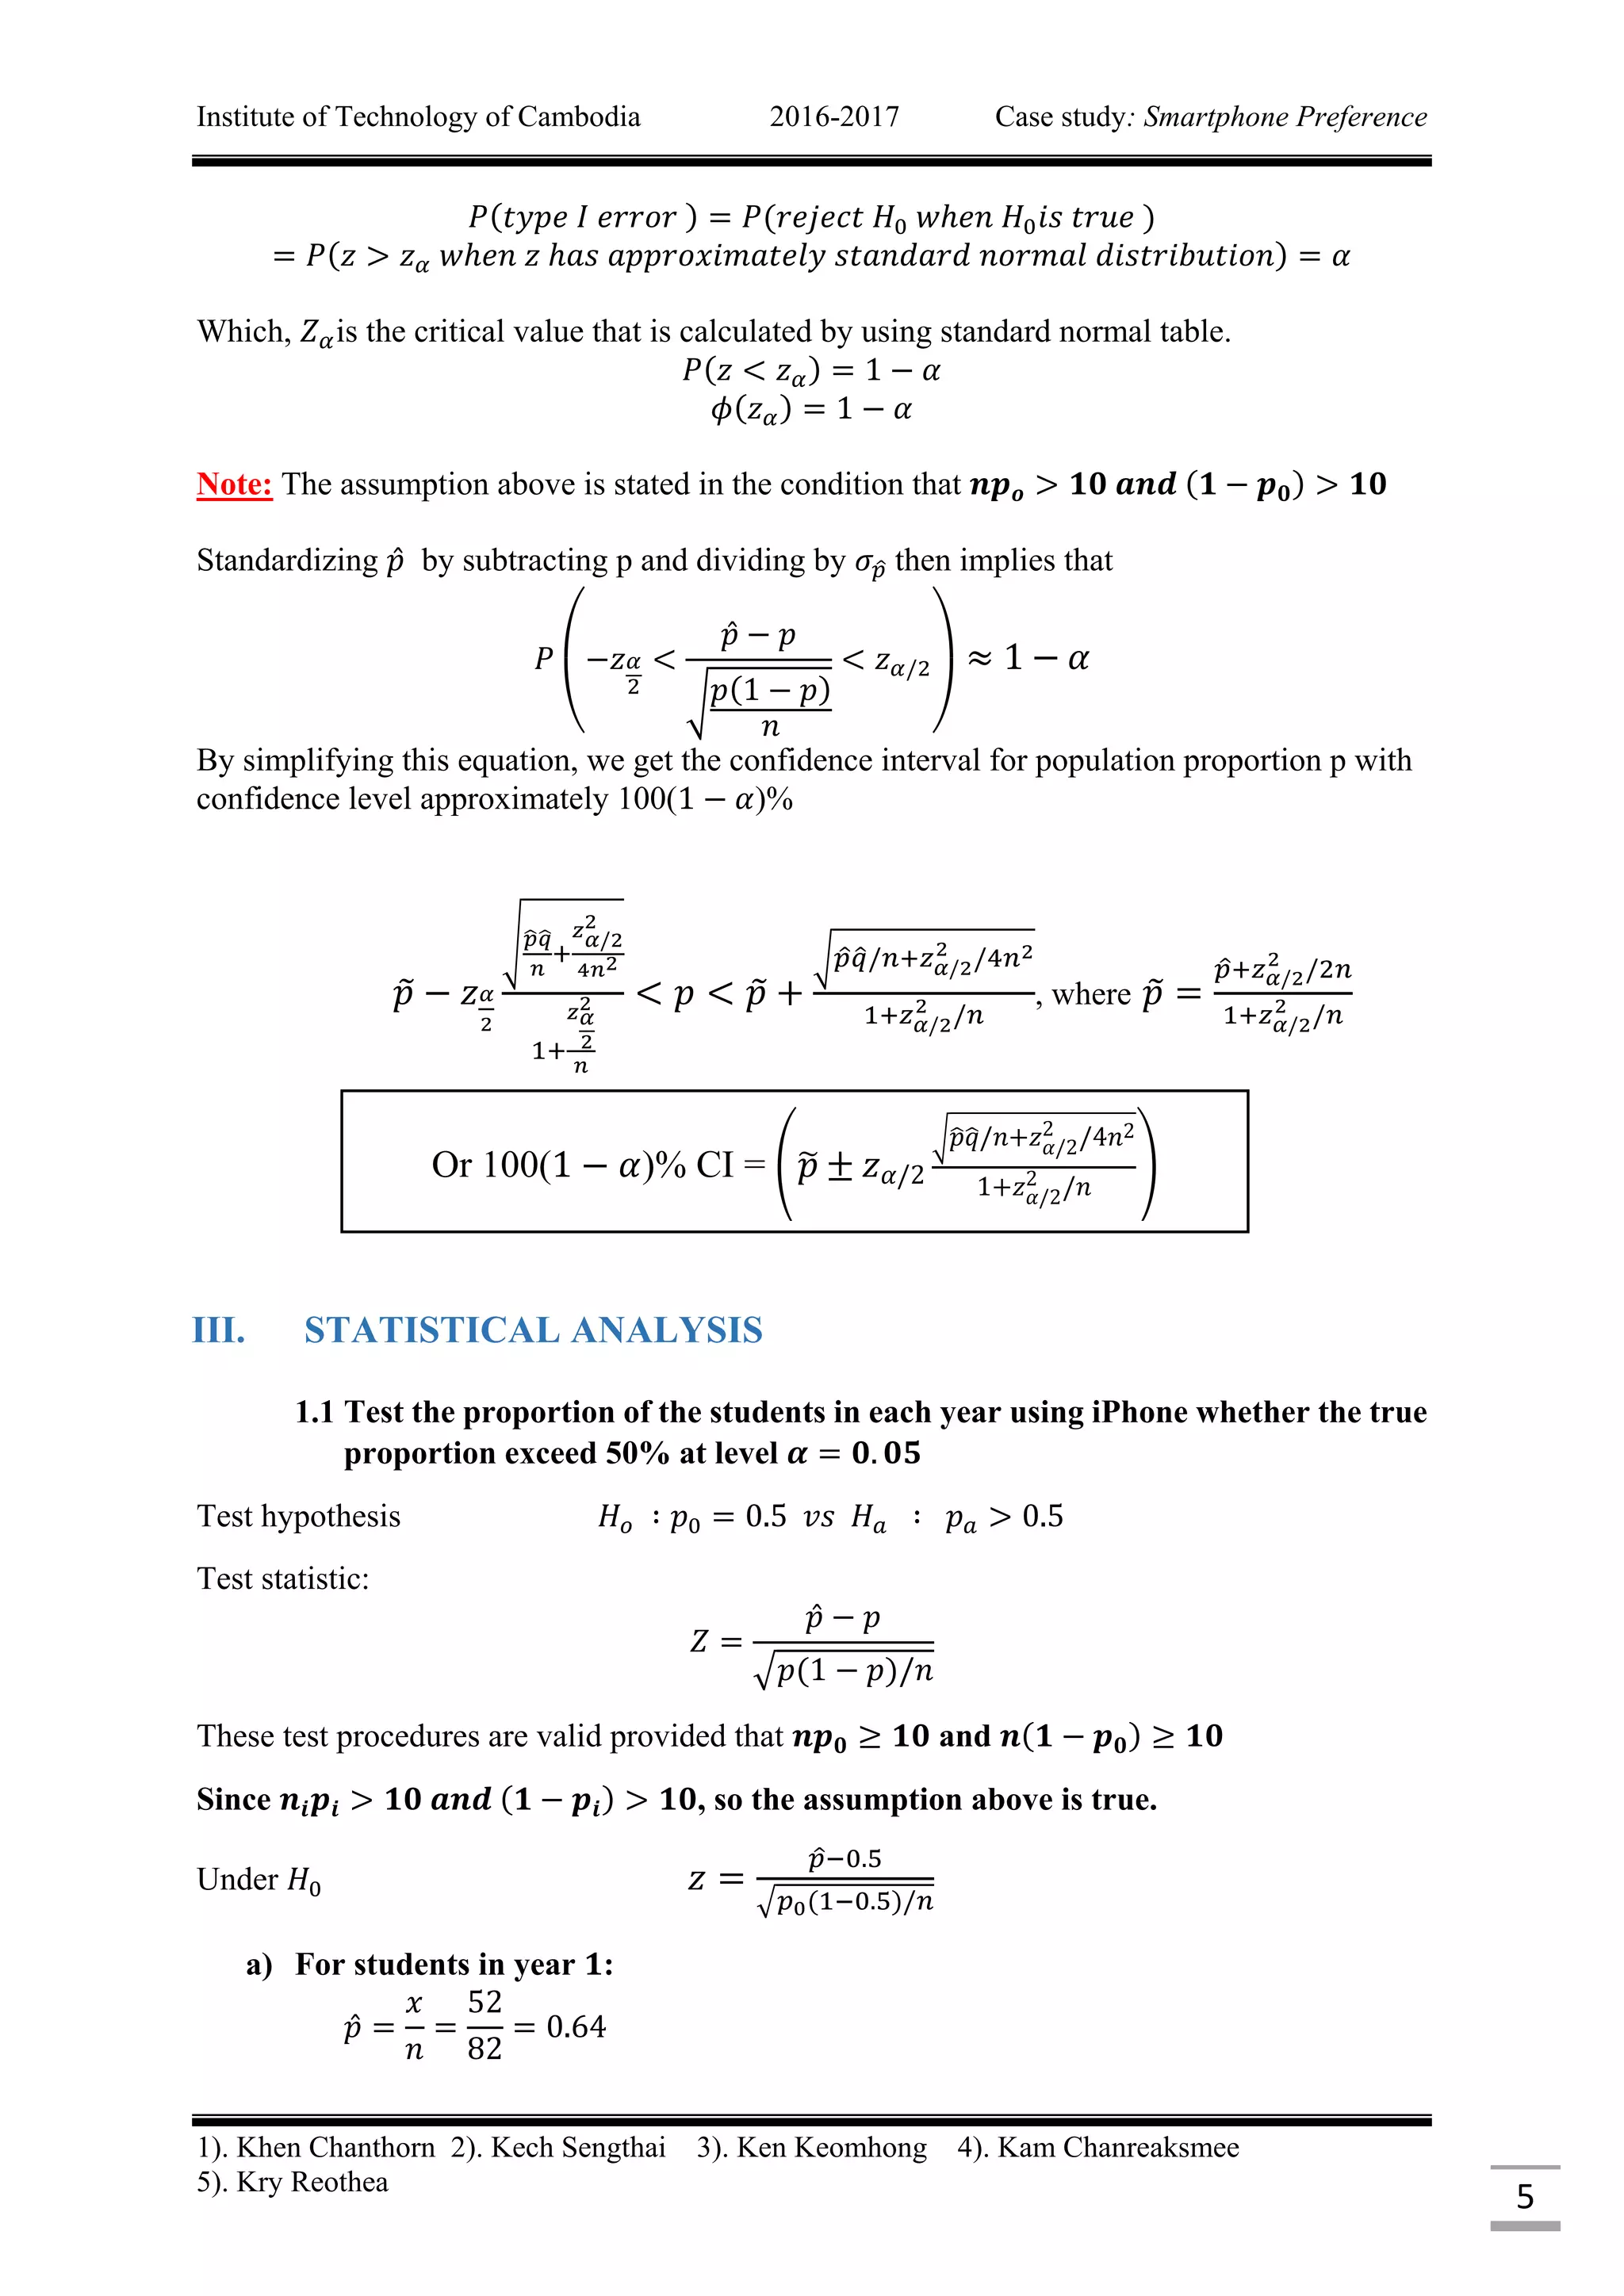
1. THEORY AND ASSUMPTION
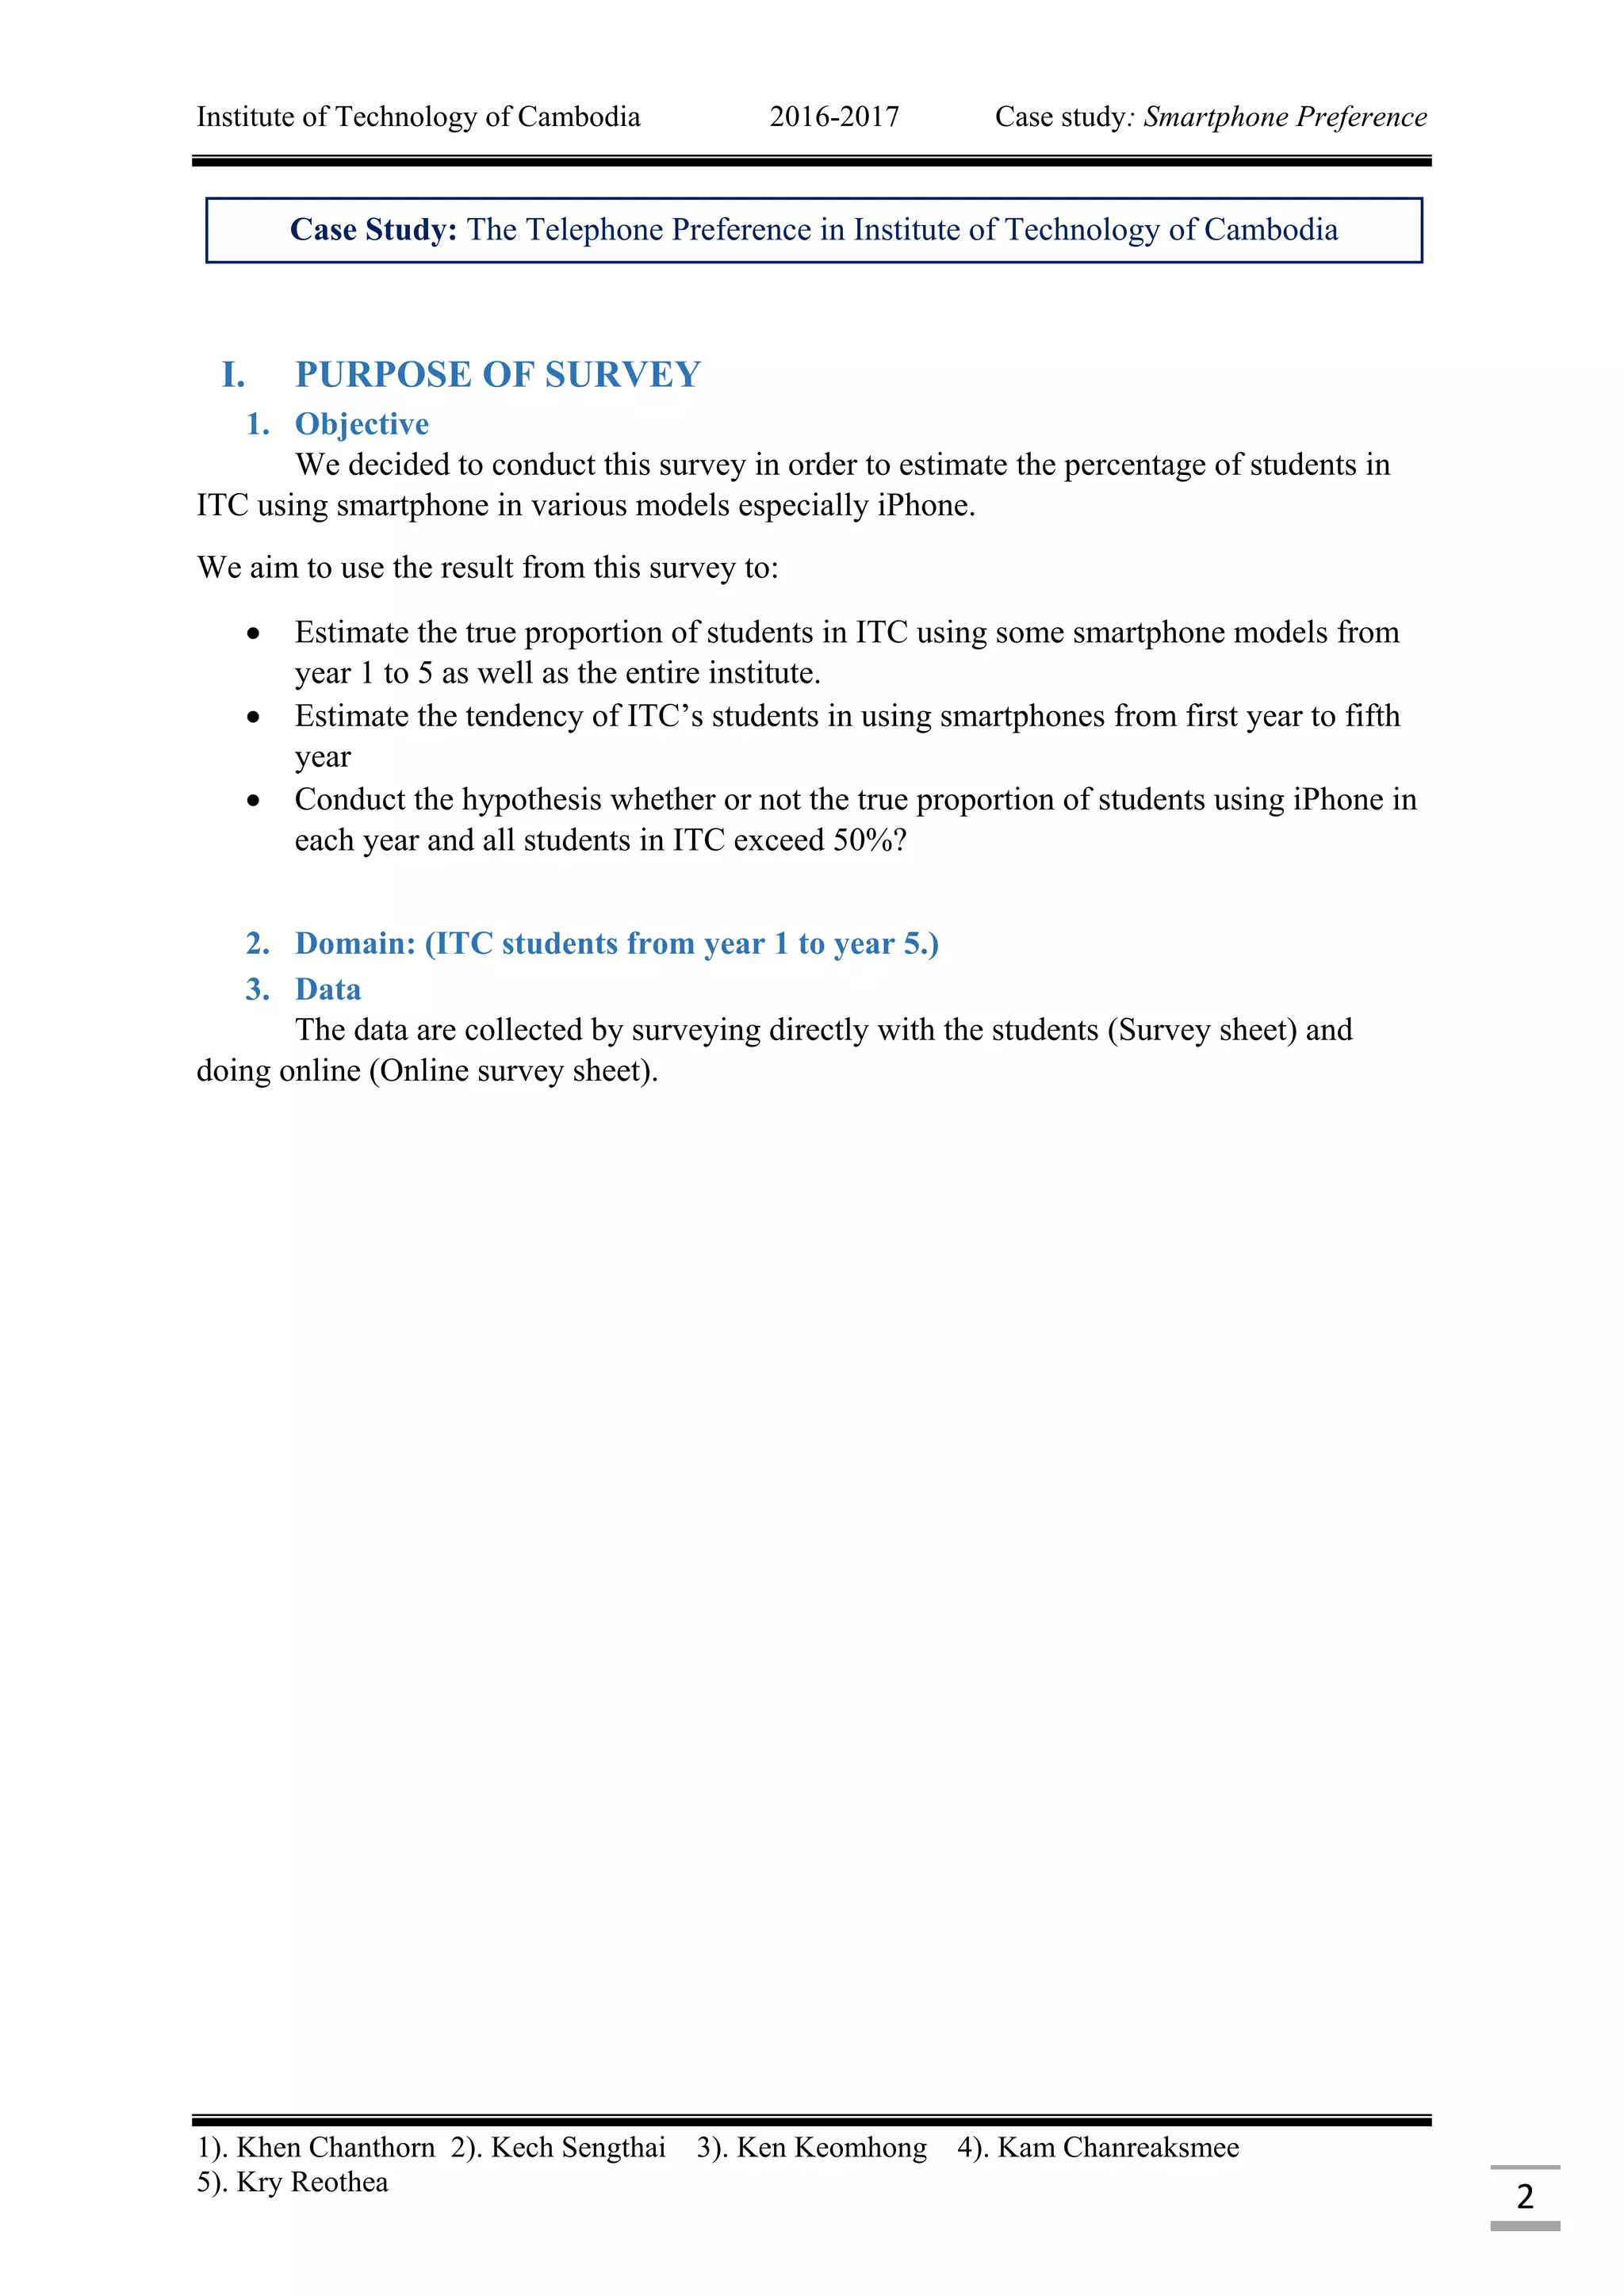
1.1 Estimate the percentage of the students using iPhone in each year and the
entire institute:
The results of the test are in the Binomial’s distribution which hold the pmf
p(x) = 𝑝 𝑥
(1 − p) 𝑛−𝑥
In order to conduct the estimator for the proportion, we apply the Maximum Likelihood
Estimator’s theorem(MLE) for the pmf above, then;
𝑙𝑛[𝑝(𝑥)] = 𝑥𝑙𝑛(𝑝) + (𝑛 − 𝑥)𝑙𝑛(1 − 𝑝)
⇒
𝑑
𝑑𝑝
(ln[𝑝(𝑥)]) =
𝑥
𝑝
−
𝑛 − 𝑥
1 − 𝑝
= 0
52
45
35 33 31
18
14 13
6
35 7 6 5
10
4
1 2 0
7 6 6 5
2
0
10
20
30
40
50
60
Year 1 Year 2 Year 3 Year 4 Year 5
NUMBEROFSTUDENTS
Number of students using various phone models
Iphone Samsung Nokia Sony other](https://image.slidesharecdn.com/case-study-170126133816/75/Case-study-Probability-and-Statistic-3-2048.jpg)
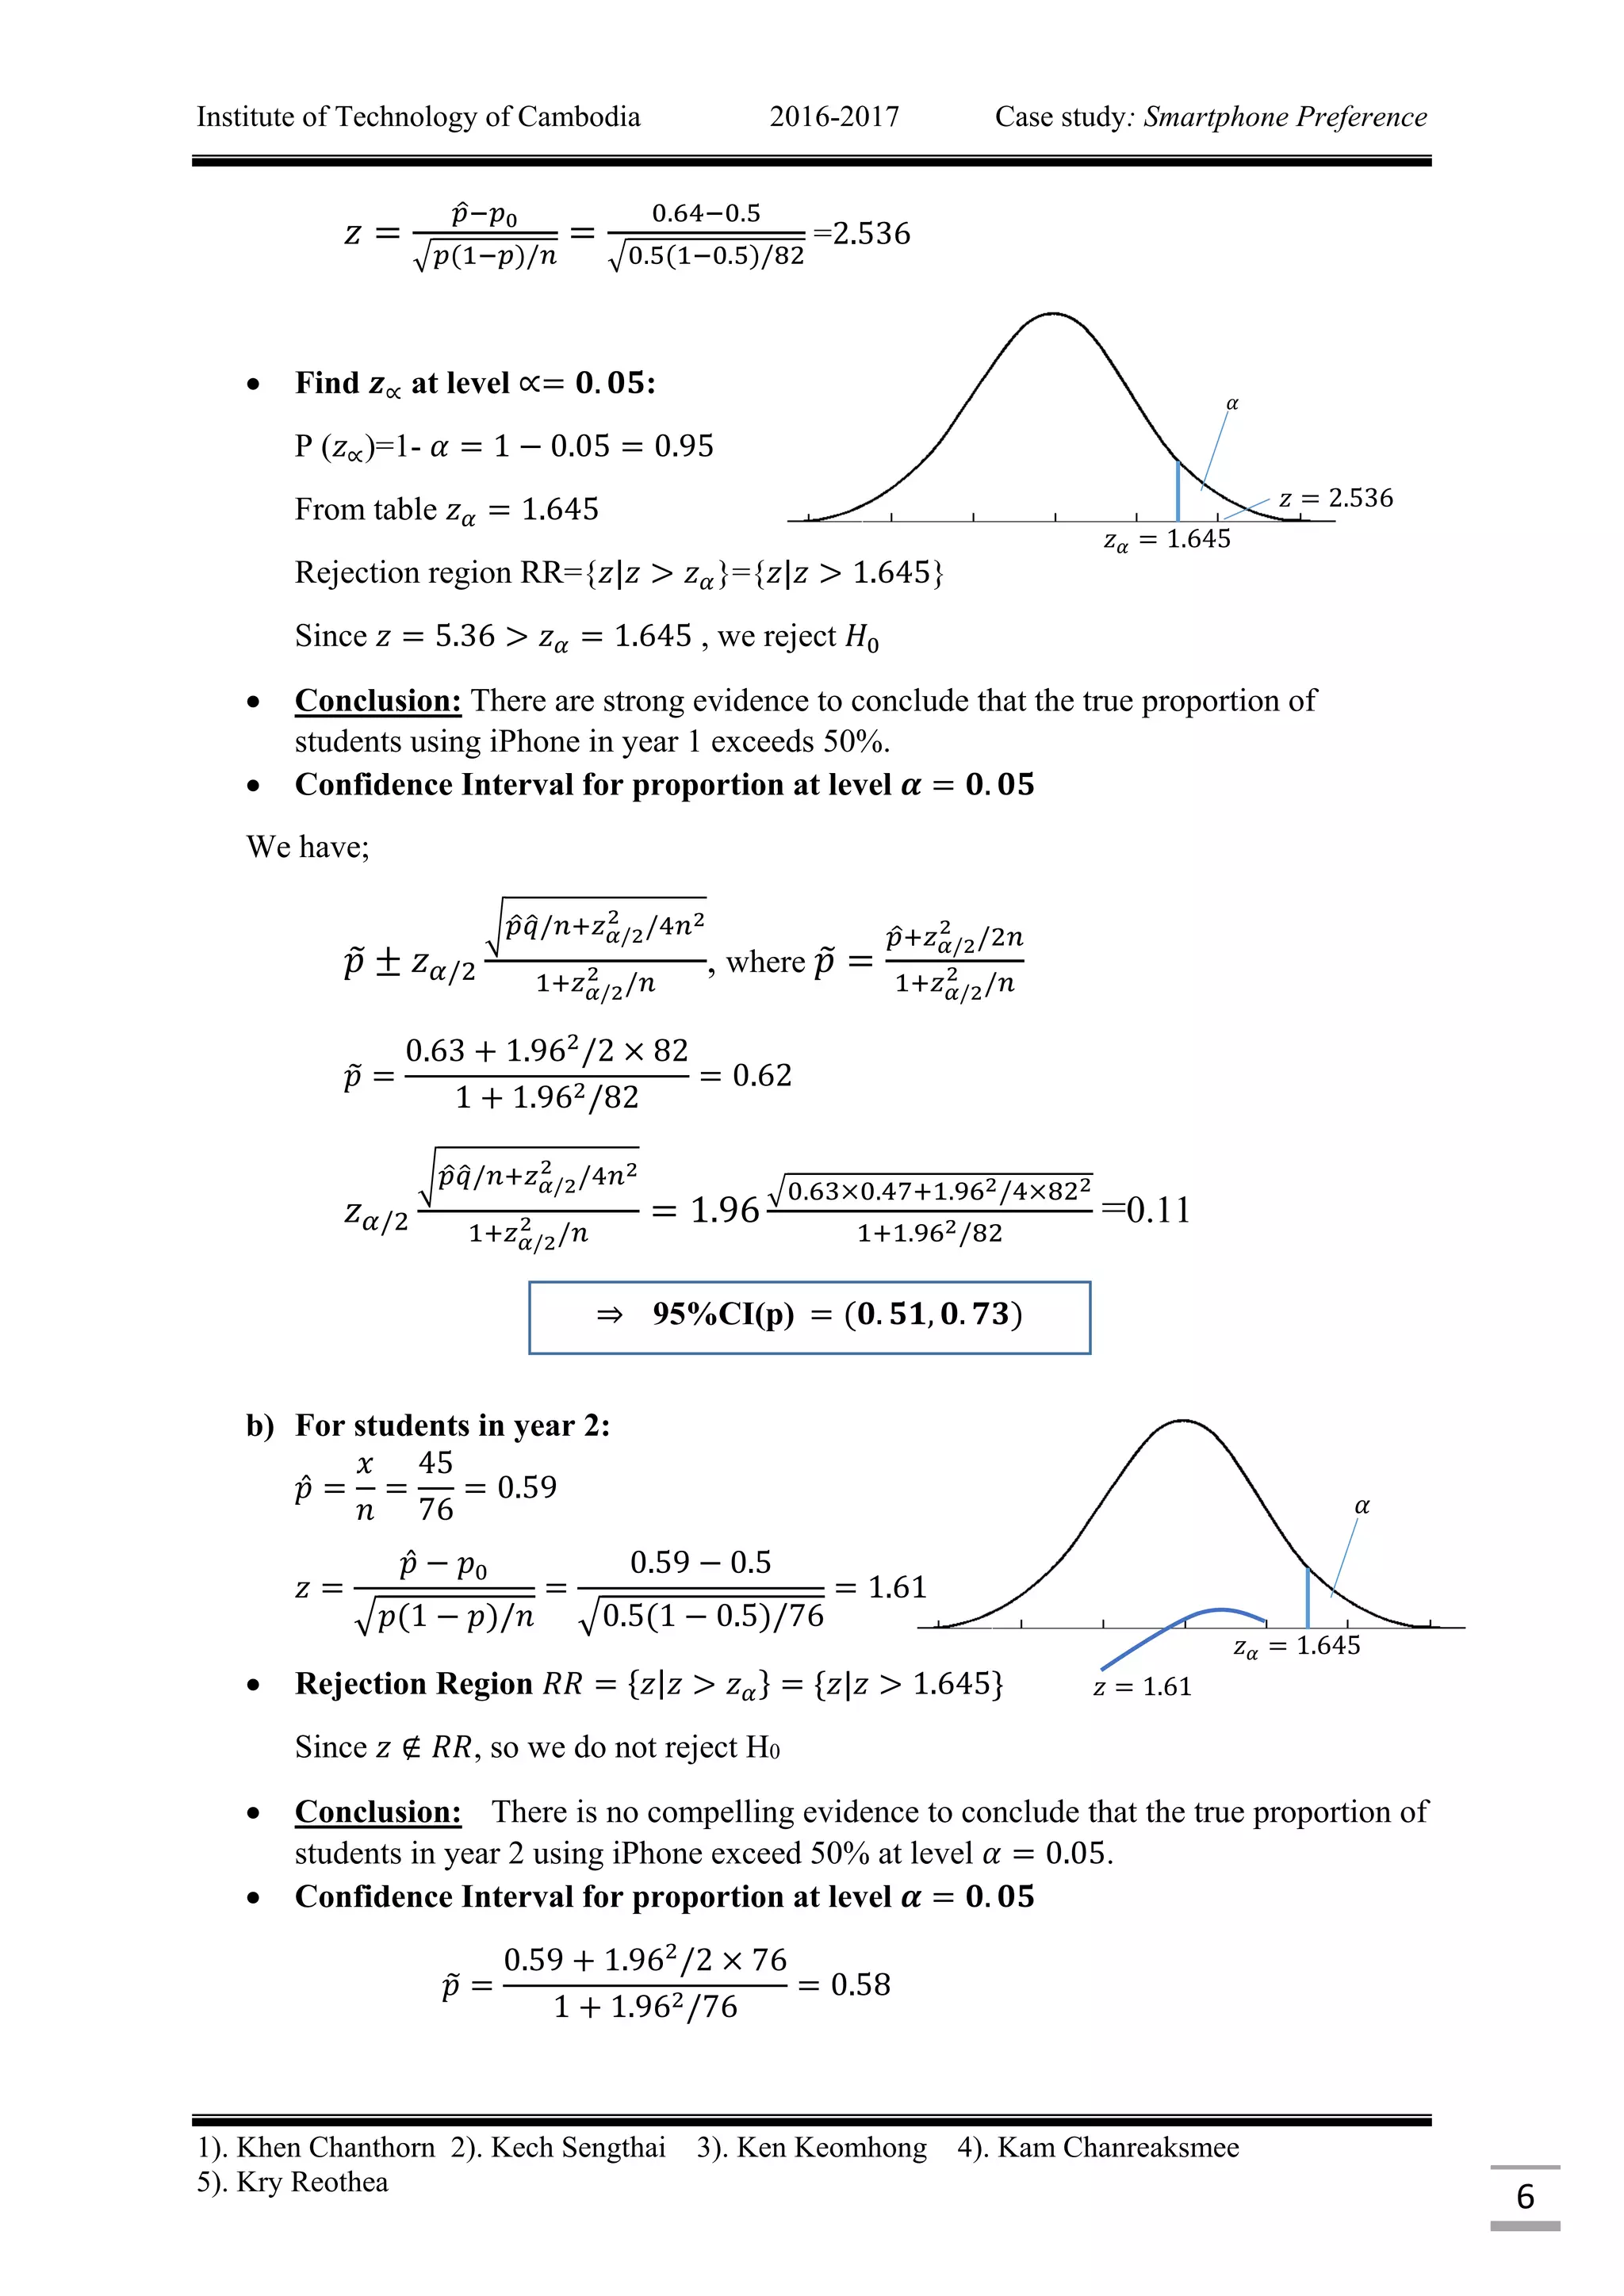
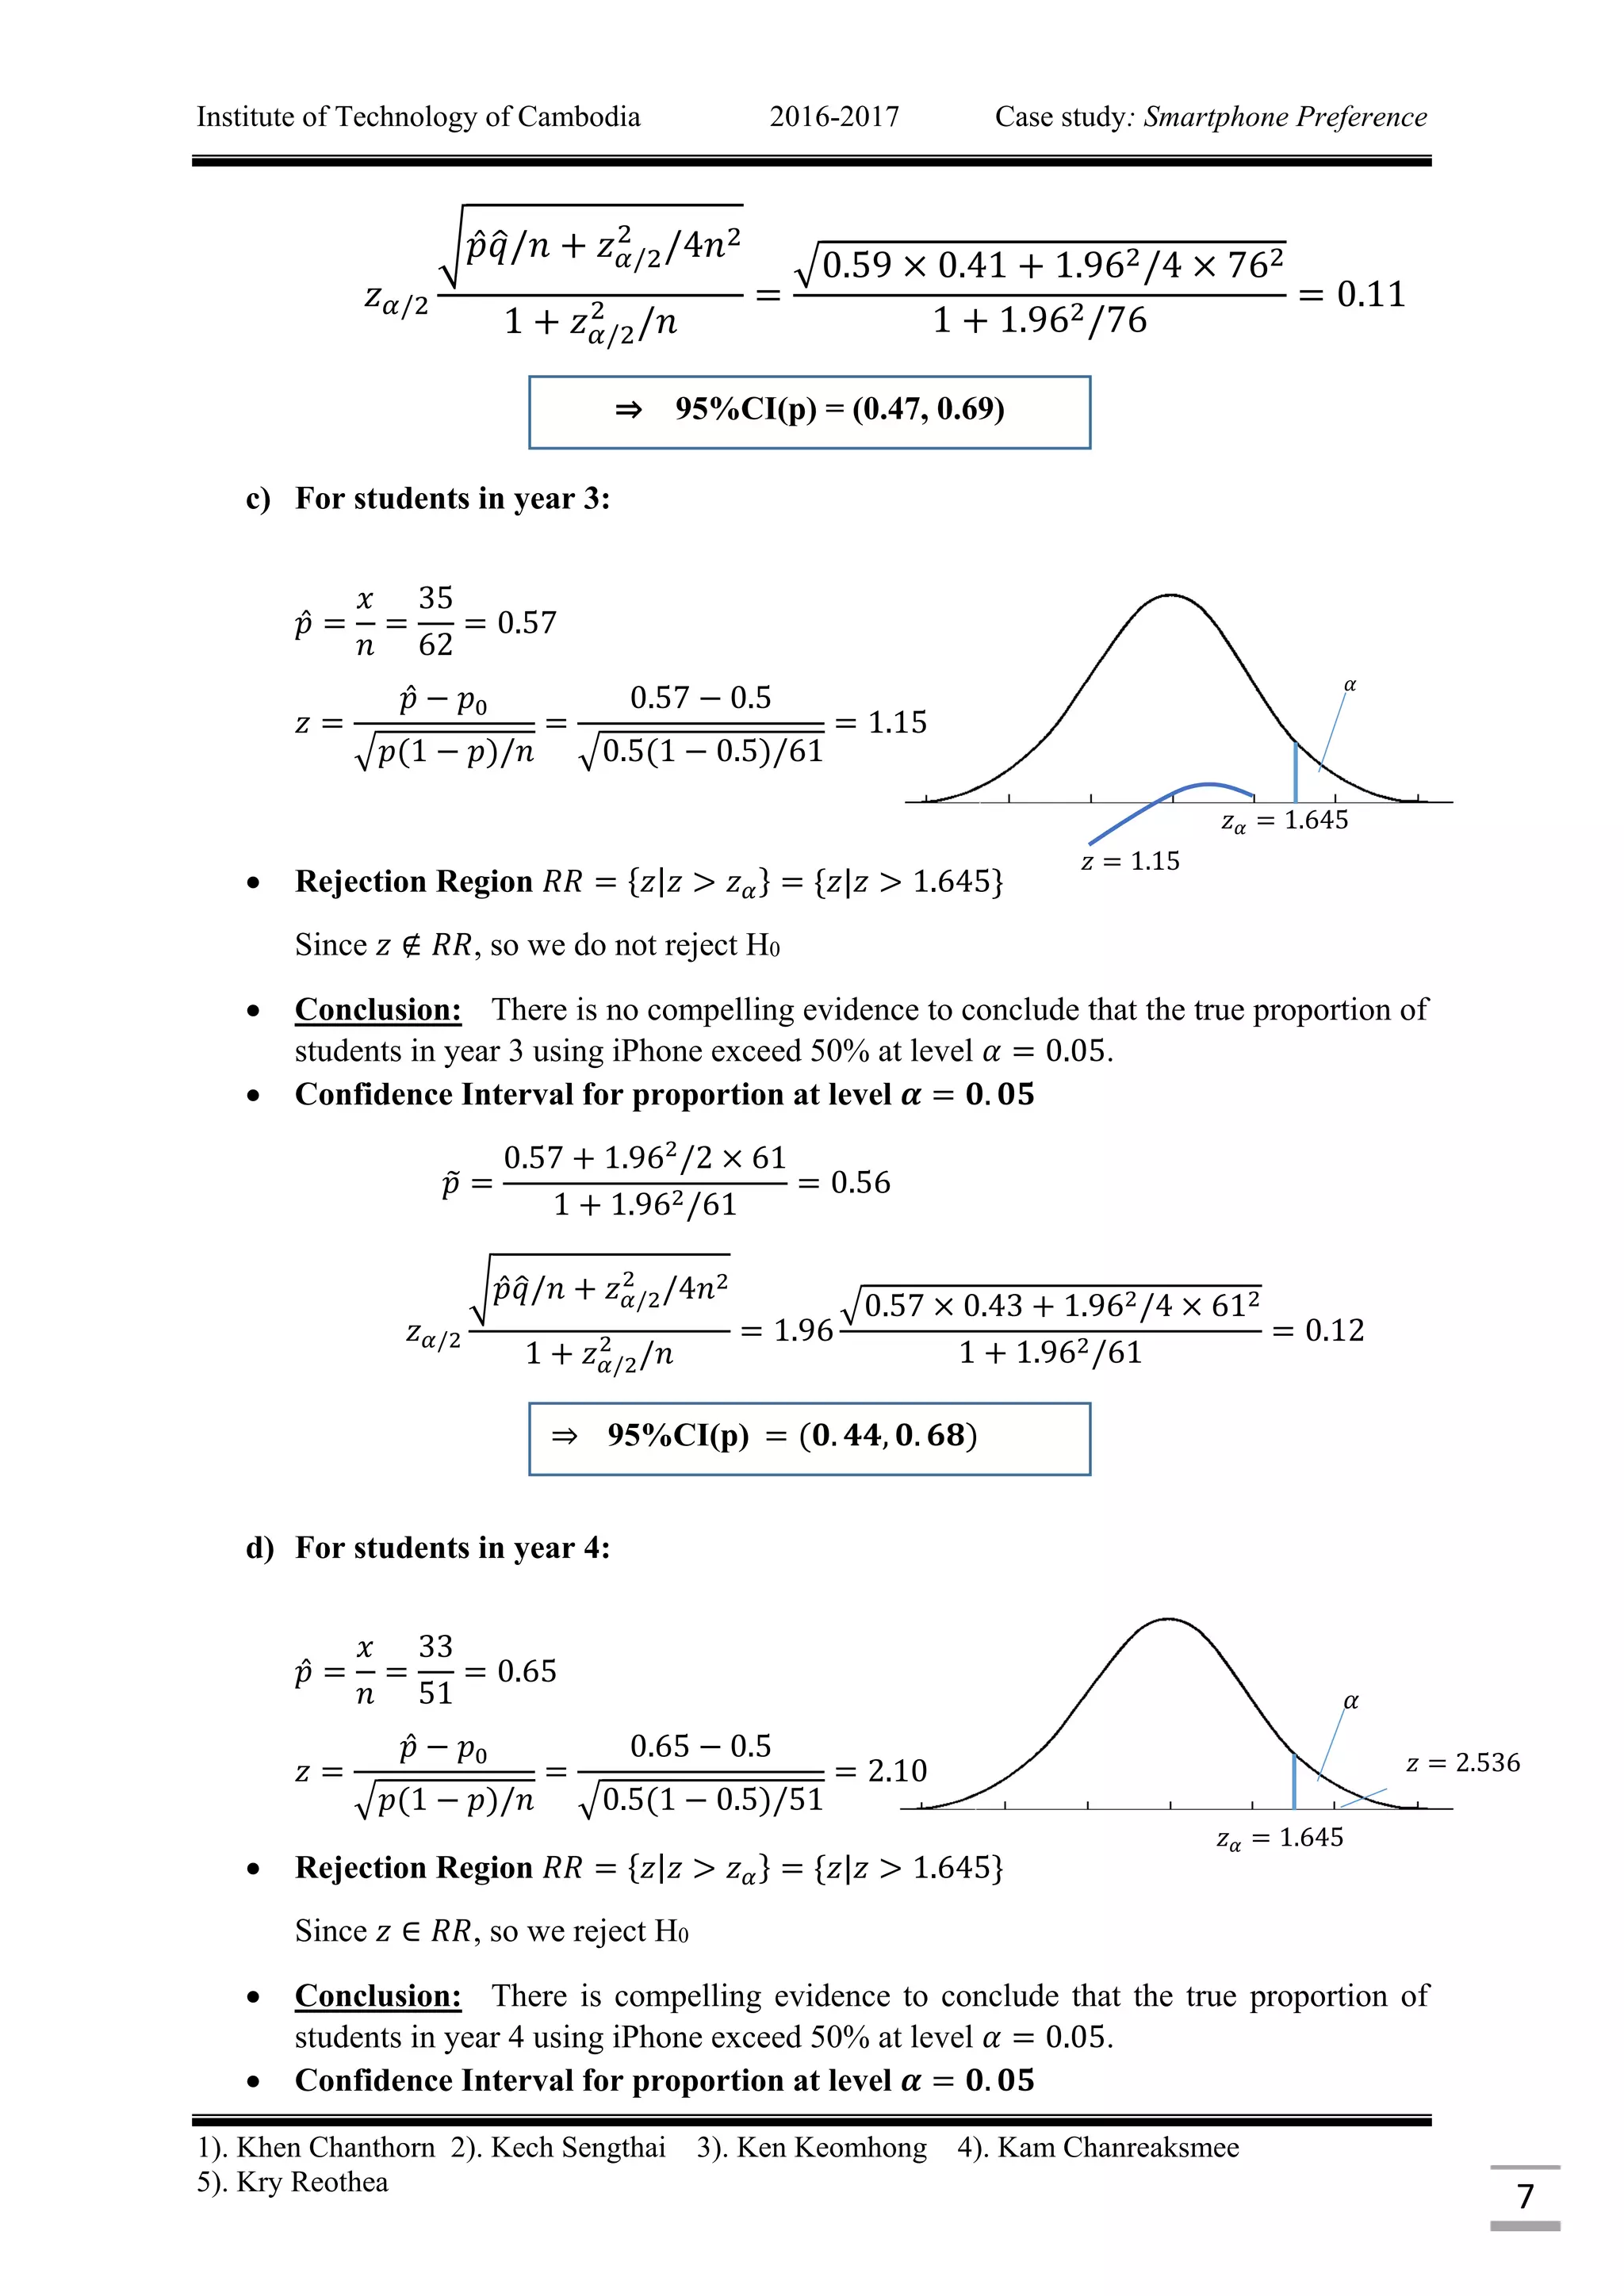
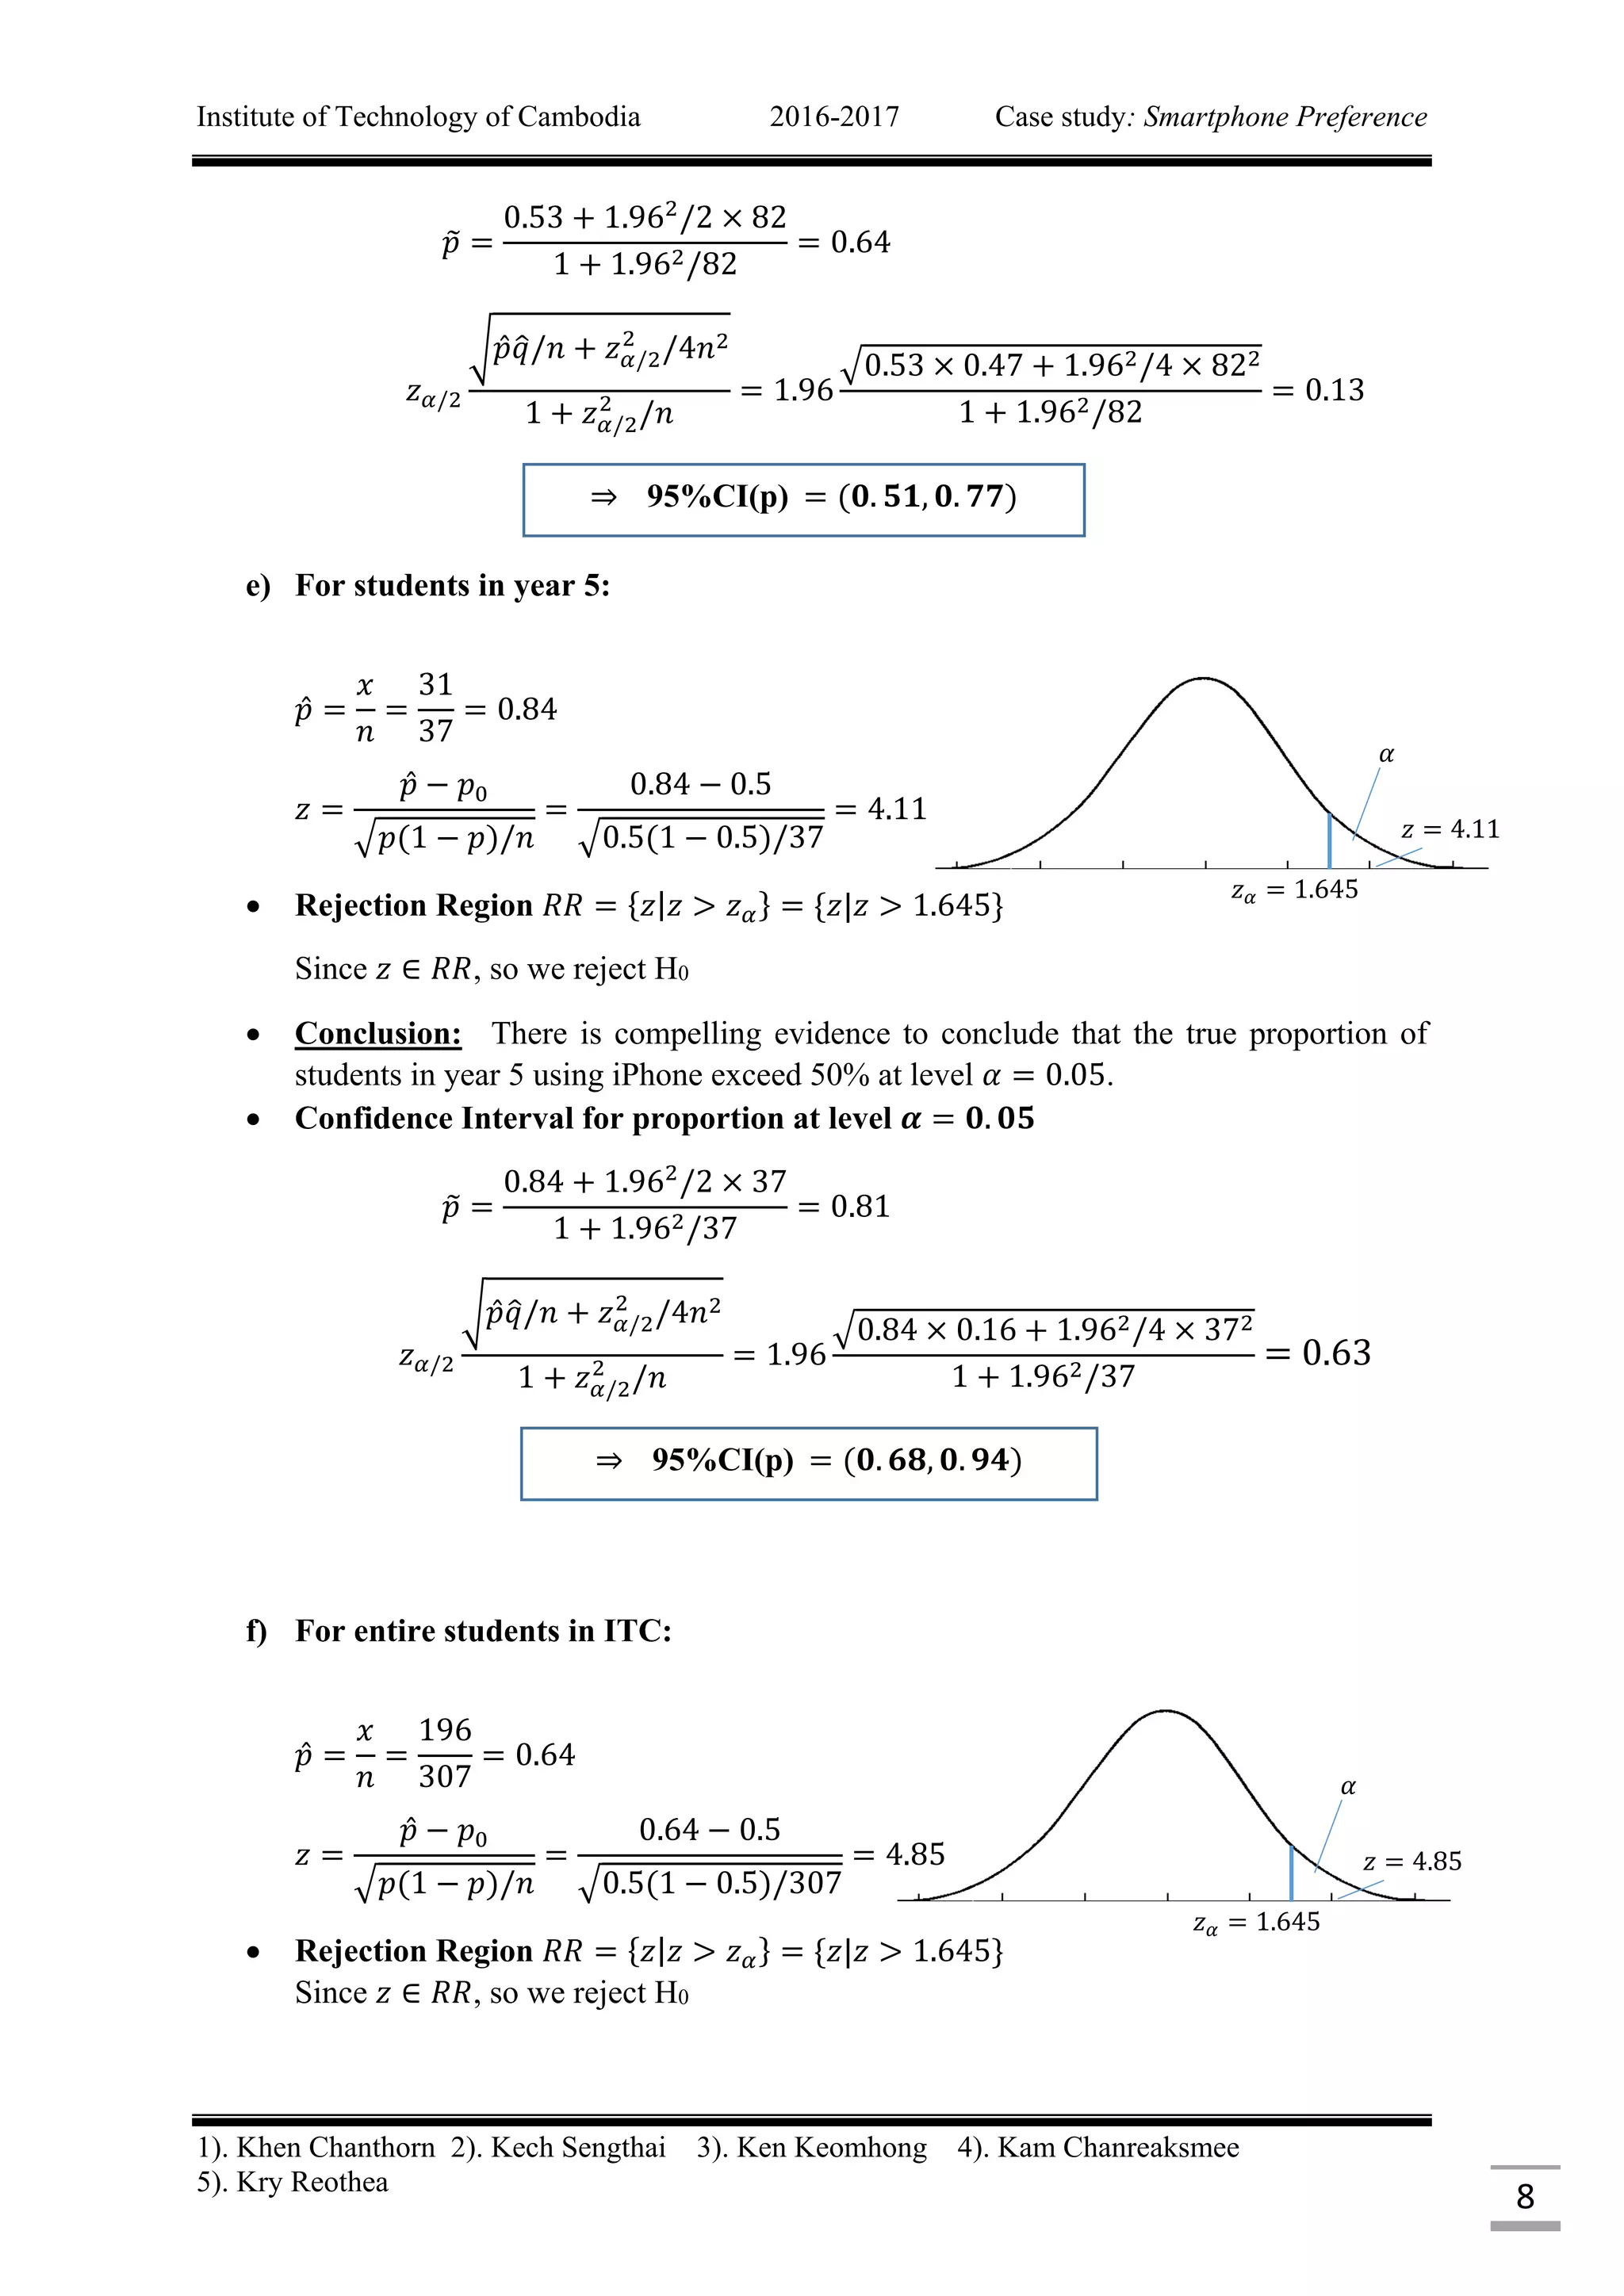

This case study conducted at the Institute of Technology of Cambodia surveyed 307 students from years 1 to 5 to analyze smartphone preferences, particularly focusing on the usage of iPhones. Results indicated that the proportion of students using iPhones varied across years, with notable usage exceeding 50% for years 1, 4, and 5, while years 2 and 3 did not exceed this threshold. The survey aimed to estimate the true proportion of smartphone use among students and assess trends in preferences over their academic years.