Downloaded 925 times


![18
Average number
of hours spent in
extracurricular
activity
Average xy x2
y2
8 38% 304 64 1444
5 50% 250 25 2500
8 52% 416 64 2704
8 55% 440 64 3025
8 56% 448 64 3136
8 57% 456 64 3249
5 58% 464 25 3364
8 60% 480 64 3600
8 62% 496 64 3844
8 63% 504 64 3969
8 65% 520 64 4225
8 66% 528 64 4356
5 68% 340 25 4624
8 70% 560 64 4900
8 72% 576 64 5184
5 74% 370 25 5476
8 75% 600 64 5625
8 80% 640 64 6400
5 80% 400 25 6400
8 80% 640 64+ 6400
5 80% 400 25 6400
2 81% 162 4 6561
5 82% 410 25 6724
8 83% 664 64 6889
5 84% 420 25 7056
8 84% 672 64 7056
2 85% 170 4 7225
8 86% 688 64 7396
8 87% 696 64 7569
8 93% 744 64 8649
∑x=204 ∑y=9551 ∑xy=14458 ∑x2
=1488 ∑y2
=150325
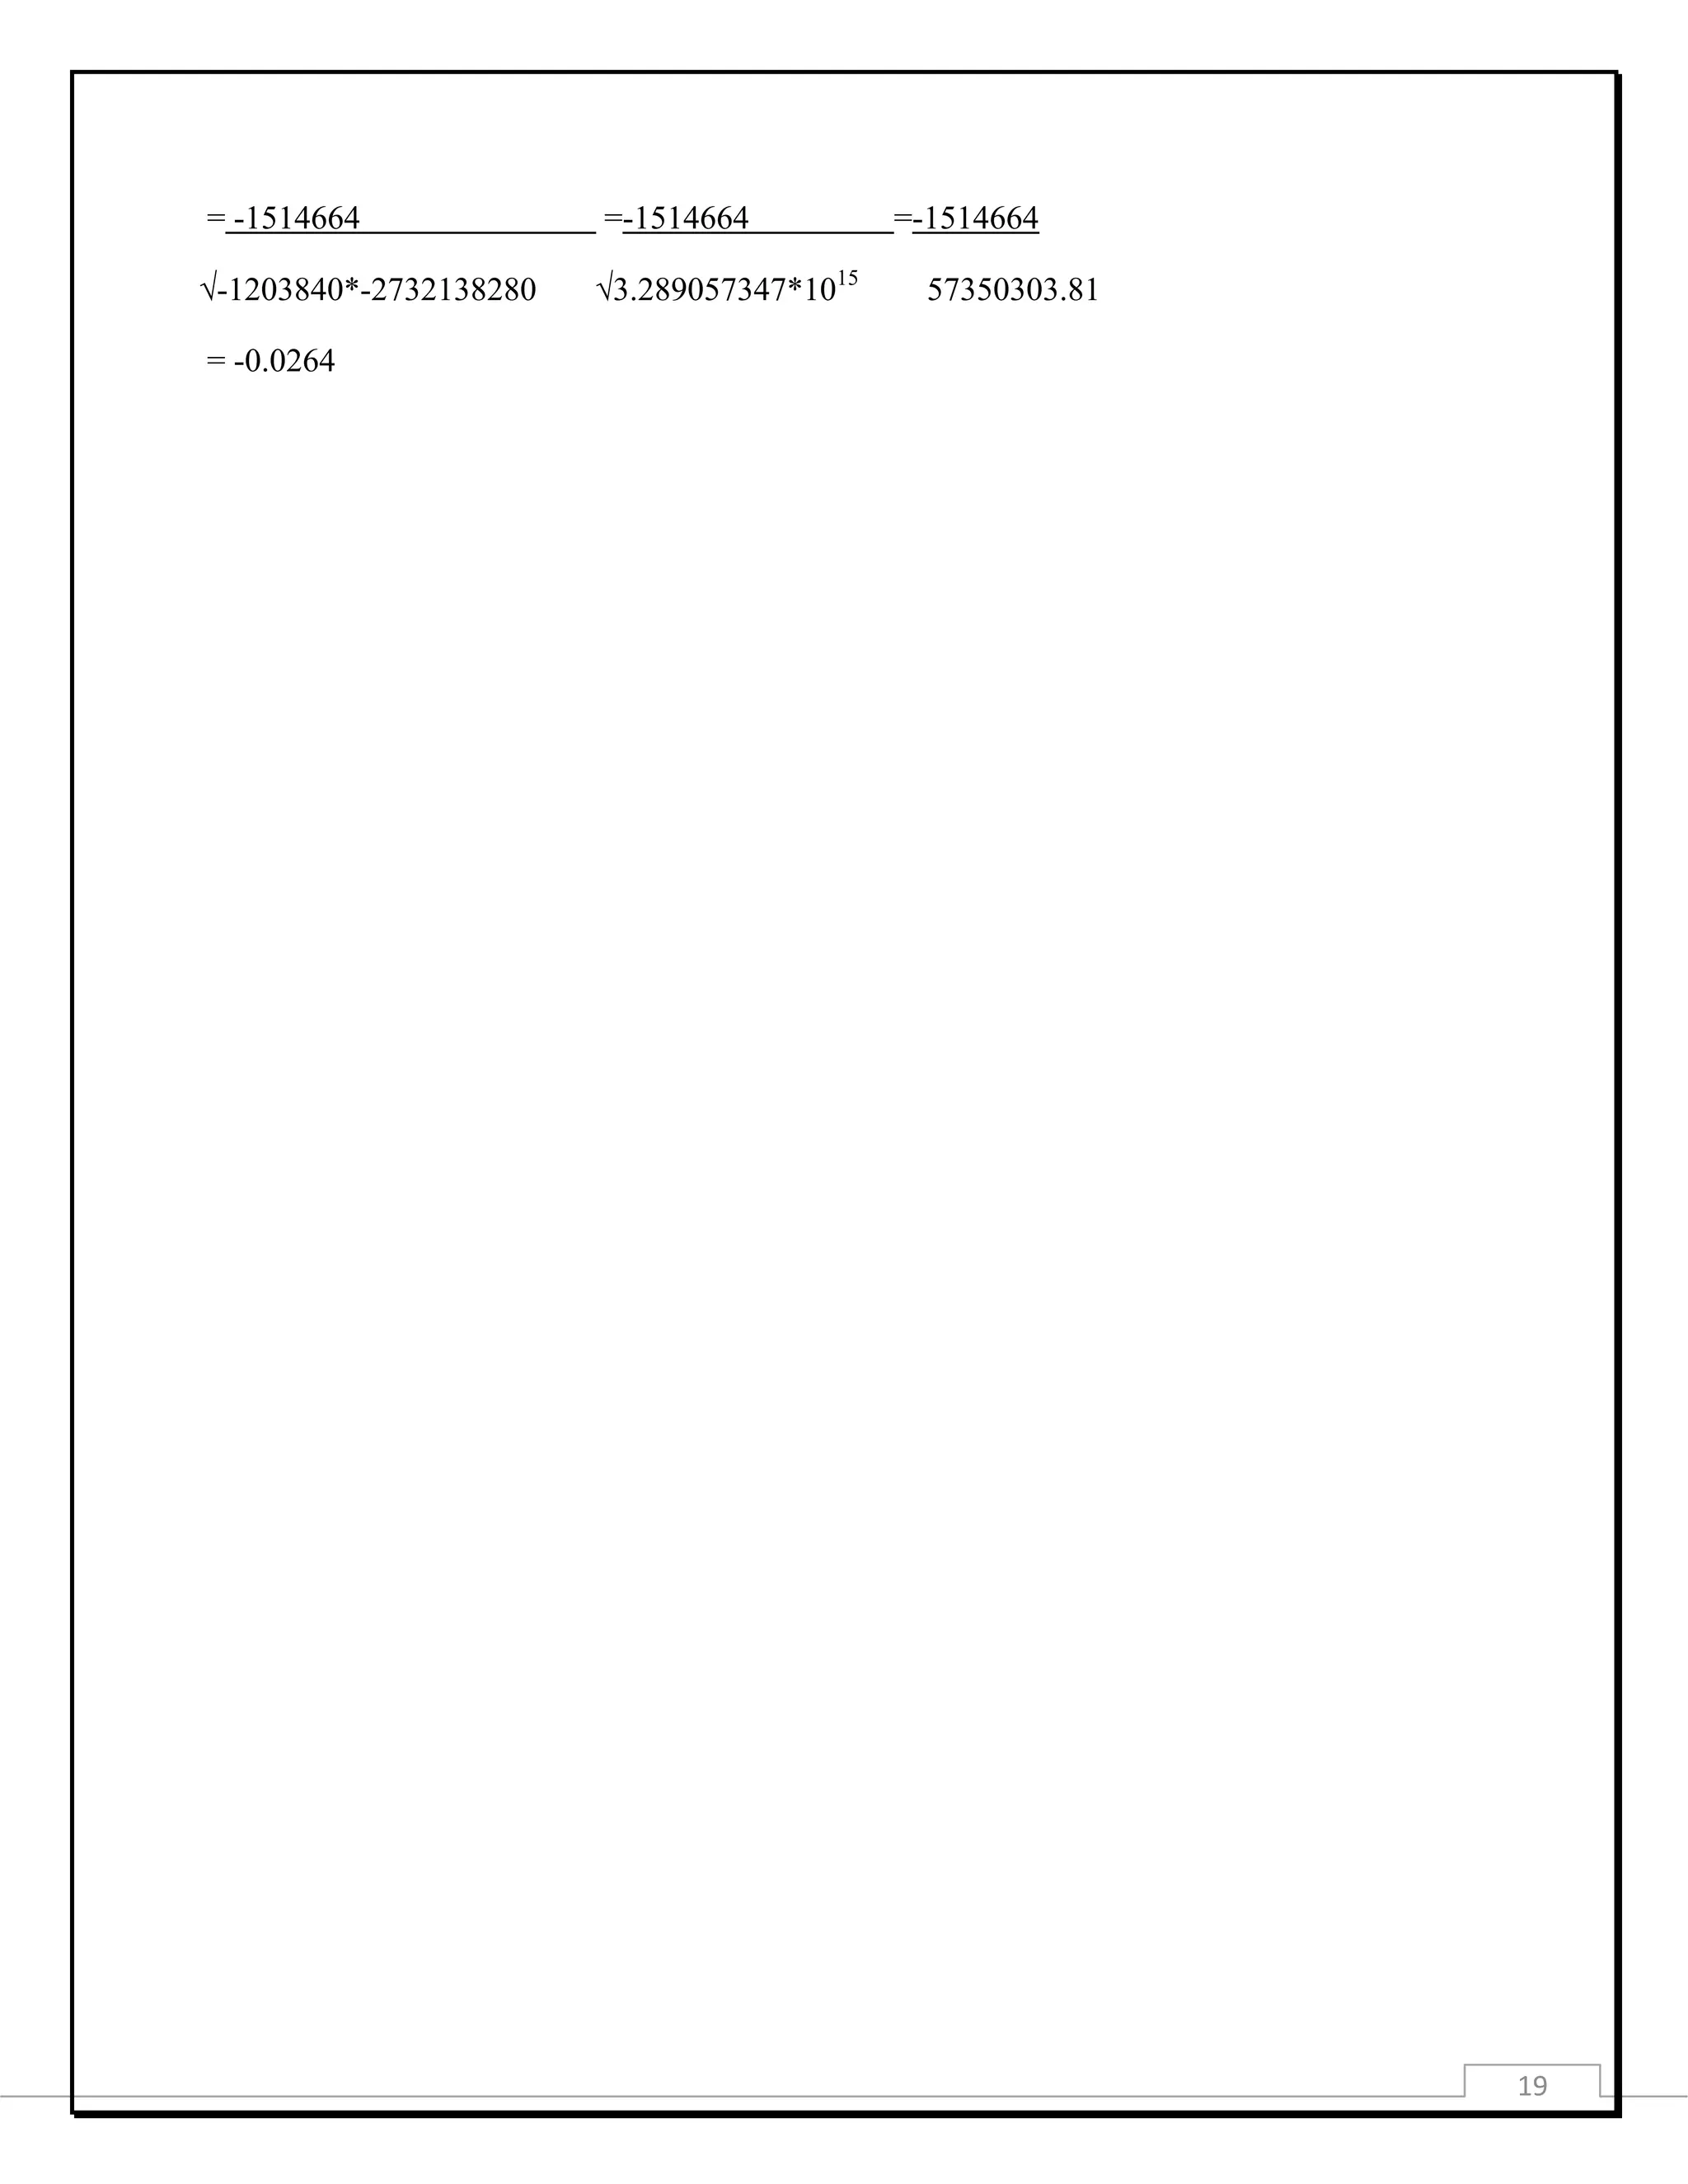
r=n ∑xy - ∑x∑y=30(14458) – (204) (9551)
√[n∑x2-
(∑x)2
]*[n ∑y2
-(∑y)2
] √[30(1488 – 41616] * [30(150325 – 91221601)]](https://image.slidesharecdn.com/appliedmathsba-140408014651-phpapp02/75/Applied-math-sba-18-2048.jpg)


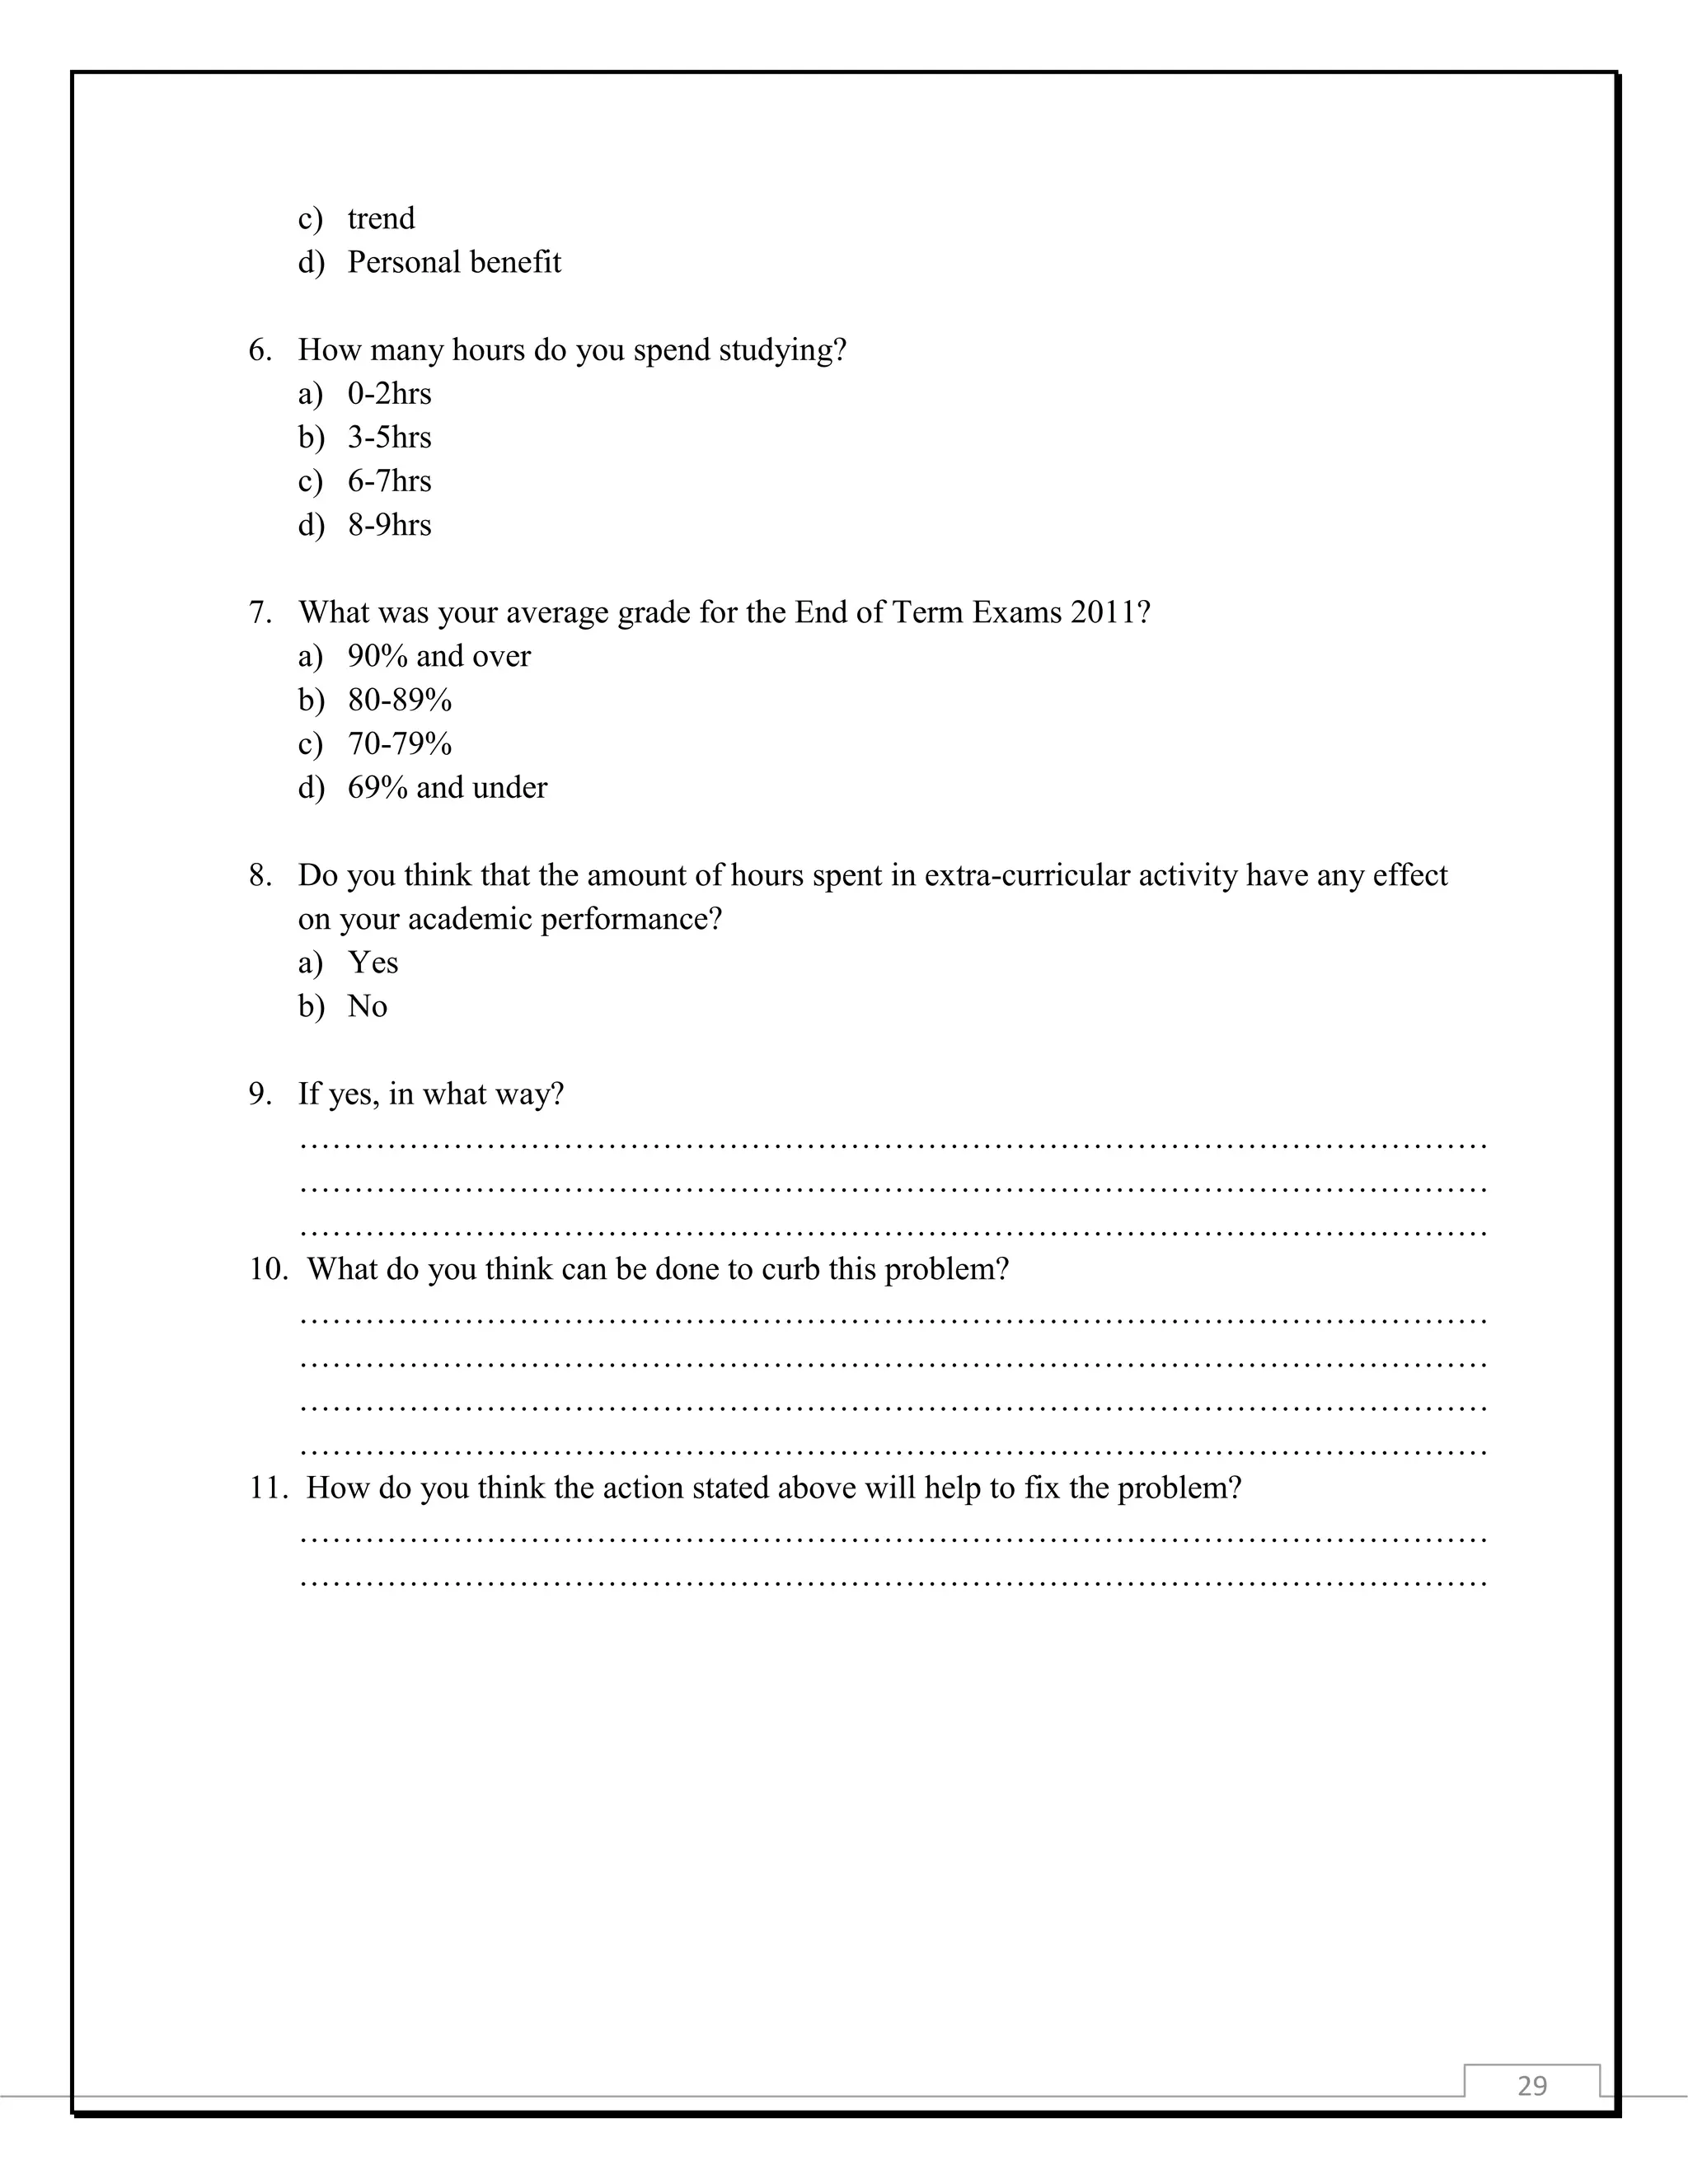

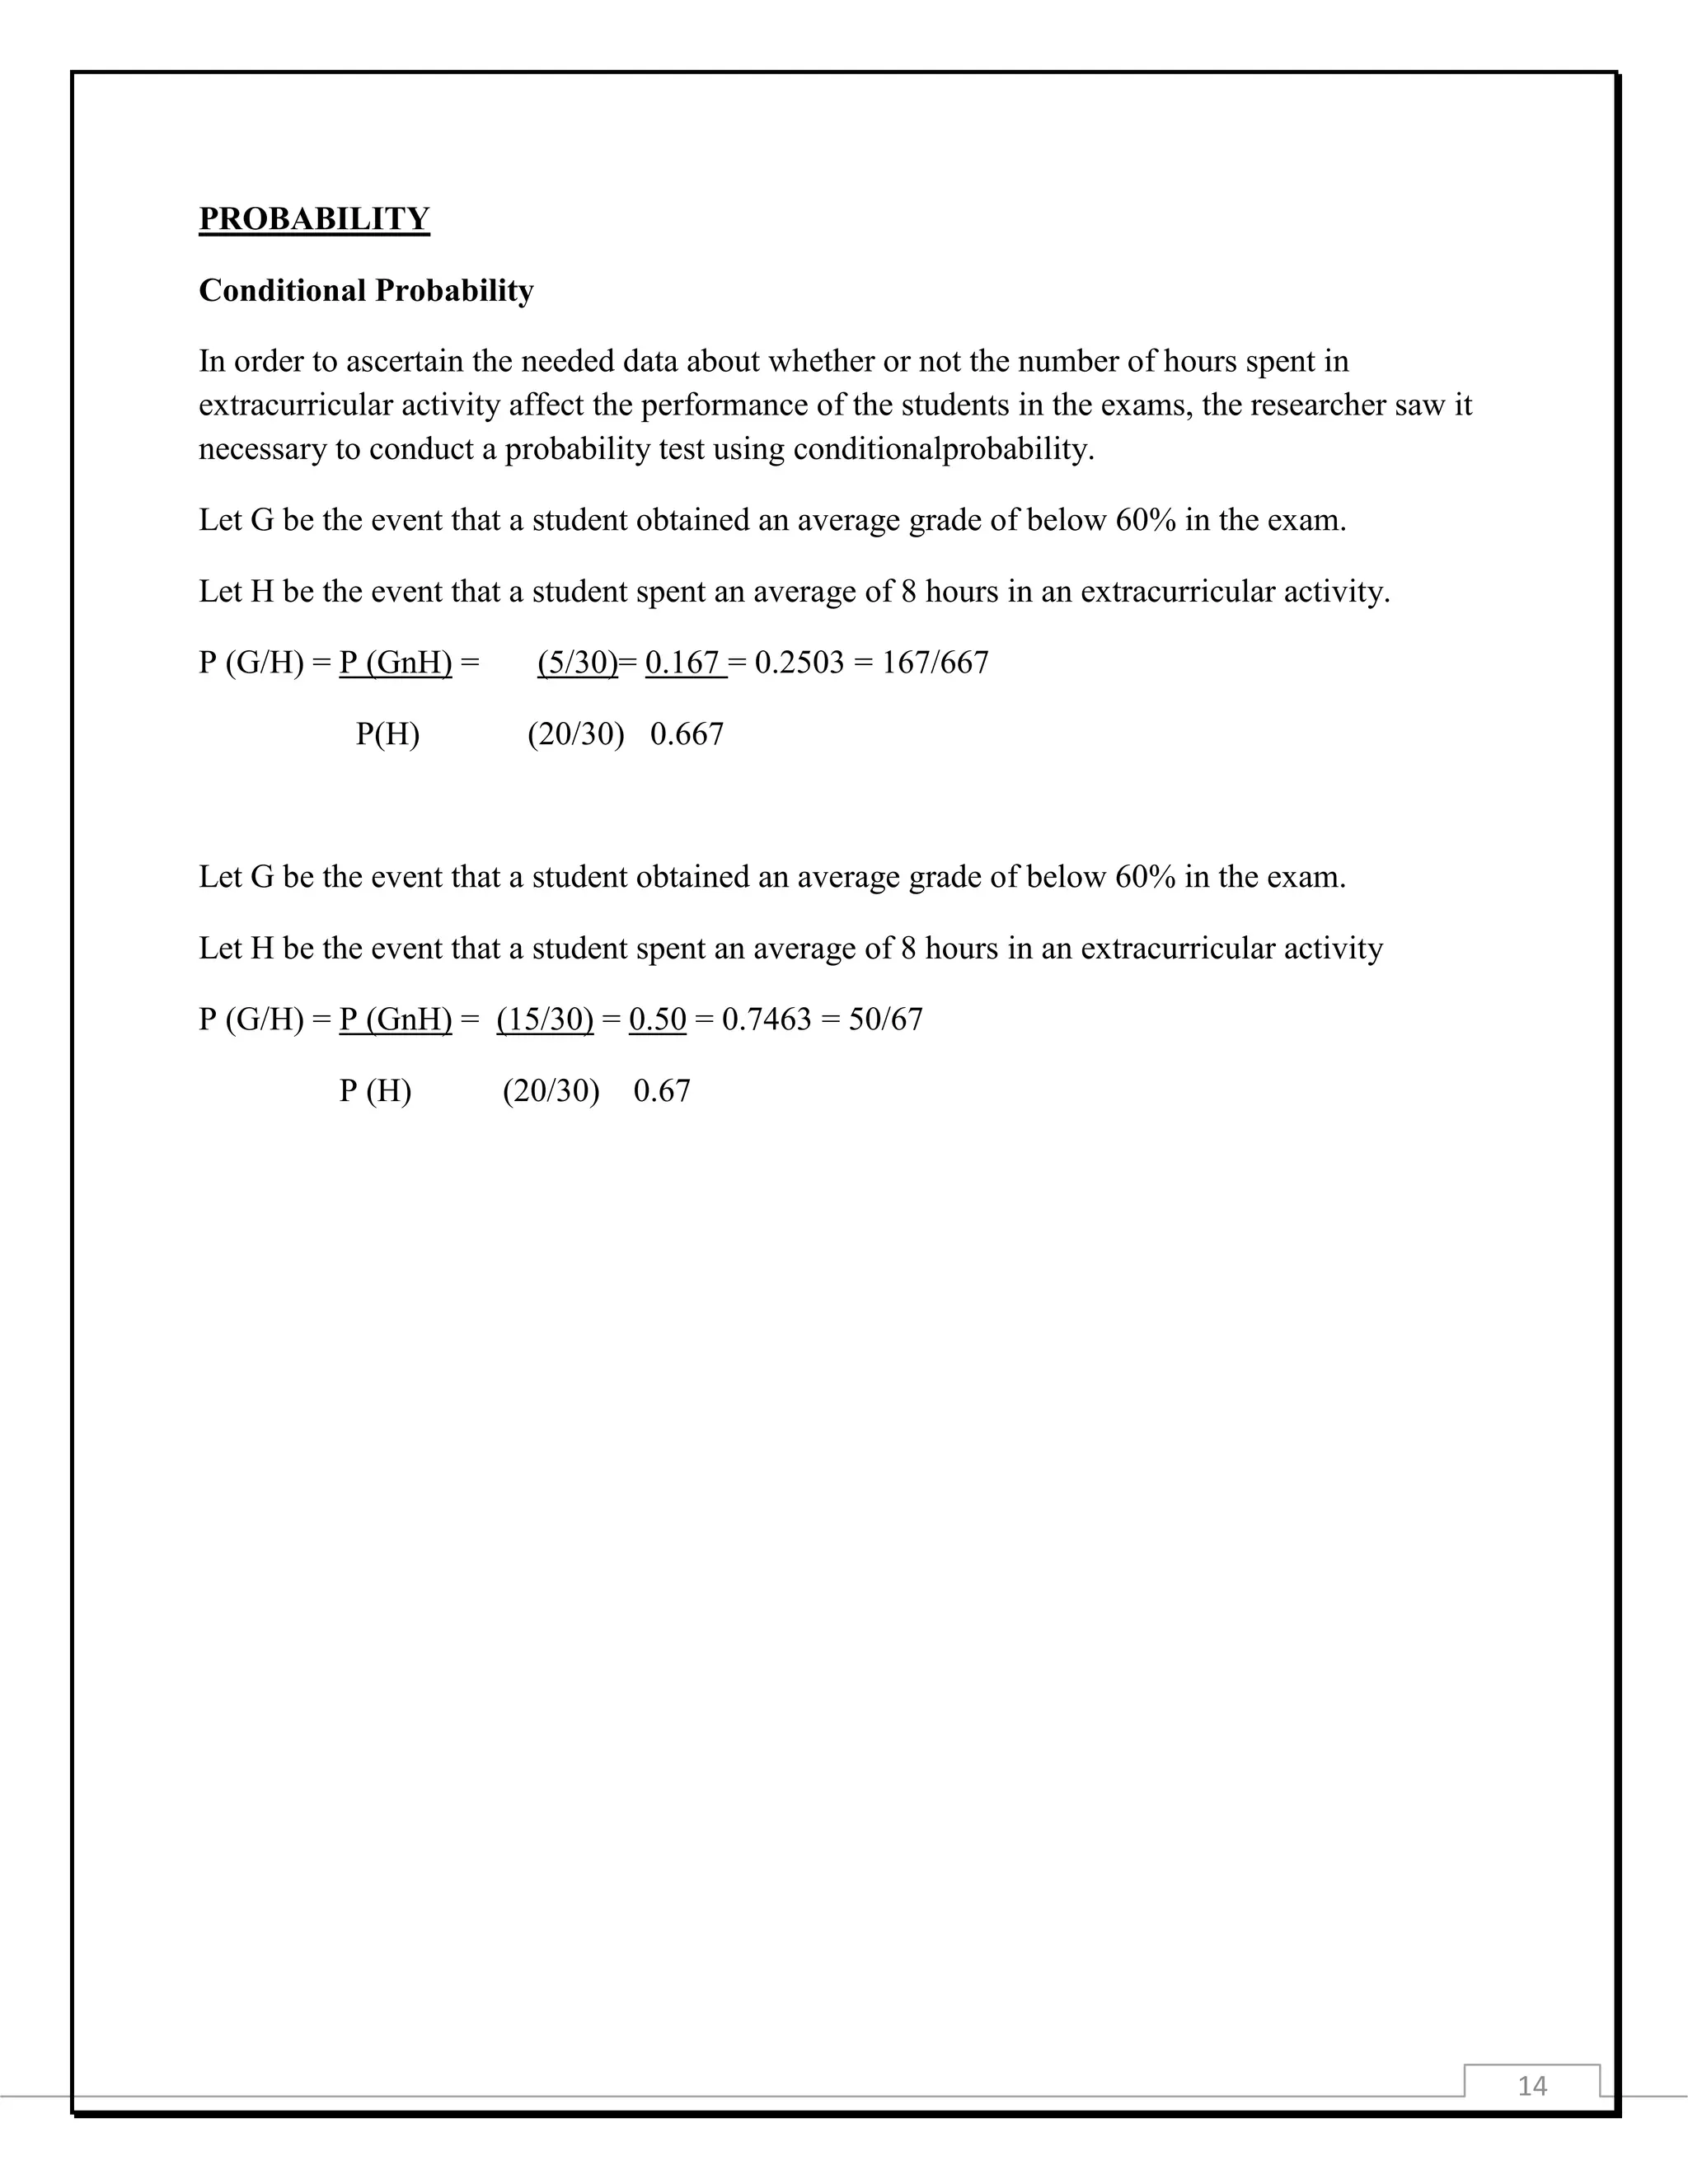
This document provides information about a student project investigating how engagement in extracurricular activities affects academic performance. It includes the project title, purpose, data collection methods, presentation of collected data through tables and graphs, analysis using measures of central tendency, probability, chi-square test, and correlation. The analysis found a low negative correlation between time spent on extracurricular activities and academic performance. The document concludes there is a slight decrease in grades as time on extracurricular activities increases.


