SlideShare a Scribd company logo
1 of 8
Power BI Tips
and Timesavers
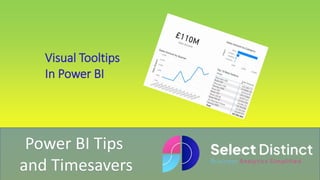
Visual Tooltips
In Power BI
Visual Tooltips
Power BI by default gives you basic
tooltips, which present you with the
values included in your visual
But with a bit of set up you can
improve them dramatically and really
bring the reports to life
Set up a Tooltip page
Add a new tab, by clicking the plus and
name it ‘Graphical Tooltip’
Set the page size, generally smaller is
better, this example uses a larger
tooltip for demo purposes
Add visuals to your new page
Activate the new tool tip
On the new ‘Graphical Tooltip’ page
Go to the visualizations pane
Under page information, set the Tooltip
slider to ON
Select the Tooltip for each visual
Select the first visual
Go to the visualizations pane
Under Tooltip
Make sure it is set to on
Type – Report Page
Page – ‘Graphical Tooltip’
(the new tooltip page name we created)
Repeat this step for each visual you want
the tooltip to work for
Enjoy
Now when the user
hovers over any of the
visuals
The new tooltip pops
up showing more detail
Visual tooltips in Power BI bring a rich user experience, giving your users
the ability to explore what is behind the data
It brings a real WOW factor and is a very efficient way to present further
details
Hope you find this useful
For more Tips, Tricks and
Timesavers, visit our website
Business Analytics Blog – Select Distinct
Credit: simon.harrison@selectdistinct.co.uk

More Related Content

Similar to Power BI Tips Visual Tooltips.pptx

My First Report slide support
My First Report slide supportMy First Report slide support
My First Report slide supportSpagoWorld
 
Are You Looking Reasonable VWO Alternative?
Are You Looking Reasonable VWO Alternative?Are You Looking Reasonable VWO Alternative?
Are You Looking Reasonable VWO Alternative?NotifyVisitors
 
How to Fix Common Errors with QuickBooks Tool Hub
  How to Fix Common Errors with QuickBooks Tool Hub  How to Fix Common Errors with QuickBooks Tool Hub
How to Fix Common Errors with QuickBooks Tool HubQBTOOLHUB
 
Seven Really useful WordPress plugins and how to use them
Seven Really useful WordPress plugins and how to use themSeven Really useful WordPress plugins and how to use them
Seven Really useful WordPress plugins and how to use themAndy Drinkwater
 
Power BI Secrets
Power BI SecretsPower BI Secrets
Power BI SecretsDoug Burke
 
Art Nouveau Style Presentation.pptx
Art Nouveau Style Presentation.pptxArt Nouveau Style Presentation.pptx
Art Nouveau Style Presentation.pptxjona14788
 
Art Nouveau Style Presentation.pptx
Art Nouveau Style Presentation.pptxArt Nouveau Style Presentation.pptx
Art Nouveau Style Presentation.pptxjuliumont
 
arte para todos.pptx
arte para todos.pptxarte para todos.pptx
arte para todos.pptxDaniel22326
 
Tools to Create Eye-Catching Infographics for Your Website
Tools to Create Eye-Catching Infographics for Your WebsiteTools to Create Eye-Catching Infographics for Your Website
Tools to Create Eye-Catching Infographics for Your WebsiteHTS Hosting
 
The Anatomy Of An Effective Website: Designing Your Product Page
The Anatomy Of An Effective Website: Designing Your Product PageThe Anatomy Of An Effective Website: Designing Your Product Page
The Anatomy Of An Effective Website: Designing Your Product PageApril Rose Semogan
 
Evaluation Question 6
Evaluation Question 6Evaluation Question 6
Evaluation Question 6AlexaDippold
 
Evaluation question a2 4
Evaluation question a2 4Evaluation question a2 4
Evaluation question a2 4olliedwyer
 
Guide to new Power BI
Guide to new Power BIGuide to new Power BI
Guide to new Power BIMag Dutka
 
sample1.ppt
sample1.pptsample1.ppt
sample1.pptcoraqifa
 

Similar to Power BI Tips Visual Tooltips.pptx (20)

My First Report slide support
My First Report slide supportMy First Report slide support
My First Report slide support
 
Power of power BI
Power of power BI Power of power BI
Power of power BI
 
4 - Press Prep
4 - Press Prep4 - Press Prep
4 - Press Prep
 
Kelly martin powerpoint
Kelly martin powerpointKelly martin powerpoint
Kelly martin powerpoint
 
Are You Looking Reasonable VWO Alternative?
Are You Looking Reasonable VWO Alternative?Are You Looking Reasonable VWO Alternative?
Are You Looking Reasonable VWO Alternative?
 
How to Fix Common Errors with QuickBooks Tool Hub
  How to Fix Common Errors with QuickBooks Tool Hub  How to Fix Common Errors with QuickBooks Tool Hub
How to Fix Common Errors with QuickBooks Tool Hub
 
Seven Really useful WordPress plugins and how to use them
Seven Really useful WordPress plugins and how to use themSeven Really useful WordPress plugins and how to use them
Seven Really useful WordPress plugins and how to use them
 
Power BI Secrets
Power BI SecretsPower BI Secrets
Power BI Secrets
 
Power BI Drill Through
Power BI Drill ThroughPower BI Drill Through
Power BI Drill Through
 
Art Nouveau Style Presentation.pptx
Art Nouveau Style Presentation.pptxArt Nouveau Style Presentation.pptx
Art Nouveau Style Presentation.pptx
 
Art Nouveau Style Presentation.pptx
Art Nouveau Style Presentation.pptxArt Nouveau Style Presentation.pptx
Art Nouveau Style Presentation.pptx
 
arte para todos.pptx
arte para todos.pptxarte para todos.pptx
arte para todos.pptx
 
Tools to Create Eye-Catching Infographics for Your Website
Tools to Create Eye-Catching Infographics for Your WebsiteTools to Create Eye-Catching Infographics for Your Website
Tools to Create Eye-Catching Infographics for Your Website
 
The Anatomy Of An Effective Website: Designing Your Product Page
The Anatomy Of An Effective Website: Designing Your Product PageThe Anatomy Of An Effective Website: Designing Your Product Page
The Anatomy Of An Effective Website: Designing Your Product Page
 
Evaluation Question 6
Evaluation Question 6Evaluation Question 6
Evaluation Question 6
 
Evaluation question a2 4
Evaluation question a2 4Evaluation question a2 4
Evaluation question a2 4
 
Evaluation 4
Evaluation 4Evaluation 4
Evaluation 4
 
Digital photo editing
Digital photo editingDigital photo editing
Digital photo editing
 
Guide to new Power BI
Guide to new Power BIGuide to new Power BI
Guide to new Power BI
 
sample1.ppt
sample1.pptsample1.ppt
sample1.ppt
 

More from Select Distinct Limited

Year on Year Comparison in Power BI.pptx
Year on Year Comparison in Power BI.pptxYear on Year Comparison in Power BI.pptx
Year on Year Comparison in Power BI.pptxSelect Distinct Limited
 
Sync Slicers in Power BI a step by step guide
Sync Slicers in Power BI a step by step guideSync Slicers in Power BI a step by step guide
Sync Slicers in Power BI a step by step guideSelect Distinct Limited
 
Using Google Search Console Data in Power BI.pptx
Using Google Search Console Data in Power BI.pptxUsing Google Search Console Data in Power BI.pptx
Using Google Search Console Data in Power BI.pptxSelect Distinct Limited
 
Data Lake v Data Warehouse. What is the difference?
Data Lake v Data Warehouse. What is the difference?Data Lake v Data Warehouse. What is the difference?
Data Lake v Data Warehouse. What is the difference?Select Distinct Limited
 
How to Create Drop Down Lists in Excel, step by step
How to Create Drop Down Lists in Excel, step by stepHow to Create Drop Down Lists in Excel, step by step
How to Create Drop Down Lists in Excel, step by stepSelect Distinct Limited
 
Top 5 SQL Tips and Timesaver 2023, our most popular posts
Top 5 SQL Tips and Timesaver 2023, our most popular postsTop 5 SQL Tips and Timesaver 2023, our most popular posts
Top 5 SQL Tips and Timesaver 2023, our most popular postsSelect Distinct Limited
 
Top 5 Power BI tips 2023 most popular blog posts
Top 5 Power BI tips 2023 most popular blog postsTop 5 Power BI tips 2023 most popular blog posts
Top 5 Power BI tips 2023 most popular blog postsSelect Distinct Limited
 
Calculated Columns and Measures in Power BI.pptx
Calculated Columns and Measures in Power BI.pptxCalculated Columns and Measures in Power BI.pptx
Calculated Columns and Measures in Power BI.pptxSelect Distinct Limited
 
When to transform data for Power BI.pptx
When to transform data for Power BI.pptxWhen to transform data for Power BI.pptx
When to transform data for Power BI.pptxSelect Distinct Limited
 
Direction of travel on a map in Power BI.pptx
Direction of travel on a map in Power BI.pptxDirection of travel on a map in Power BI.pptx
Direction of travel on a map in Power BI.pptxSelect Distinct Limited
 
Power BI Connect to Google BigQuery.pptx
Power BI Connect to Google BigQuery.pptxPower BI Connect to Google BigQuery.pptx
Power BI Connect to Google BigQuery.pptxSelect Distinct Limited
 

More from Select Distinct Limited (20)

Year on Year Comparison in Power BI.pptx
Year on Year Comparison in Power BI.pptxYear on Year Comparison in Power BI.pptx
Year on Year Comparison in Power BI.pptx
 
Sync Slicers in Power BI a step by step guide
Sync Slicers in Power BI a step by step guideSync Slicers in Power BI a step by step guide
Sync Slicers in Power BI a step by step guide
 
Using Google Search Console Data in Power BI.pptx
Using Google Search Console Data in Power BI.pptxUsing Google Search Console Data in Power BI.pptx
Using Google Search Console Data in Power BI.pptx
 
Data Lake v Data Warehouse. What is the difference?
Data Lake v Data Warehouse. What is the difference?Data Lake v Data Warehouse. What is the difference?
Data Lake v Data Warehouse. What is the difference?
 
How to Create Drop Down Lists in Excel, step by step
How to Create Drop Down Lists in Excel, step by stepHow to Create Drop Down Lists in Excel, step by step
How to Create Drop Down Lists in Excel, step by step
 
Top 5 SQL Tips and Timesaver 2023, our most popular posts
Top 5 SQL Tips and Timesaver 2023, our most popular postsTop 5 SQL Tips and Timesaver 2023, our most popular posts
Top 5 SQL Tips and Timesaver 2023, our most popular posts
 
Top 5 Power BI tips 2023 most popular blog posts
Top 5 Power BI tips 2023 most popular blog postsTop 5 Power BI tips 2023 most popular blog posts
Top 5 Power BI tips 2023 most popular blog posts
 
CTEs in SQL.pptx
CTEs in SQL.pptxCTEs in SQL.pptx
CTEs in SQL.pptx
 
Calculated Columns and Measures in Power BI.pptx
Calculated Columns and Measures in Power BI.pptxCalculated Columns and Measures in Power BI.pptx
Calculated Columns and Measures in Power BI.pptx
 
Divide by Zero Errors
Divide by Zero ErrorsDivide by Zero Errors
Divide by Zero Errors
 
When to transform data for Power BI.pptx
When to transform data for Power BI.pptxWhen to transform data for Power BI.pptx
When to transform data for Power BI.pptx
 
Power BI KPIs
Power BI KPIsPower BI KPIs
Power BI KPIs
 
Direction of travel on a map in Power BI.pptx
Direction of travel on a map in Power BI.pptxDirection of travel on a map in Power BI.pptx
Direction of travel on a map in Power BI.pptx
 
UNION in DAX
UNION in DAXUNION in DAX
UNION in DAX
 
APPEND data in Power Query
APPEND data in Power QueryAPPEND data in Power Query
APPEND data in Power Query
 
Power BI Connect to Google BigQuery.pptx
Power BI Connect to Google BigQuery.pptxPower BI Connect to Google BigQuery.pptx
Power BI Connect to Google BigQuery.pptx
 
Group by ROLLUP in SQL Server
Group by ROLLUP in SQL ServerGroup by ROLLUP in SQL Server
Group by ROLLUP in SQL Server
 
Advanced Top N Measures in Power BI
Advanced Top N Measures in Power BIAdvanced Top N Measures in Power BI
Advanced Top N Measures in Power BI
 
Custom Formats in Power BI
Custom Formats in Power BICustom Formats in Power BI
Custom Formats in Power BI
 
Power BI Tips Top N Measures.pptx
Power BI Tips Top N Measures.pptxPower BI Tips Top N Measures.pptx
Power BI Tips Top N Measures.pptx
 

Recently uploaded

1:1原版定制伦敦政治经济学院毕业证(LSE毕业证)成绩单学位证书留信学历认证
1:1原版定制伦敦政治经济学院毕业证(LSE毕业证)成绩单学位证书留信学历认证1:1原版定制伦敦政治经济学院毕业证(LSE毕业证)成绩单学位证书留信学历认证
1:1原版定制伦敦政治经济学院毕业证(LSE毕业证)成绩单学位证书留信学历认证dq9vz1isj
 
How to Transform Clinical Trial Management with Advanced Data Analytics
How to Transform Clinical Trial Management with Advanced Data AnalyticsHow to Transform Clinical Trial Management with Advanced Data Analytics
How to Transform Clinical Trial Management with Advanced Data AnalyticsBrainSell Technologies
 
Northern New England Tableau User Group (TUG) May 2024
Northern New England Tableau User Group (TUG) May 2024Northern New England Tableau User Group (TUG) May 2024
Northern New England Tableau User Group (TUG) May 2024patrickdtherriault
 
The Significance of Transliteration Enhancing
The Significance of Transliteration EnhancingThe Significance of Transliteration Enhancing
The Significance of Transliteration Enhancingmohamed Elzalabany
 
一比一原版西悉尼大学毕业证成绩单如何办理
一比一原版西悉尼大学毕业证成绩单如何办理一比一原版西悉尼大学毕业证成绩单如何办理
一比一原版西悉尼大学毕业证成绩单如何办理pyhepag
 
Atlantic Grupa Case Study (Mintec Data AI)
Atlantic Grupa Case Study (Mintec Data AI)Atlantic Grupa Case Study (Mintec Data AI)
Atlantic Grupa Case Study (Mintec Data AI)Jon Hansen
 
Sensing the Future: Anomaly Detection and Event Prediction in Sensor Networks
Sensing the Future: Anomaly Detection and Event Prediction in Sensor NetworksSensing the Future: Anomaly Detection and Event Prediction in Sensor Networks
Sensing the Future: Anomaly Detection and Event Prediction in Sensor NetworksBoston Institute of Analytics
 
Credit Card Fraud Detection: Safeguarding Transactions in the Digital Age
Credit Card Fraud Detection: Safeguarding Transactions in the Digital AgeCredit Card Fraud Detection: Safeguarding Transactions in the Digital Age
Credit Card Fraud Detection: Safeguarding Transactions in the Digital AgeBoston Institute of Analytics
 
Identify Rules that Predict Patient’s Heart Disease - An Application of Decis...
Identify Rules that Predict Patient’s Heart Disease - An Application of Decis...Identify Rules that Predict Patient’s Heart Disease - An Application of Decis...
Identify Rules that Predict Patient’s Heart Disease - An Application of Decis...ThinkInnovation
 
Audience Researchndfhcvnfgvgbhujhgfv.pptx
Audience Researchndfhcvnfgvgbhujhgfv.pptxAudience Researchndfhcvnfgvgbhujhgfv.pptx
Audience Researchndfhcvnfgvgbhujhgfv.pptxStephen266013
 
社内勉強会資料  Mamba - A new era or ephemeral
社内勉強会資料   Mamba - A new era or ephemeral社内勉強会資料   Mamba - A new era or ephemeral
社内勉強会資料  Mamba - A new era or ephemeralNABLAS株式会社
 
如何办理哥伦比亚大学毕业证(Columbia毕业证)成绩单原版一比一
如何办理哥伦比亚大学毕业证(Columbia毕业证)成绩单原版一比一如何办理哥伦比亚大学毕业证(Columbia毕业证)成绩单原版一比一
如何办理哥伦比亚大学毕业证(Columbia毕业证)成绩单原版一比一fztigerwe
 
2024 Q2 Orange County (CA) Tableau User Group Meeting
2024 Q2 Orange County (CA) Tableau User Group Meeting2024 Q2 Orange County (CA) Tableau User Group Meeting
2024 Q2 Orange County (CA) Tableau User Group MeetingAlison Pitt
 
Statistics Informed Decisions Using Data 5th edition by Michael Sullivan solu...
Statistics Informed Decisions Using Data 5th edition by Michael Sullivan solu...Statistics Informed Decisions Using Data 5th edition by Michael Sullivan solu...
Statistics Informed Decisions Using Data 5th edition by Michael Sullivan solu...ssuserf63bd7
 
Predictive Precipitation: Advanced Rain Forecasting Techniques
Predictive Precipitation: Advanced Rain Forecasting TechniquesPredictive Precipitation: Advanced Rain Forecasting Techniques
Predictive Precipitation: Advanced Rain Forecasting TechniquesBoston Institute of Analytics
 
Formulas dax para power bI de microsoft.pdf
Formulas dax para power bI de microsoft.pdfFormulas dax para power bI de microsoft.pdf
Formulas dax para power bI de microsoft.pdfRobertoOcampo24
 
一比一原版加利福尼亚大学尔湾分校毕业证成绩单如何办理
一比一原版加利福尼亚大学尔湾分校毕业证成绩单如何办理一比一原版加利福尼亚大学尔湾分校毕业证成绩单如何办理
一比一原版加利福尼亚大学尔湾分校毕业证成绩单如何办理pyhepag
 
一比一原版麦考瑞大学毕业证成绩单如何办理
一比一原版麦考瑞大学毕业证成绩单如何办理一比一原版麦考瑞大学毕业证成绩单如何办理
一比一原版麦考瑞大学毕业证成绩单如何办理cyebo
 
Aggregations - The Elasticsearch "GROUP BY"
Aggregations - The Elasticsearch "GROUP BY"Aggregations - The Elasticsearch "GROUP BY"
Aggregations - The Elasticsearch "GROUP BY"John Sobanski
 

Recently uploaded (20)

1:1原版定制伦敦政治经济学院毕业证(LSE毕业证)成绩单学位证书留信学历认证
1:1原版定制伦敦政治经济学院毕业证(LSE毕业证)成绩单学位证书留信学历认证1:1原版定制伦敦政治经济学院毕业证(LSE毕业证)成绩单学位证书留信学历认证
1:1原版定制伦敦政治经济学院毕业证(LSE毕业证)成绩单学位证书留信学历认证
 
How to Transform Clinical Trial Management with Advanced Data Analytics
How to Transform Clinical Trial Management with Advanced Data AnalyticsHow to Transform Clinical Trial Management with Advanced Data Analytics
How to Transform Clinical Trial Management with Advanced Data Analytics
 
Northern New England Tableau User Group (TUG) May 2024
Northern New England Tableau User Group (TUG) May 2024Northern New England Tableau User Group (TUG) May 2024
Northern New England Tableau User Group (TUG) May 2024
 
The Significance of Transliteration Enhancing
The Significance of Transliteration EnhancingThe Significance of Transliteration Enhancing
The Significance of Transliteration Enhancing
 
一比一原版西悉尼大学毕业证成绩单如何办理
一比一原版西悉尼大学毕业证成绩单如何办理一比一原版西悉尼大学毕业证成绩单如何办理
一比一原版西悉尼大学毕业证成绩单如何办理
 
Atlantic Grupa Case Study (Mintec Data AI)
Atlantic Grupa Case Study (Mintec Data AI)Atlantic Grupa Case Study (Mintec Data AI)
Atlantic Grupa Case Study (Mintec Data AI)
 
Sensing the Future: Anomaly Detection and Event Prediction in Sensor Networks
Sensing the Future: Anomaly Detection and Event Prediction in Sensor NetworksSensing the Future: Anomaly Detection and Event Prediction in Sensor Networks
Sensing the Future: Anomaly Detection and Event Prediction in Sensor Networks
 
Credit Card Fraud Detection: Safeguarding Transactions in the Digital Age
Credit Card Fraud Detection: Safeguarding Transactions in the Digital AgeCredit Card Fraud Detection: Safeguarding Transactions in the Digital Age
Credit Card Fraud Detection: Safeguarding Transactions in the Digital Age
 
123.docx. .
123.docx.                                 .123.docx.                                 .
123.docx. .
 
Identify Rules that Predict Patient’s Heart Disease - An Application of Decis...
Identify Rules that Predict Patient’s Heart Disease - An Application of Decis...Identify Rules that Predict Patient’s Heart Disease - An Application of Decis...
Identify Rules that Predict Patient’s Heart Disease - An Application of Decis...
 
Audience Researchndfhcvnfgvgbhujhgfv.pptx
Audience Researchndfhcvnfgvgbhujhgfv.pptxAudience Researchndfhcvnfgvgbhujhgfv.pptx
Audience Researchndfhcvnfgvgbhujhgfv.pptx
 
社内勉強会資料  Mamba - A new era or ephemeral
社内勉強会資料   Mamba - A new era or ephemeral社内勉強会資料   Mamba - A new era or ephemeral
社内勉強会資料  Mamba - A new era or ephemeral
 
如何办理哥伦比亚大学毕业证(Columbia毕业证)成绩单原版一比一
如何办理哥伦比亚大学毕业证(Columbia毕业证)成绩单原版一比一如何办理哥伦比亚大学毕业证(Columbia毕业证)成绩单原版一比一
如何办理哥伦比亚大学毕业证(Columbia毕业证)成绩单原版一比一
 
2024 Q2 Orange County (CA) Tableau User Group Meeting
2024 Q2 Orange County (CA) Tableau User Group Meeting2024 Q2 Orange County (CA) Tableau User Group Meeting
2024 Q2 Orange County (CA) Tableau User Group Meeting
 
Statistics Informed Decisions Using Data 5th edition by Michael Sullivan solu...
Statistics Informed Decisions Using Data 5th edition by Michael Sullivan solu...Statistics Informed Decisions Using Data 5th edition by Michael Sullivan solu...
Statistics Informed Decisions Using Data 5th edition by Michael Sullivan solu...
 
Predictive Precipitation: Advanced Rain Forecasting Techniques
Predictive Precipitation: Advanced Rain Forecasting TechniquesPredictive Precipitation: Advanced Rain Forecasting Techniques
Predictive Precipitation: Advanced Rain Forecasting Techniques
 
Formulas dax para power bI de microsoft.pdf
Formulas dax para power bI de microsoft.pdfFormulas dax para power bI de microsoft.pdf
Formulas dax para power bI de microsoft.pdf
 
一比一原版加利福尼亚大学尔湾分校毕业证成绩单如何办理
一比一原版加利福尼亚大学尔湾分校毕业证成绩单如何办理一比一原版加利福尼亚大学尔湾分校毕业证成绩单如何办理
一比一原版加利福尼亚大学尔湾分校毕业证成绩单如何办理
 
一比一原版麦考瑞大学毕业证成绩单如何办理
一比一原版麦考瑞大学毕业证成绩单如何办理一比一原版麦考瑞大学毕业证成绩单如何办理
一比一原版麦考瑞大学毕业证成绩单如何办理
 
Aggregations - The Elasticsearch "GROUP BY"
Aggregations - The Elasticsearch "GROUP BY"Aggregations - The Elasticsearch "GROUP BY"
Aggregations - The Elasticsearch "GROUP BY"
 

Power BI Tips Visual Tooltips.pptx

  • 1. Power BI Tips and Timesavers Visual Tooltips In Power BI
  • 2. Visual Tooltips Power BI by default gives you basic tooltips, which present you with the values included in your visual But with a bit of set up you can improve them dramatically and really bring the reports to life
  • 3. Set up a Tooltip page Add a new tab, by clicking the plus and name it ‘Graphical Tooltip’ Set the page size, generally smaller is better, this example uses a larger tooltip for demo purposes Add visuals to your new page
  • 4. Activate the new tool tip On the new ‘Graphical Tooltip’ page Go to the visualizations pane Under page information, set the Tooltip slider to ON
  • 5. Select the Tooltip for each visual Select the first visual Go to the visualizations pane Under Tooltip Make sure it is set to on Type – Report Page Page – ‘Graphical Tooltip’ (the new tooltip page name we created) Repeat this step for each visual you want the tooltip to work for
  • 6. Enjoy Now when the user hovers over any of the visuals The new tooltip pops up showing more detail
  • 7. Visual tooltips in Power BI bring a rich user experience, giving your users the ability to explore what is behind the data It brings a real WOW factor and is a very efficient way to present further details Hope you find this useful
  • 8. For more Tips, Tricks and Timesavers, visit our website Business Analytics Blog – Select Distinct Credit: simon.harrison@selectdistinct.co.uk