Global Warming Poster Presentation
•
1 like•1,733 views

The aim of the presentation is to illustrate the reason behind the global warming and what is the impact of global warming and how we can mitigate it.

Recommended
More Related Content
What's hot
What's hot (20)
Similar to Global Warming Poster Presentation
Similar to Global Warming Poster Presentation (20)
More from Rihab Rahman
More from Rihab Rahman (12)
Recently uploaded
Recently uploaded (20)
Global Warming Poster Presentation
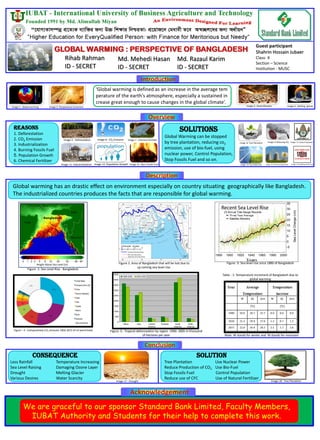
- 1. Rihab Rahman ID - SECRET ‘Global warming is defined as an increase in the average tem perature of the earth's atmosphere, especially a sustained in crease great enough to cause changes in the global climate’. Consequence Less Rainfall Temperature Increasing Sea Level Raising Damaging Ozone Layer Drought Melting Glacier Various Desires Water Scarcity Solution Tree Plantation Use Nuclear Power Reduce Production of CO2 Use Bio-Fuel Stop Fossils Fuel Control Population Reduce use of CFC Use of Natural Fertilizer Solutions Global Warming can be stopped by tree plantation, reducing co2 emission, use of bio-fuel, using nuclear power, Control Population, Stop Fossils Fuel and so on. Figure -5 : Tropical deforestation by region 1990- 2005 In thousand of hectares per year Global warming has an drastic effect on environment especially on country situating geographically like Bangladesh. The industrialized countries produces the facts that are responsible for global warming. Figure – 4 : Comparatively CO2 emission 1850-2015 (% of world total) Table - 1: Temperature increment of Bangladesh due to global warming Note: W stands for winter and M stands for monsoon Md. Mehedi Hasan ID - SECRET Md. Razaul Karim ID - SECRET Image-1 : Global warming Image-4 : Melting glacier Reasons 1. Deforestation 2. CO2 Emission 3. Industrialization 4. Burning Fossils Fuel 5. Population Growth 6. Chemical Fertilizer Image-5 : Deforestation Image-6 : CO2 Emission Image-11: Industrialization Image-12: Population Growth Image-7 : Chemical Fertilizer Image-13 : Burn Fossils Fuel Image- 8: Tree Plantation Image- 15: Use of nuclear powerImage- 14: Use of Bio-Fuel Image- 9: Reducing CO2 Image- 10: Control Population Image- 16: Stopping Fossils Fuel Figure 2: Area of Bangladesh that will be lost due to up coming sea-level rise. Figure -3: Sea-level rise since 1880 of Bangladesh Figure -1: Sea Level Rise - Bangladesh Height Above Sea Level (m) OFFSHORE ISLAND Coastal Limit Boundary ----------- Risk Zone Boundary …………… High Risk Zone Boundary 25 0 25 50 km Image-17 : Drought Image-18 : Tree Plantation We are graceful to our sponsor Standard Bank Limited, Faculty Members, IUBAT Authority and Students for their help to complete this work. Image-2: Temperature Increment Image-3 : Desertification Guest participant Shahrin Hossain Jubaer Class- X Section – Science Institution - MUSC