Download as PDF, PPTX


![Slide 21
Radware: State of the Union for Ecommerce Web Performance [Fall 2014]](https://image.slidesharecdn.com/radwarecmg2014tammy-evertsslowtime-vs-downtime-141105090117-conversion-gate02/85/The-Real-Cost-of-Slow-Time-vs-Downtime-21-320.jpg)
![Slide 24
Radware: State of the Union for Ecommerce Web Performance [Fall 2014]](https://image.slidesharecdn.com/radwarecmg2014tammy-evertsslowtime-vs-downtime-141105090117-conversion-gate02/85/The-Real-Cost-of-Slow-Time-vs-Downtime-24-320.jpg)
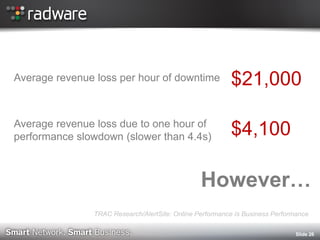
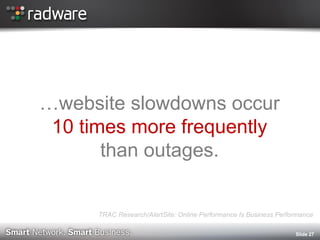
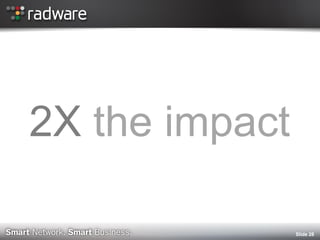
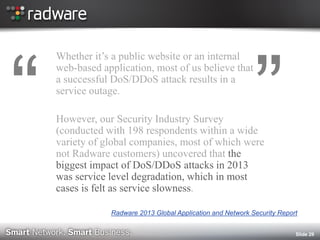
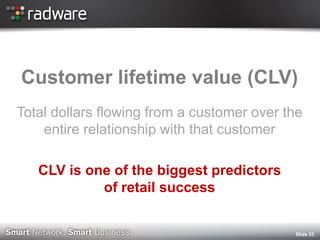
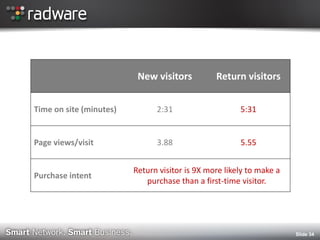

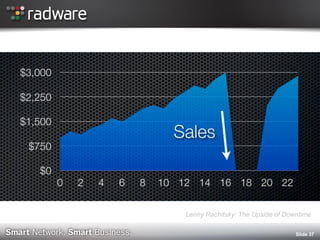
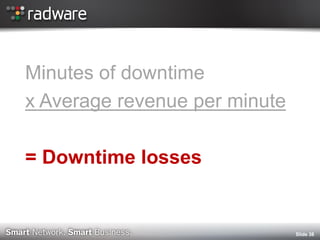

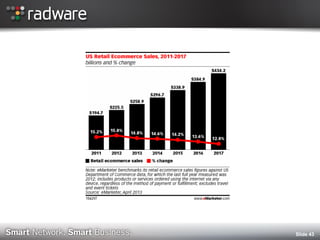
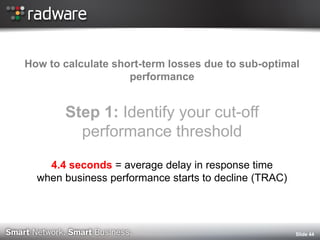
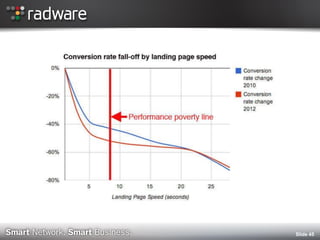
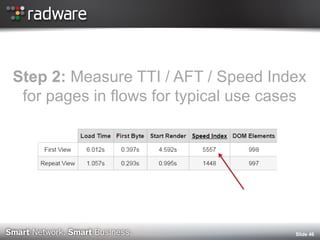
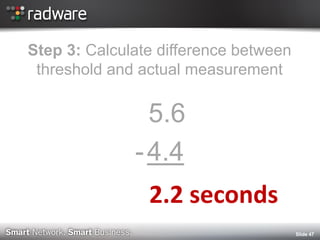
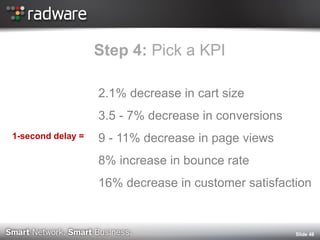
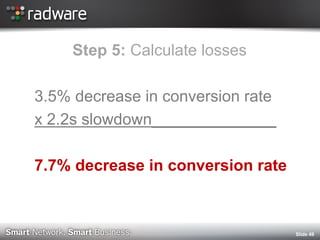
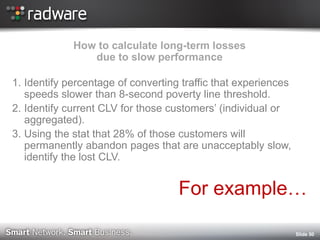
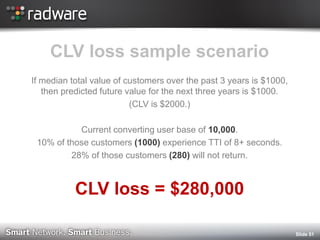
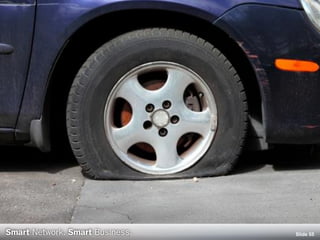

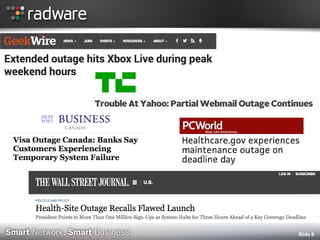
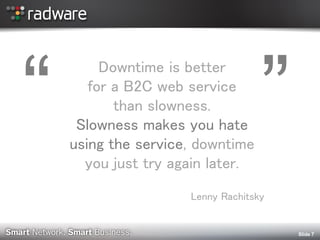
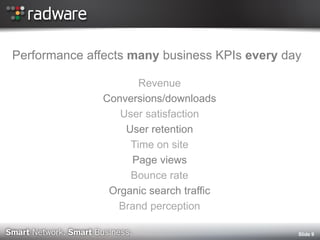
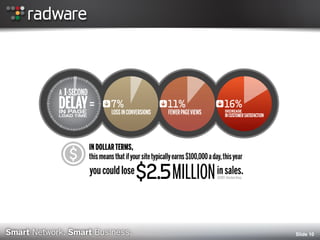
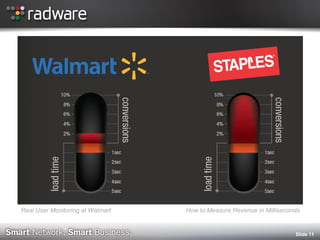
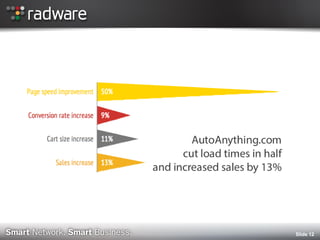
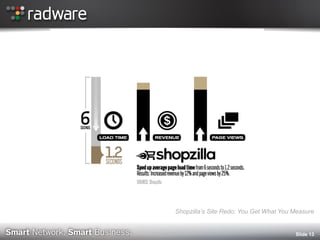
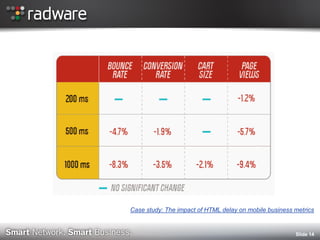
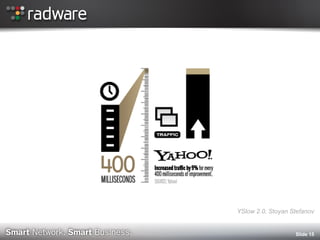
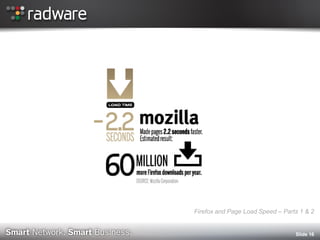
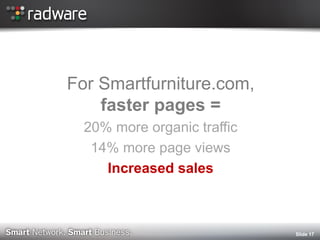
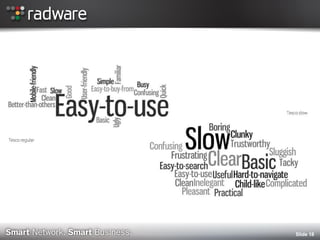
The document discusses the impact of website performance on business metrics, emphasizing that slowness is more detrimental than downtime for user engagement and revenue. It highlights that slow performance leads to significant drops in customer satisfaction, conversions, and overall online success, with real-world examples and case studies illustrating these effects. The findings suggest that performance issues are more frequent than outages and can severely affect long-term customer value and retention.


![The Art of Cyber War [From Black Hat Brazil 2014]](https://cdn.slidesharecdn.com/ss_thumbnails/radware-cyberwar-blackhatinfosec-141203101033-conversion-gate01-thumbnail.jpg?width=640&height=640&fit=bounds)


![Getting Started with Apache Spark: Big Data Made Simple [Free Meetup]](https://cdn.slidesharecdn.com/ss_thumbnails/apachesparkgettingstarted-260203175547-8361bcc3-thumbnail.jpg?width=640&height=640&fit=bounds)

