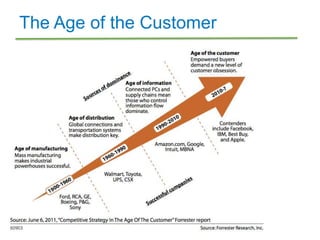
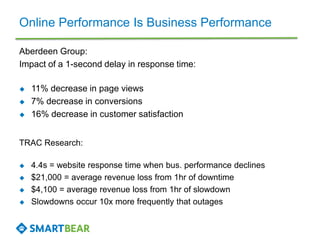
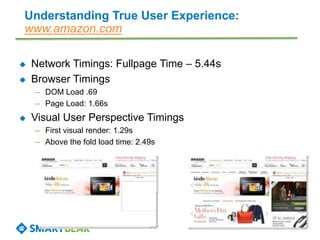
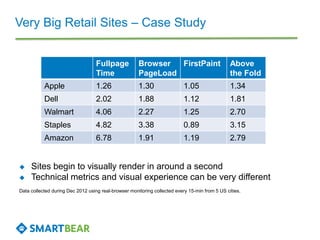
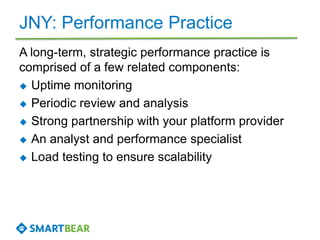
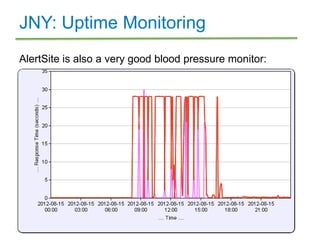
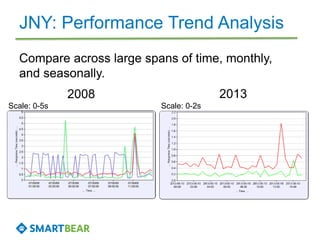
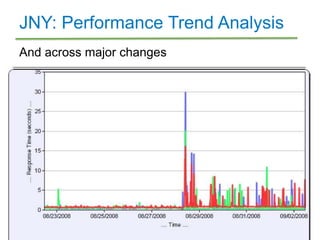
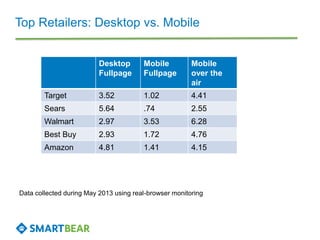
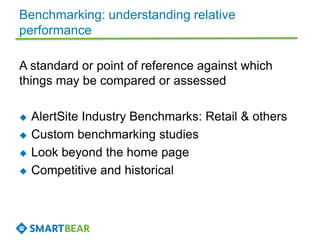
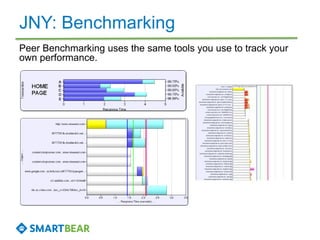
Finding the small changes that
can make a big difference.
Delivering amazing customer experiences
About Michael Hines
Michael Hines
VP, E-commerce technology
mhines@jny.com
About Ken Godskind
Ken Godskind
VP, Monitoring Products
@KenGodskind
Ken.Godskind@SmartBear.com
Florida Keys fanatic :)
The Age of the Customer
The Customer Experience Pyramid
*1992 KR Sanders, Human Computer Interaction, Carnegie
Mellon
Online Performance Is Business Performance
Aberdeen Group:
Impact of a 1-second delay in response time:
 11% decrease in page views
 7% decrease in conversions
 16% decrease in customer satisfaction
TRAC Research:
 4.4s = website response time when bus. performance declines
 $21,000 = average revenue loss from 1hr of downtime
 $4,100 = average revenue loss from 1hr of slowdown
 Slowdowns occur 10x more frequently that outages
 What does performance mean today?
 Which are the right performance metrics to focus on?
Understanding True User Experience:
WHAT DOES SPEED MEAN?
The “Network” The “Browser” The “User’s Eyes”
To manage User Experience you need all
three!
 Network Timings: Fullpage Time – 5.44s
 Browser Timings
– DOM Load .69
– Page Load: 1.66s
 Visual User Perspective Timings
– First visual render: 1.29s
– Above the fold load time: 2.49s
Understanding True User Experience:
www.amazon.com
Very Big Retail Sites – Case Study
Fullpage
Time
Browser
PageLoad
FirstPaint Above
the Fold
Apple 1.26 1.30 1.05 1.34
Dell 2.02 1.88 1.12 1.81
Walmart 4.06 2.27 1.25 2.70
Staples 4.82 3.38 0.89 3.15
Amazon 6.78 1.91 1.19 2.79
 Sites begin to visually render in around a second
 Technical metrics and visual experience can be very different
Data collected during Dec 2012 using real-browser monitoring collected every 15-min from 5 US cities.
JNY: Performance Practice
A long-term, strategic performance practice is
comprised of a few related components:
 Uptime monitoring
 Periodic review and analysis
 Strong partnership with your platform provider
 An analyst and performance specialist
 Load testing to ensure scalability
JNY: Uptime Monitoring
AlertSite is also a very good blood pressure monitor:
JNY: Downtime Alerting
 Phone Alerts enables my team to respond
instantly to downtime events.
 In the case of slowdowns instead of dark sites,
SmartBear’s Alertsite UE monitoring enables
me to see what my customers are
experiencing.
 I can see instantly if my fixes are working for
real world users.
JNY: Performance Trend Analysis
Compare across large spans of time, monthly,
and seasonally.
2008 2013
Scale: 0-5s Scale: 0-2s
JNY: Performance Trend Analysis
And across major changes
Mobile: The New Multi-screen World
*Google – The New Multi-screen World - research
Top Retailers: Desktop vs. Mobile
Desktop
Fullpage
Mobile
Fullpage
Mobile
over the
air
Target 3.52 1.02 4.41
Sears 5.64 .74 2.55
Walmart 2.97 3.53 6.28
Best Buy 2.93 1.72 4.76
Amazon 4.81 1.41 4.15
Data collected during May 2013 using real-browser monitoring
JNY: the mobile channel
 Our mobile business
has become the size of
a Large Pie Slice
 We have an integrated
mobile experience
 Next phase: driving
traffic to stores and
increasing conversion
through payment
methods and UE
Benchmarking: understanding relative
performance
A standard or point of reference against which
things may be compared or assessed
 AlertSite Industry Benchmarks: Retail & others
 Custom benchmarking studies
 Look beyond the home page
 Competitive and historical
JNY: Benchmarking
Peer Benchmarking uses the same tools you use to track your
own performance.
JNY: Benchmarking
You may do well or badly against your peers.
But don’t just look at the raw numbers. There are
other variables involved:
 Platform differences
 Performance goals vs Marketing goals
 Budget differences
JNY: Improving – part 1
Even if you are doing well, there is always room for Periodic,
Incremental, Performance Improvements
NineWest.com
JNY: Improving – part 2
Even if you are doing well, there is always room for Periodic,
Incremental, Performance Improvements
Site E
NineWest.com
JNY: Improving – part 3
The most gains to be made are in First Byte and
First Paint
Total
Response
Time
First
Byte
Content Fullpage
Response
Time
First
Paint
Above
Fold
DOM
Load
Page
Load
NW 2.11 0.66 1.43 2.82 1.64 2.09 1.43 2.08
SITE E 1.95 0.003 1.93 2.67 1.05 1.96 0.86 1.59
First Byte delivery time is dependent on the efficiency
of the platform and the code that composes the
page.
ContentViews – Managing Third-Party Content
Third-party content is everywhere!
CDNs, syndicated data, ad networks, visitor tracking
“I don’t want to be alerted
at 3:00 am because an
ad didn’t load on our
site.”
Is there a way for me to
report on how long the
ads are taking to load on
my pages?”
How can I ensure my
CDNs are delivering per
our SLA without having to
filter through everything
on my report?”
I only care about the xxx
portion of my website.
Other parts belong to the
xxx department. Can
notifications be sent just
for this portion?
Third Party – Case Study – Retargeting Tag
Fullpage Browser
PageLoad
FirstPaint Above
the Fold
3rd Party 3.10 2.63 2.13 3.66
No 3rd Party 2.69 2.12 2.22 3.53
 Network and browser shows .4s+ slowdown
 Negligible affect on Visual User Experience
 Technical metrics still meaningful because…
JNY: 3rd party content
 Our 3rd party content is overwhelmingly “tags”.
 Very hard to manage the myriad tags We are
moving toward a TagMan solution
 We currently have some 3rd Party content via
AJAX call. We’re pushing them to Akamize it.
Tips: the changes that make a difference
 Test and monitor the meaningful metrics
 Make sure you don’t forget about mobile
 Use benchmarks to help identify trouble spots
 Manage 3rd party content
 Practice, practice, practice…
Thank You
Stop by booth 1303
Let us show you how we can
help you deliver high quality
customer experiences

Smart bear & Jones Apparel - IRCE 2013 - Finding the small things that can make a big difference

  • 1.
    Finding the smallchanges that can make a big difference. Delivering amazing customer experiences
  • 2.
    About Michael Hines MichaelHines VP, E-commerce technology mhines@jny.com
  • 3.
    About Ken Godskind KenGodskind VP, Monitoring Products @KenGodskind Ken.Godskind@SmartBear.com Florida Keys fanatic :)
  • 4.
    The Age ofthe Customer
  • 5.
    The Customer ExperiencePyramid *1992 KR Sanders, Human Computer Interaction, Carnegie Mellon
  • 6.
    Online Performance IsBusiness Performance Aberdeen Group: Impact of a 1-second delay in response time:  11% decrease in page views  7% decrease in conversions  16% decrease in customer satisfaction TRAC Research:  4.4s = website response time when bus. performance declines  $21,000 = average revenue loss from 1hr of downtime  $4,100 = average revenue loss from 1hr of slowdown  Slowdowns occur 10x more frequently that outages
  • 7.
     What doesperformance mean today?  Which are the right performance metrics to focus on? Understanding True User Experience: WHAT DOES SPEED MEAN? The “Network” The “Browser” The “User’s Eyes” To manage User Experience you need all three!
  • 8.
     Network Timings:Fullpage Time – 5.44s  Browser Timings – DOM Load .69 – Page Load: 1.66s  Visual User Perspective Timings – First visual render: 1.29s – Above the fold load time: 2.49s Understanding True User Experience: www.amazon.com
  • 9.
    Very Big RetailSites – Case Study Fullpage Time Browser PageLoad FirstPaint Above the Fold Apple 1.26 1.30 1.05 1.34 Dell 2.02 1.88 1.12 1.81 Walmart 4.06 2.27 1.25 2.70 Staples 4.82 3.38 0.89 3.15 Amazon 6.78 1.91 1.19 2.79  Sites begin to visually render in around a second  Technical metrics and visual experience can be very different Data collected during Dec 2012 using real-browser monitoring collected every 15-min from 5 US cities.
  • 10.
    JNY: Performance Practice Along-term, strategic performance practice is comprised of a few related components:  Uptime monitoring  Periodic review and analysis  Strong partnership with your platform provider  An analyst and performance specialist  Load testing to ensure scalability
  • 11.
    JNY: Uptime Monitoring AlertSiteis also a very good blood pressure monitor:
  • 12.
    JNY: Downtime Alerting Phone Alerts enables my team to respond instantly to downtime events.  In the case of slowdowns instead of dark sites, SmartBear’s Alertsite UE monitoring enables me to see what my customers are experiencing.  I can see instantly if my fixes are working for real world users.
  • 13.
    JNY: Performance TrendAnalysis Compare across large spans of time, monthly, and seasonally. 2008 2013 Scale: 0-5s Scale: 0-2s
  • 14.
    JNY: Performance TrendAnalysis And across major changes
  • 15.
    Mobile: The NewMulti-screen World *Google – The New Multi-screen World - research
  • 16.
    Top Retailers: Desktopvs. Mobile Desktop Fullpage Mobile Fullpage Mobile over the air Target 3.52 1.02 4.41 Sears 5.64 .74 2.55 Walmart 2.97 3.53 6.28 Best Buy 2.93 1.72 4.76 Amazon 4.81 1.41 4.15 Data collected during May 2013 using real-browser monitoring
  • 17.
    JNY: the mobilechannel  Our mobile business has become the size of a Large Pie Slice  We have an integrated mobile experience  Next phase: driving traffic to stores and increasing conversion through payment methods and UE
  • 18.
    Benchmarking: understanding relative performance Astandard or point of reference against which things may be compared or assessed  AlertSite Industry Benchmarks: Retail & others  Custom benchmarking studies  Look beyond the home page  Competitive and historical
  • 19.
    JNY: Benchmarking Peer Benchmarkinguses the same tools you use to track your own performance.
  • 20.
    JNY: Benchmarking You maydo well or badly against your peers. But don’t just look at the raw numbers. There are other variables involved:  Platform differences  Performance goals vs Marketing goals  Budget differences
  • 21.
    JNY: Improving –part 1 Even if you are doing well, there is always room for Periodic, Incremental, Performance Improvements NineWest.com
  • 22.
    JNY: Improving –part 2 Even if you are doing well, there is always room for Periodic, Incremental, Performance Improvements Site E NineWest.com
  • 23.
    JNY: Improving –part 3 The most gains to be made are in First Byte and First Paint Total Response Time First Byte Content Fullpage Response Time First Paint Above Fold DOM Load Page Load NW 2.11 0.66 1.43 2.82 1.64 2.09 1.43 2.08 SITE E 1.95 0.003 1.93 2.67 1.05 1.96 0.86 1.59 First Byte delivery time is dependent on the efficiency of the platform and the code that composes the page.
  • 24.
    ContentViews – ManagingThird-Party Content Third-party content is everywhere! CDNs, syndicated data, ad networks, visitor tracking “I don’t want to be alerted at 3:00 am because an ad didn’t load on our site.” Is there a way for me to report on how long the ads are taking to load on my pages?” How can I ensure my CDNs are delivering per our SLA without having to filter through everything on my report?” I only care about the xxx portion of my website. Other parts belong to the xxx department. Can notifications be sent just for this portion?
  • 25.
    Third Party –Case Study – Retargeting Tag Fullpage Browser PageLoad FirstPaint Above the Fold 3rd Party 3.10 2.63 2.13 3.66 No 3rd Party 2.69 2.12 2.22 3.53  Network and browser shows .4s+ slowdown  Negligible affect on Visual User Experience  Technical metrics still meaningful because…
  • 26.
    JNY: 3rd partycontent  Our 3rd party content is overwhelmingly “tags”.  Very hard to manage the myriad tags We are moving toward a TagMan solution  We currently have some 3rd Party content via AJAX call. We’re pushing them to Akamize it.
  • 27.
    Tips: the changesthat make a difference  Test and monitor the meaningful metrics  Make sure you don’t forget about mobile  Use benchmarks to help identify trouble spots  Manage 3rd party content  Practice, practice, practice…
  • 28.
    Thank You Stop bybooth 1303 Let us show you how we can help you deliver high quality customer experiences

Editor's Notes

  • #5 This material is really mostly from Forrester Research, Kerry Bodine and Harley Manning and their new book Outside In.I’m not standing here and saying all traditional retailing – branding and logistics – are dead.But…the internet, social, mobile and always connected, as well as competition are changing the rules about the way customers find and learn about the products and services they want.To quote from their book…Whether we know it or not, we are all in the Customer Experience business!
  • #6 This is also from Kerry and Harley’s book but it was originally from some HCI research at Carnegie Mellon.What is customer experience?Customer experience is how your customers perceive their entire interactions with your company. For many of us here today the segment of Cust Ex that we are honing here this week is UX which defines how customers perceive their digital relationship with your company.But…What I’m really trying to show here is that ”I was able to get it done” is not enough anymore.Our iPhones and iPads and Apps have spoiled us.To deliver really high quality user experiences we need to make it easy and fun and ultimately to have our customers be delighted by their interactions.
  • #7 So who are we today!We are the southernmost business unit of SmartBear software.We have 2300 customers.There are 80 worldwide geographies in AlertSite’s monitoring network including mobile carrier networks.We have the industries most advanced synthetic monitoring capabilities using REAL BROWSERS – FF, IE, ChromeWe can monitor: DNS, Email, and other basic IP services others cannot.We’re about to release the industries most capable Web Service and API mointoring (talk more in a few minutes)We support mobile web performance monitoring.
  • #8 What is performance?How do you measure that today?Story about DejaClick architect – Today’s web pages are like a move. Constantly changing.How do you measure performance in those situations?Technical Performance will tell you how long it takes to get ALL of theMaturity Levels.
  • #16 Why is there more to it? Because it is now truly a multiscreen world.I read this Ad Age piece asking a couple weeks back, “Is your brand ready for Generation-SCREEN. It talked about how young children, say 5 and below, will never know a world without screens.It made me laugh for 2 reasons – It’s not Gen-Screen but Gen-SCREENS and it’s not just the kids.If you saw my house at 9P you would see for yourself what a multi-screen world it is.The Mrs. Checking or repsonding to email on her iPhone, the TV on, my oldest teen daughter on the couch diong homework on her laptop and texting and FBing on her iPhone.And then a few days later I came across this fantastic research from Google on The New Multi-Screen world.But my point here is as retailers we have to learn to interact, with continuity, in this new multi-screen world in a way that delights our customers.Feel free to email me or tweet at me if you want me to share the link to thie Google research. It’s worth consuming.