Download as PDF, PPTX


![Sources
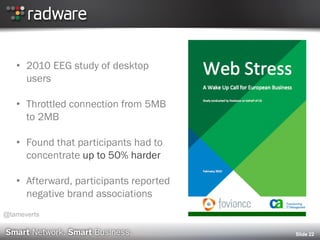
Web Stress: A Wake-Up Call for European Business (Foviance, 2010)
http://www.ca.com/us/~/media/files/supportingpieces/final_webstress_survey_report_229296.aspx
2013 Social & Mobile Commerce Consumer Report (Shop.org / comScore)
http://shop.org/research/original/2013-social-mobile-commerce-consumer-report
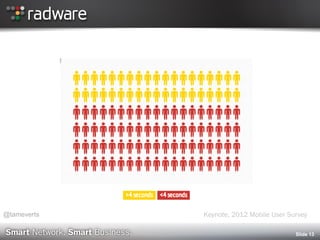
2012 Mobile User Survey (Keynote)
http://www.keynote.com/docs/reports/Keynote-2012-Mobile-User-Survey.pdf
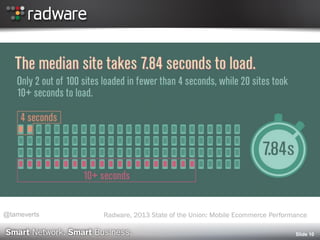
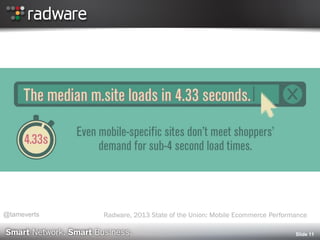
2013 State of the Union: Mobile Ecommerce Performance (Radware)
http://www.radware.com/mobile-sotu2013/
The Danger of a Poor Mobile Shopping Experience [INFOGRAPHIC]
http://www.getelastic.com/the-danger-of-a-poor-mobile-shopping-experience-infographic/
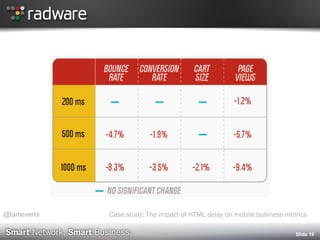
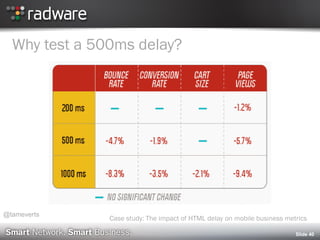
Case study: The impact of HTML delay on mobile business metrics (Web Performance Today, November 2011)
http://www.webperformancetoday.com/2011/11/23/case-study-slow-page-load-mobile-business-metrics/
Slide 57](https://image.slidesharecdn.com/radwareemetricsmobileperformancewebstresstammy-everts-140618093648-phpapp01/85/Emotional-Engagement-and-Brand-Perception-57-320.jpg)


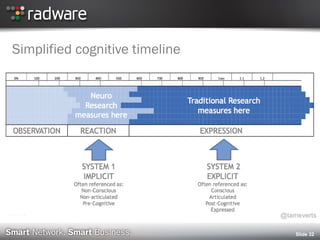
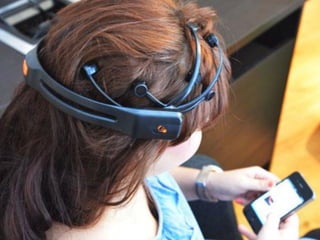
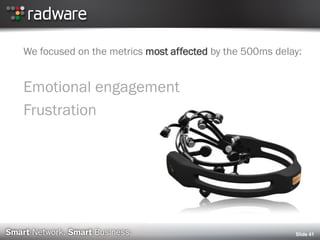
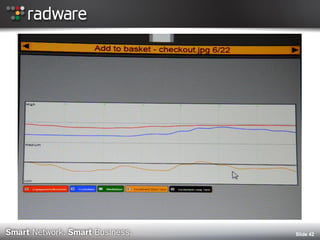
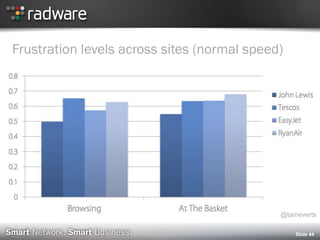
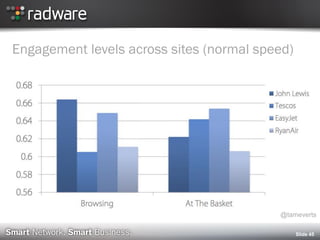
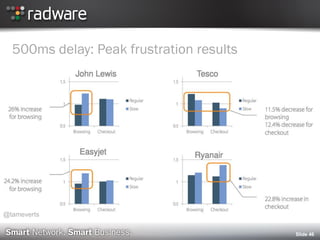
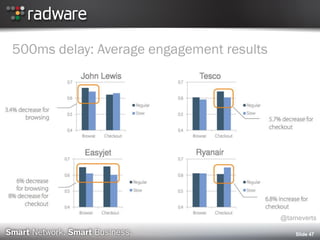
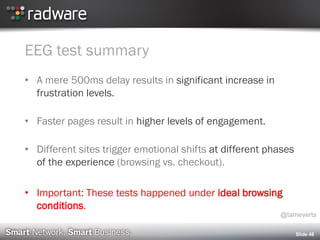
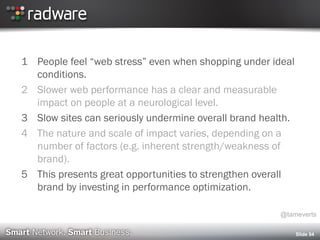
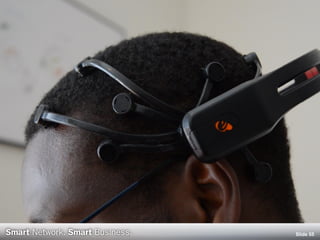
The document discusses a study on the impact of mobile web performance on emotional engagement and brand perception using EEG technology. It highlights that slow loading times on mobile devices negatively affect users' emotions and can lead to higher frustration and lower engagement, ultimately harming brand health. The findings emphasize the importance of optimizing mobile performance to enhance overall consumer experience and brand strength.


![[CXL Live 16] Opening Keynote by Peep Laja](https://cdn.slidesharecdn.com/ss_thumbnails/01peeplaja-openingkeynote-160401004912-thumbnail.jpg?width=640&height=640&fit=bounds)


![The Art of Cyber War [From Black Hat Brazil 2014]](https://cdn.slidesharecdn.com/ss_thumbnails/radware-cyberwar-blackhatinfosec-141203101033-conversion-gate01-thumbnail.jpg?width=640&height=640&fit=bounds)


