Download to read offline
![Measuring the Business Impact
of Web Performance
1
Buddy Brewer [@bbrewer]](https://image.slidesharecdn.com/howtomeasurethebusinessimpactofwebperformance-141105155152-conversion-gate01-150608211049-lva1-app6891/85/How-to-the-Measure-Business-impact-of-Web-Performance-1-320.jpg)
![Measuring the Business Impact
of Web Performance
1
Buddy Brewer [@bbrewer]](https://image.slidesharecdn.com/howtomeasurethebusinessimpactofwebperformance-141105155152-conversion-gate01-150608211049-lva1-app6891/75/How-to-the-Measure-Business-impact-of-Web-Performance-1-2048.jpg)

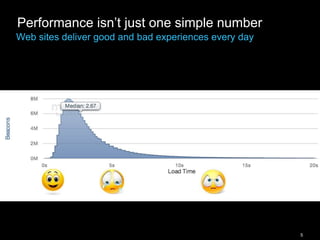

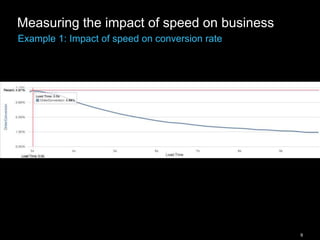

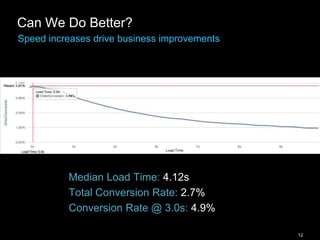
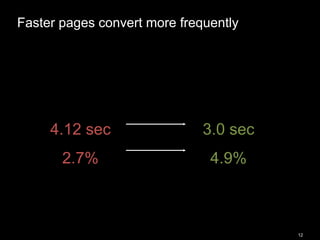
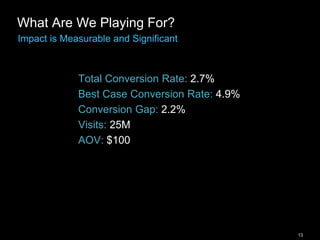

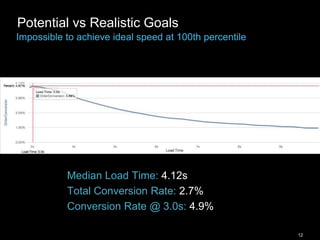
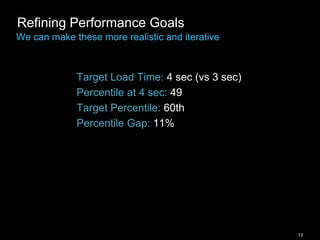
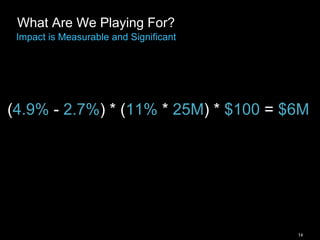
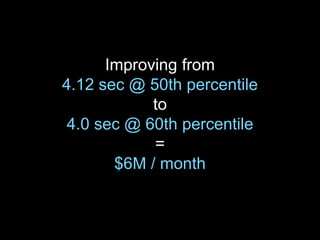


This document discusses measuring the business impact of web performance. It provides examples showing how reducing load times by just 1 second can significantly increase conversion rates and revenue. Specifically, for a site with 25 million visits per month, reducing average load time from 4.12 to 3 seconds could increase conversions from 2.7% to 4.9%, representing a potential revenue increase of $55 million. While impossible to achieve the fastest speeds for all users, even modest improvements like reducing average time to 4 seconds for 60% of users could yield $6 million more per month. The key is to iteratively measure, target, and refine performance goals to realize significant gains.


![[Webinar] Getting started with server-side testing - presented by WiderFunnel...](https://cdn.slidesharecdn.com/ss_thumbnails/serversidetestingwebinardeck-171213214850-thumbnail.jpg?width=640&height=640&fit=bounds)


