Download as PDF, PPTX


![web0060 66.249.71.110 - - [24/Aug/2011:04:16:52
+0000] "GET /listing/12189259/tropical-etched-
pair-of-lampwork-glass HTTP/1.1" 200 11034 "-"
"Mozilla/5.0 (compatible; Googlebot/2.1;
+http://www.google.com/bot.html)"
- 13399576 505780 554876](https://image.slidesharecdn.com/webperformanceatetsynywebperf-120119095609-phpapp02/75/Web-Performance-Culture-and-Tools-at-Etsy-55-2048.jpg)
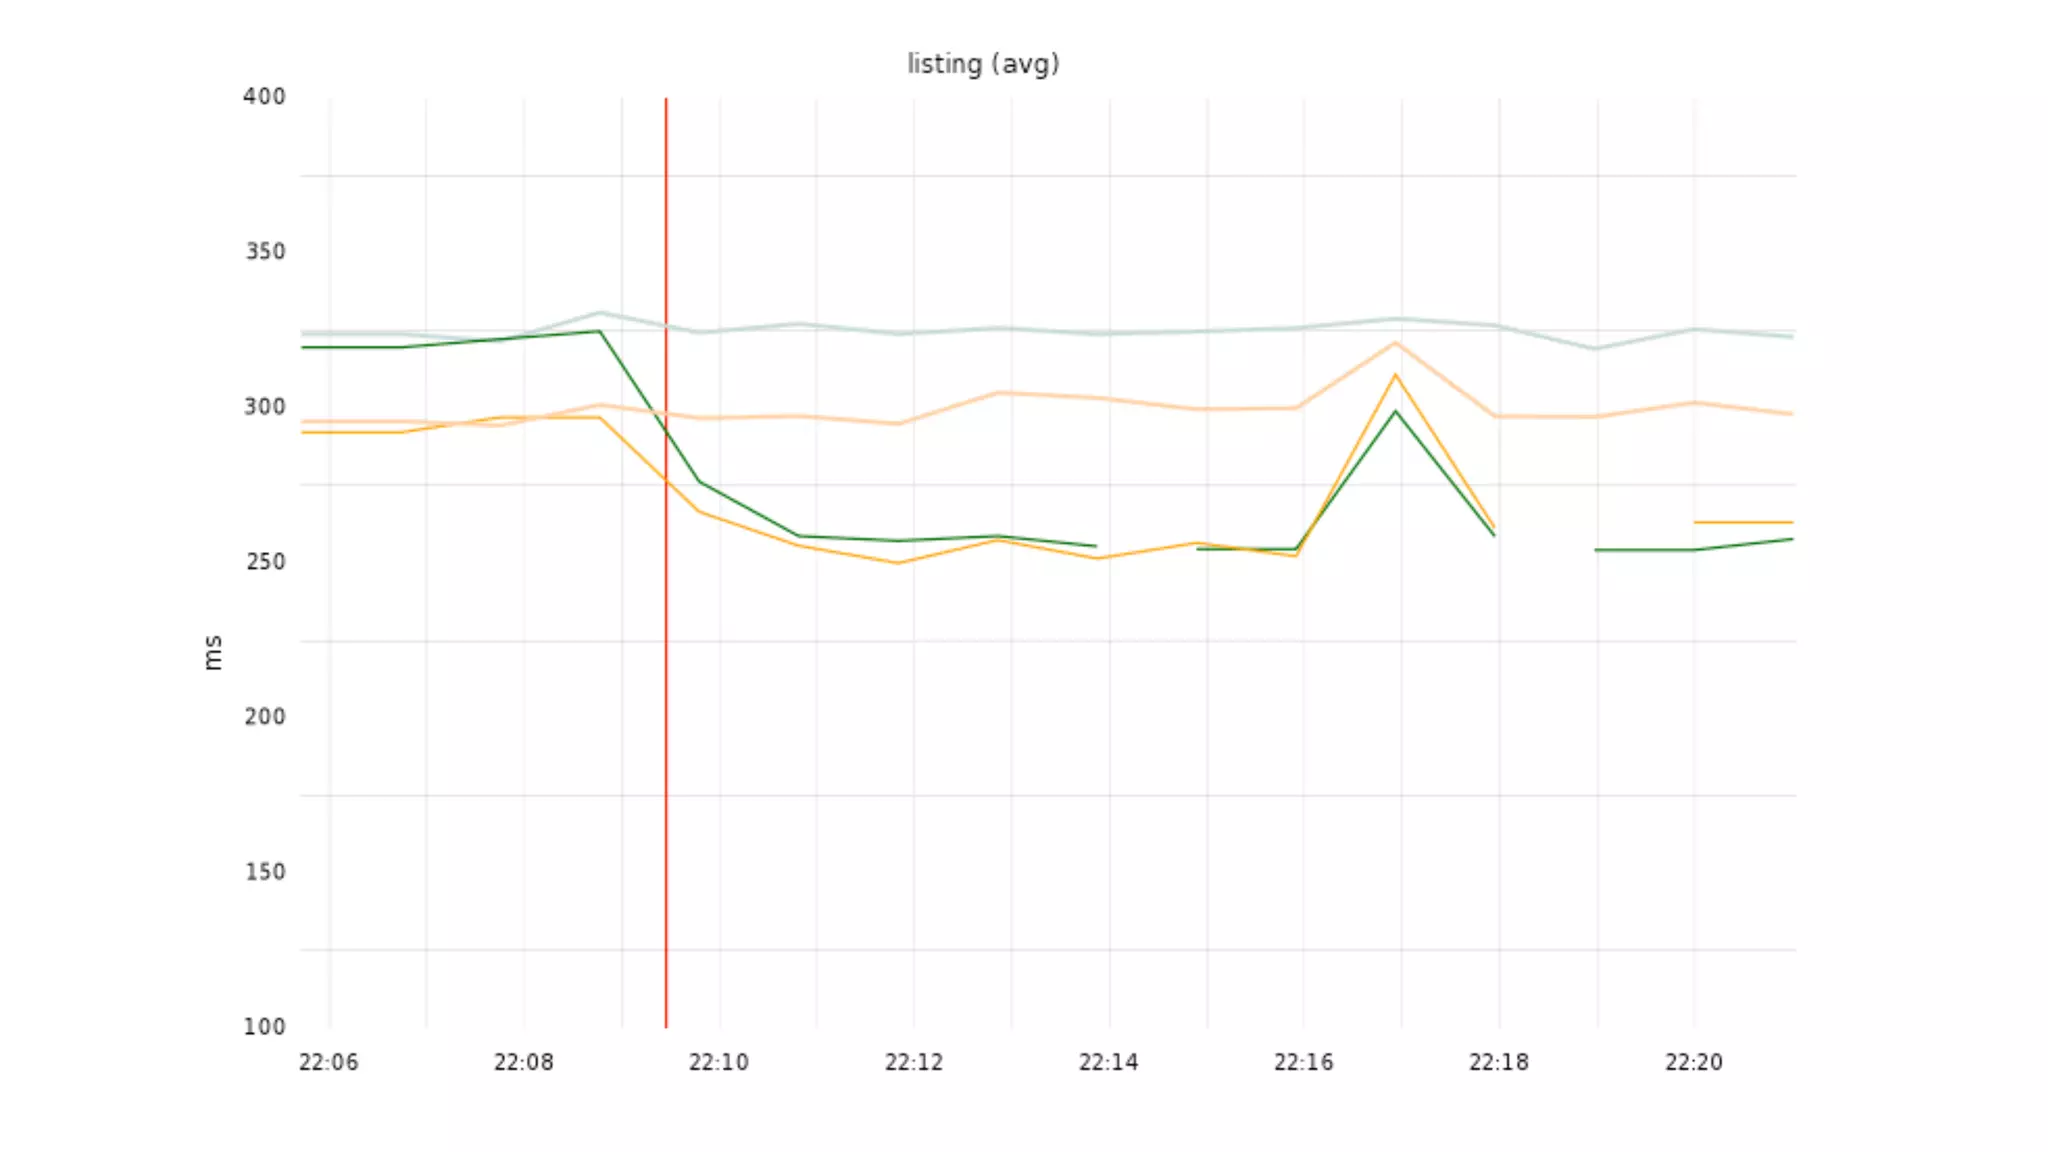
![Quick graphs
grep "GET /listing/" access.log |
perl -pe "s/.*[.*d{4}:(d{2}):(d{2}):d{2}.*]/1:2/" |
awk '{print $1, $(NF-1)}' > /tmp/pagetimes.dat
gives you...](https://image.slidesharecdn.com/webperformanceatetsynywebperf-120119095609-phpapp02/75/Web-Performance-Culture-and-Tools-at-Etsy-58-2048.jpg)

![Quick graphs
# GNUPLOT
set terminal png
set output 'listings.png'
set yrange [0:2000]
set xdata time
set timefmt "%d/%B/%Y:%H:%M:%S"
set format x "%H:%M"
plot '/tmp/pagetimes.dat' using 1:2 with points](https://image.slidesharecdn.com/webperformanceatetsynywebperf-120119095609-phpapp02/75/Web-Performance-Culture-and-Tools-at-Etsy-60-2048.jpg)
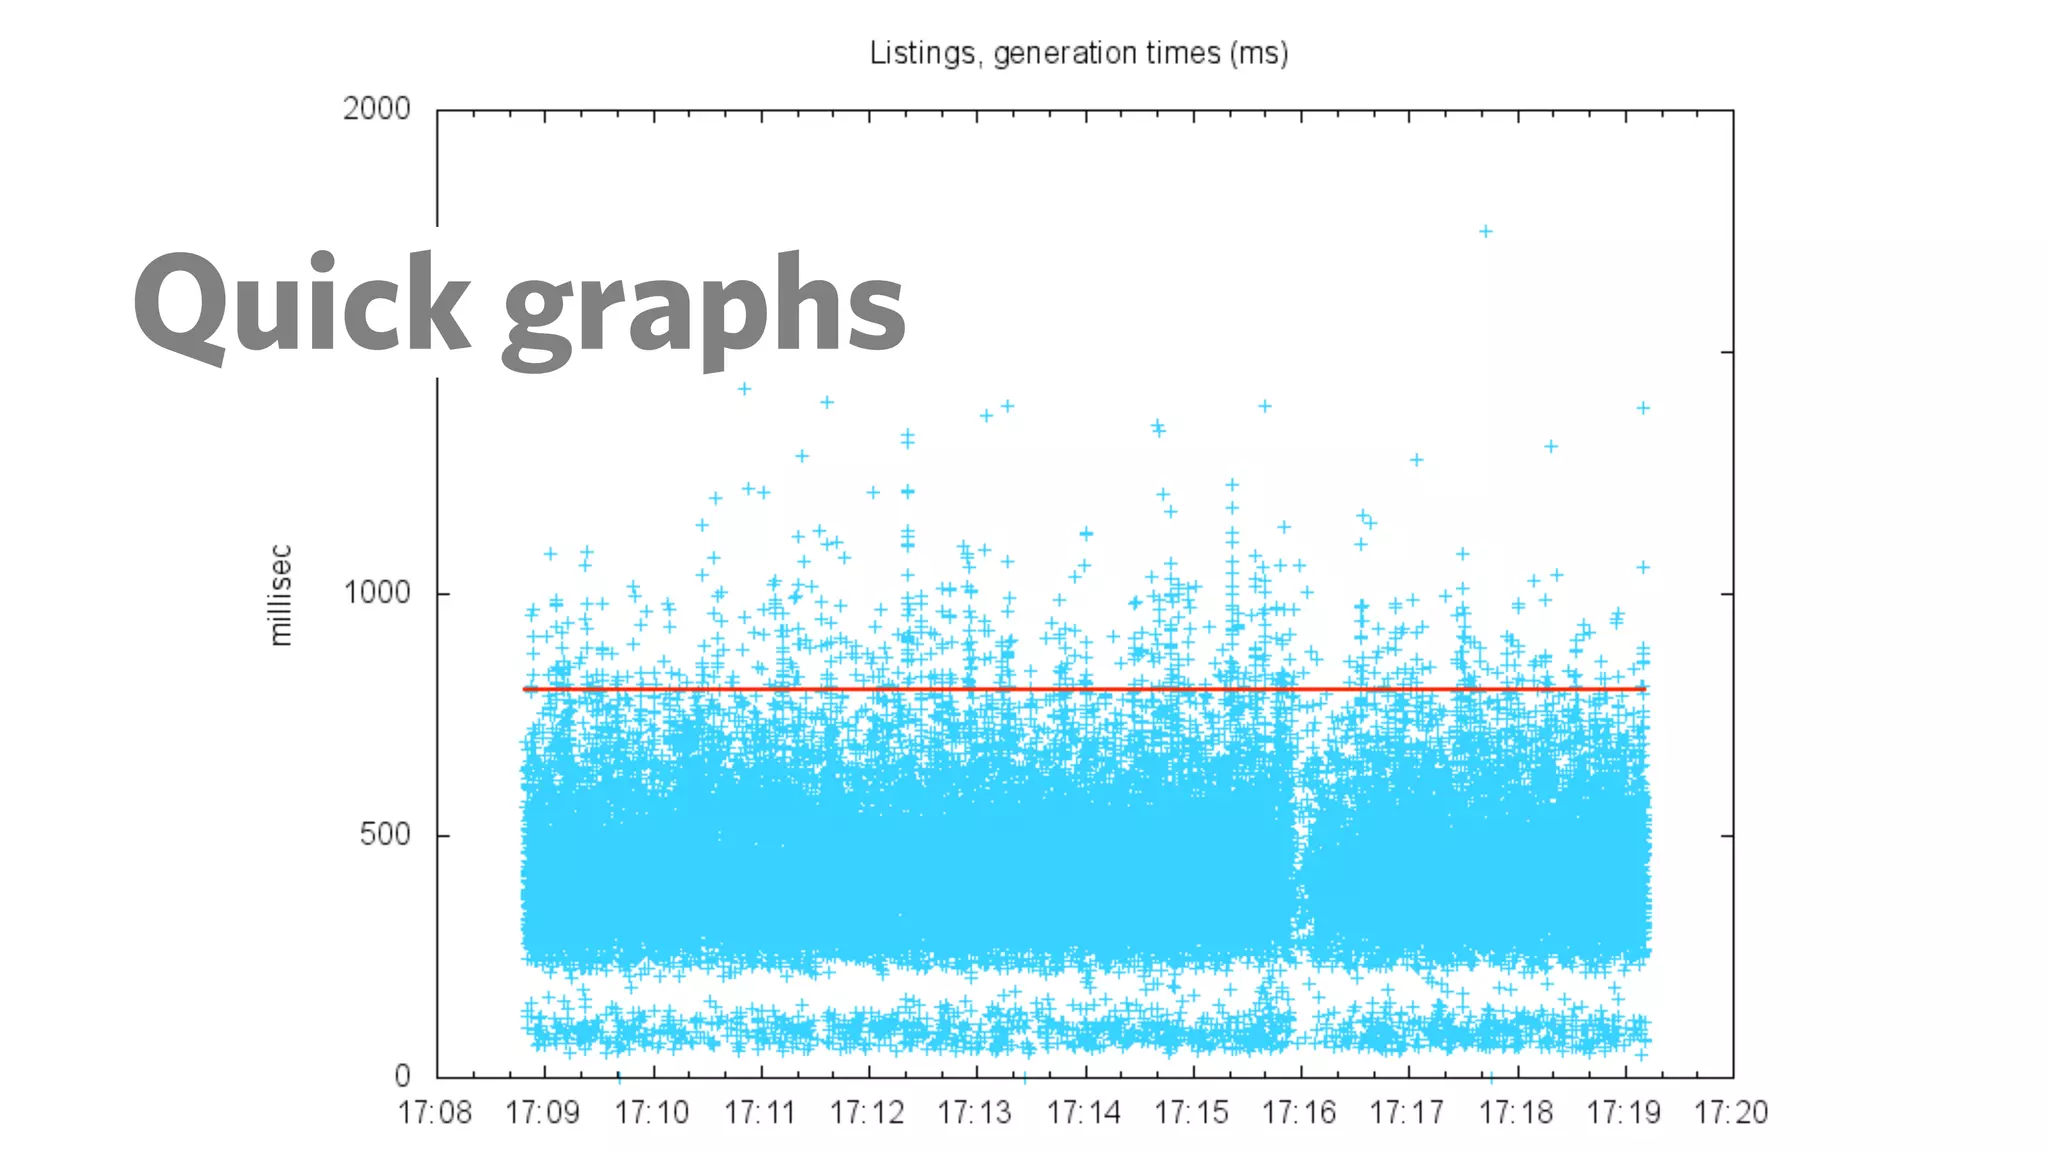
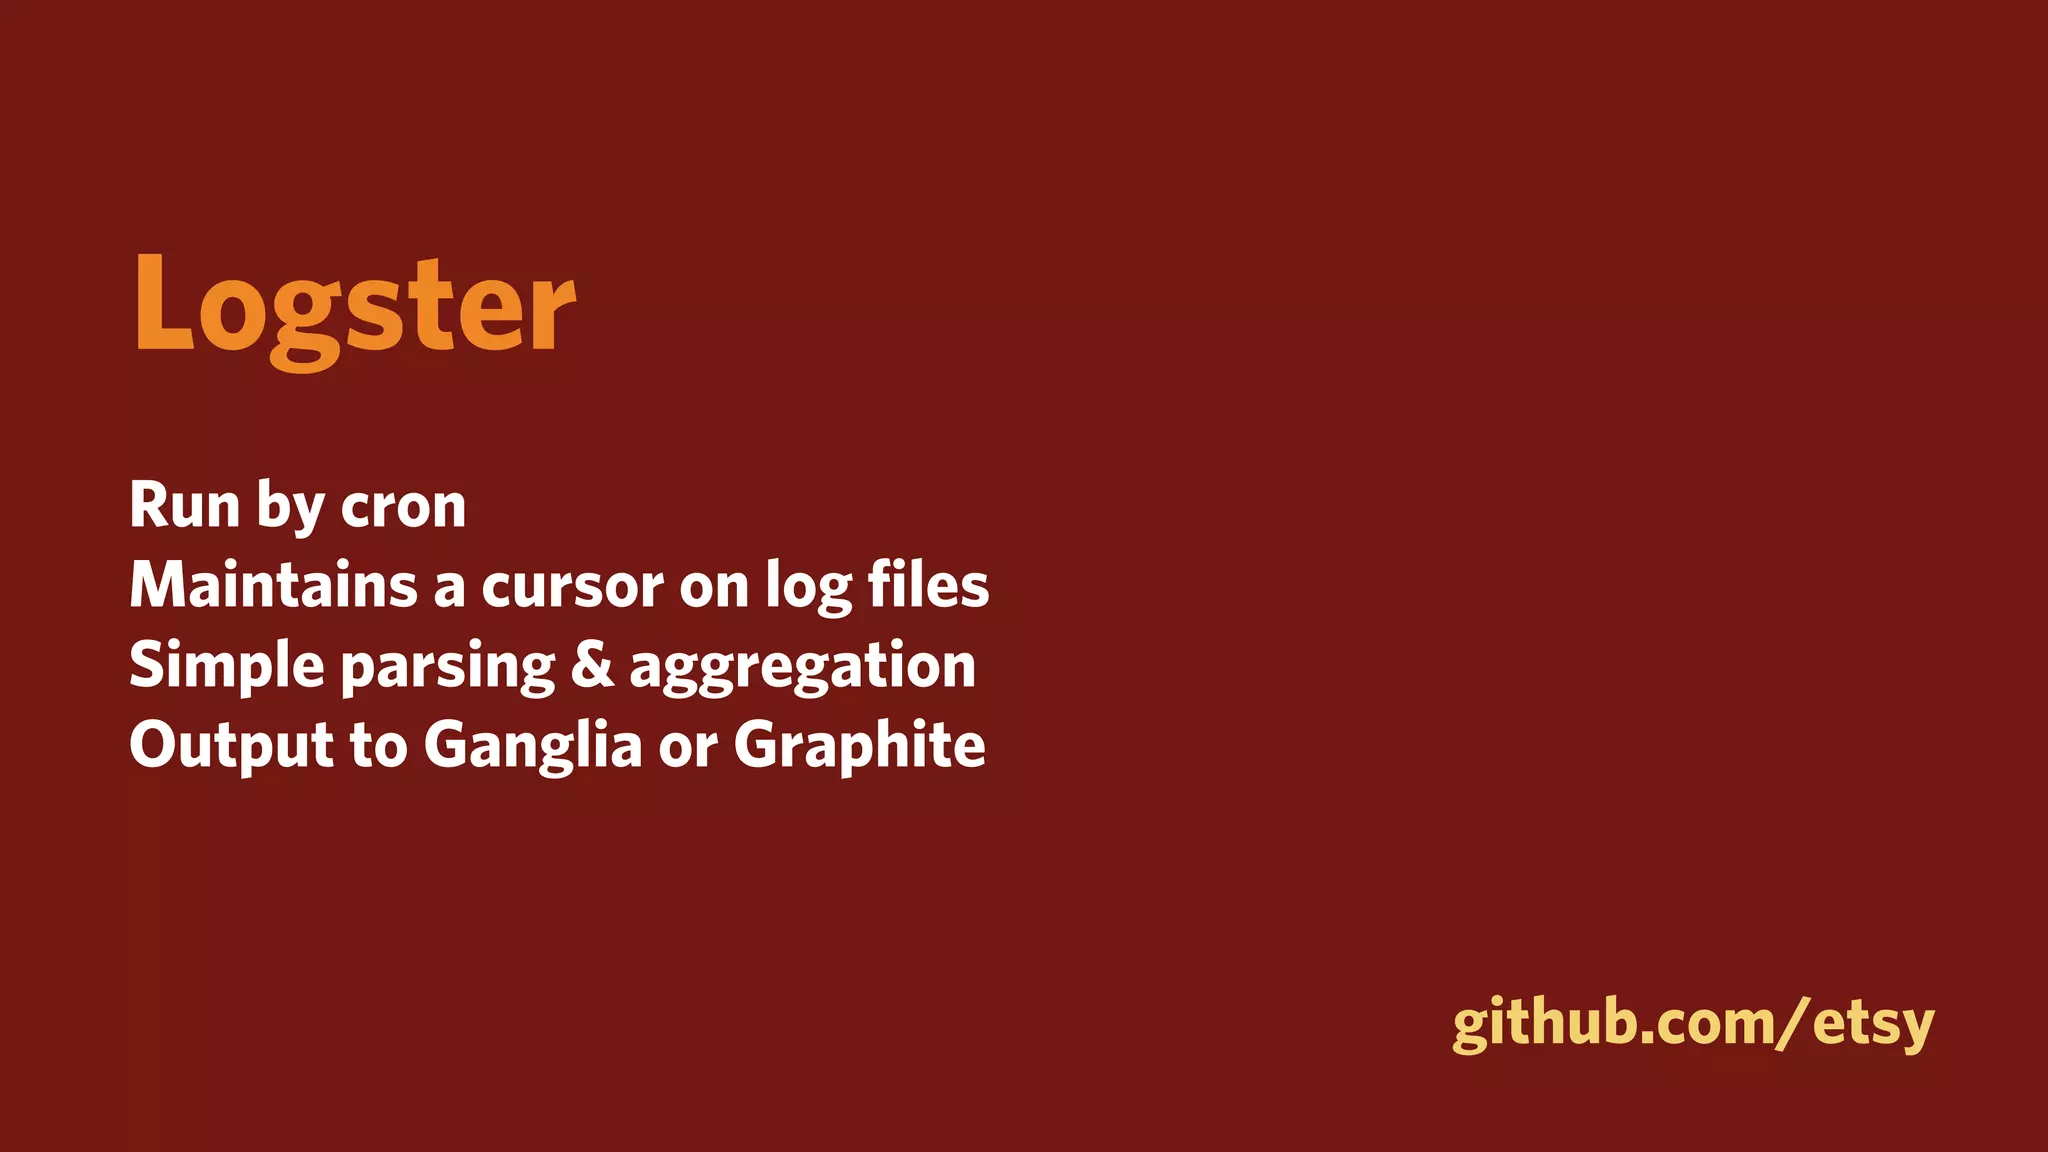
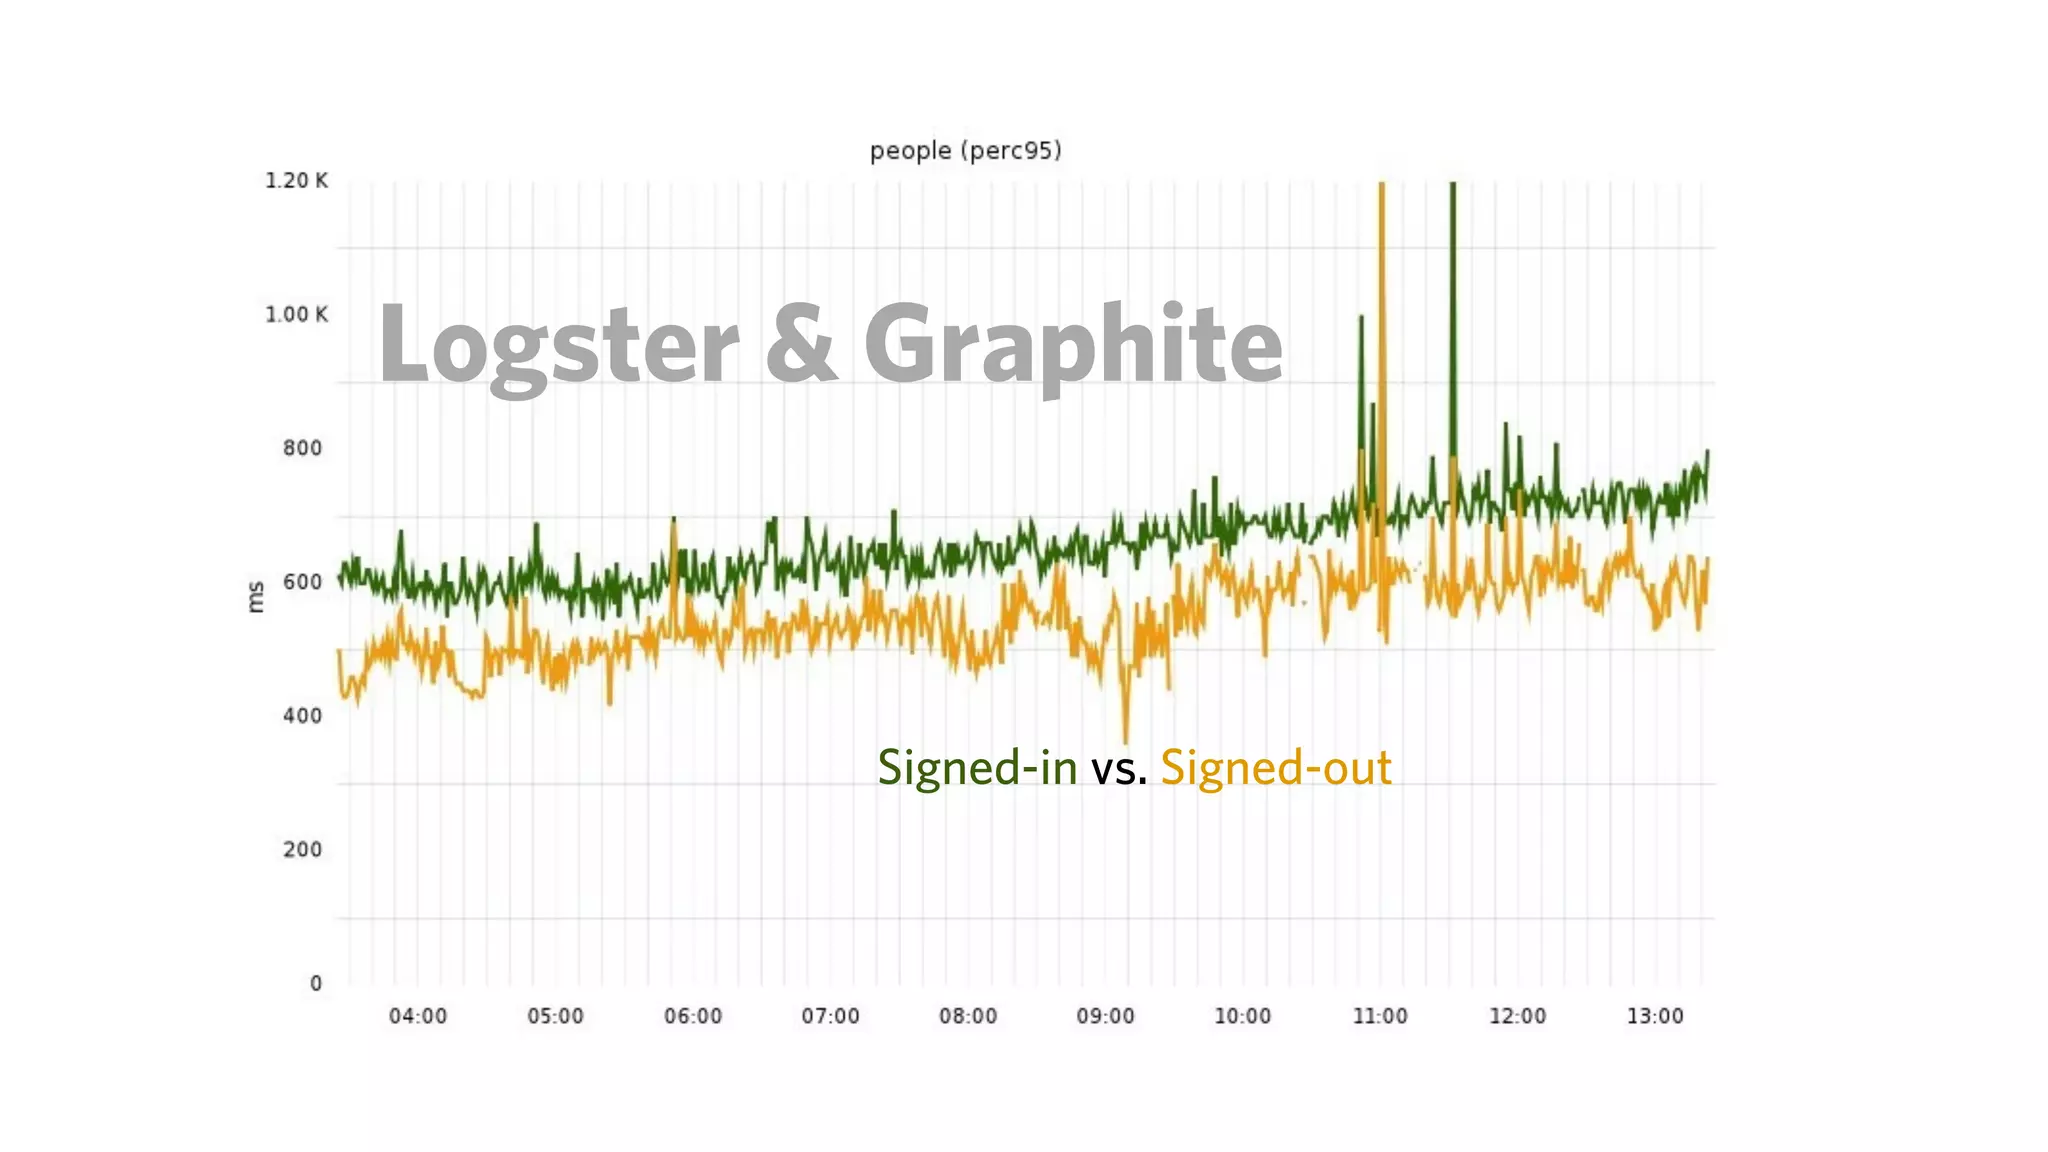
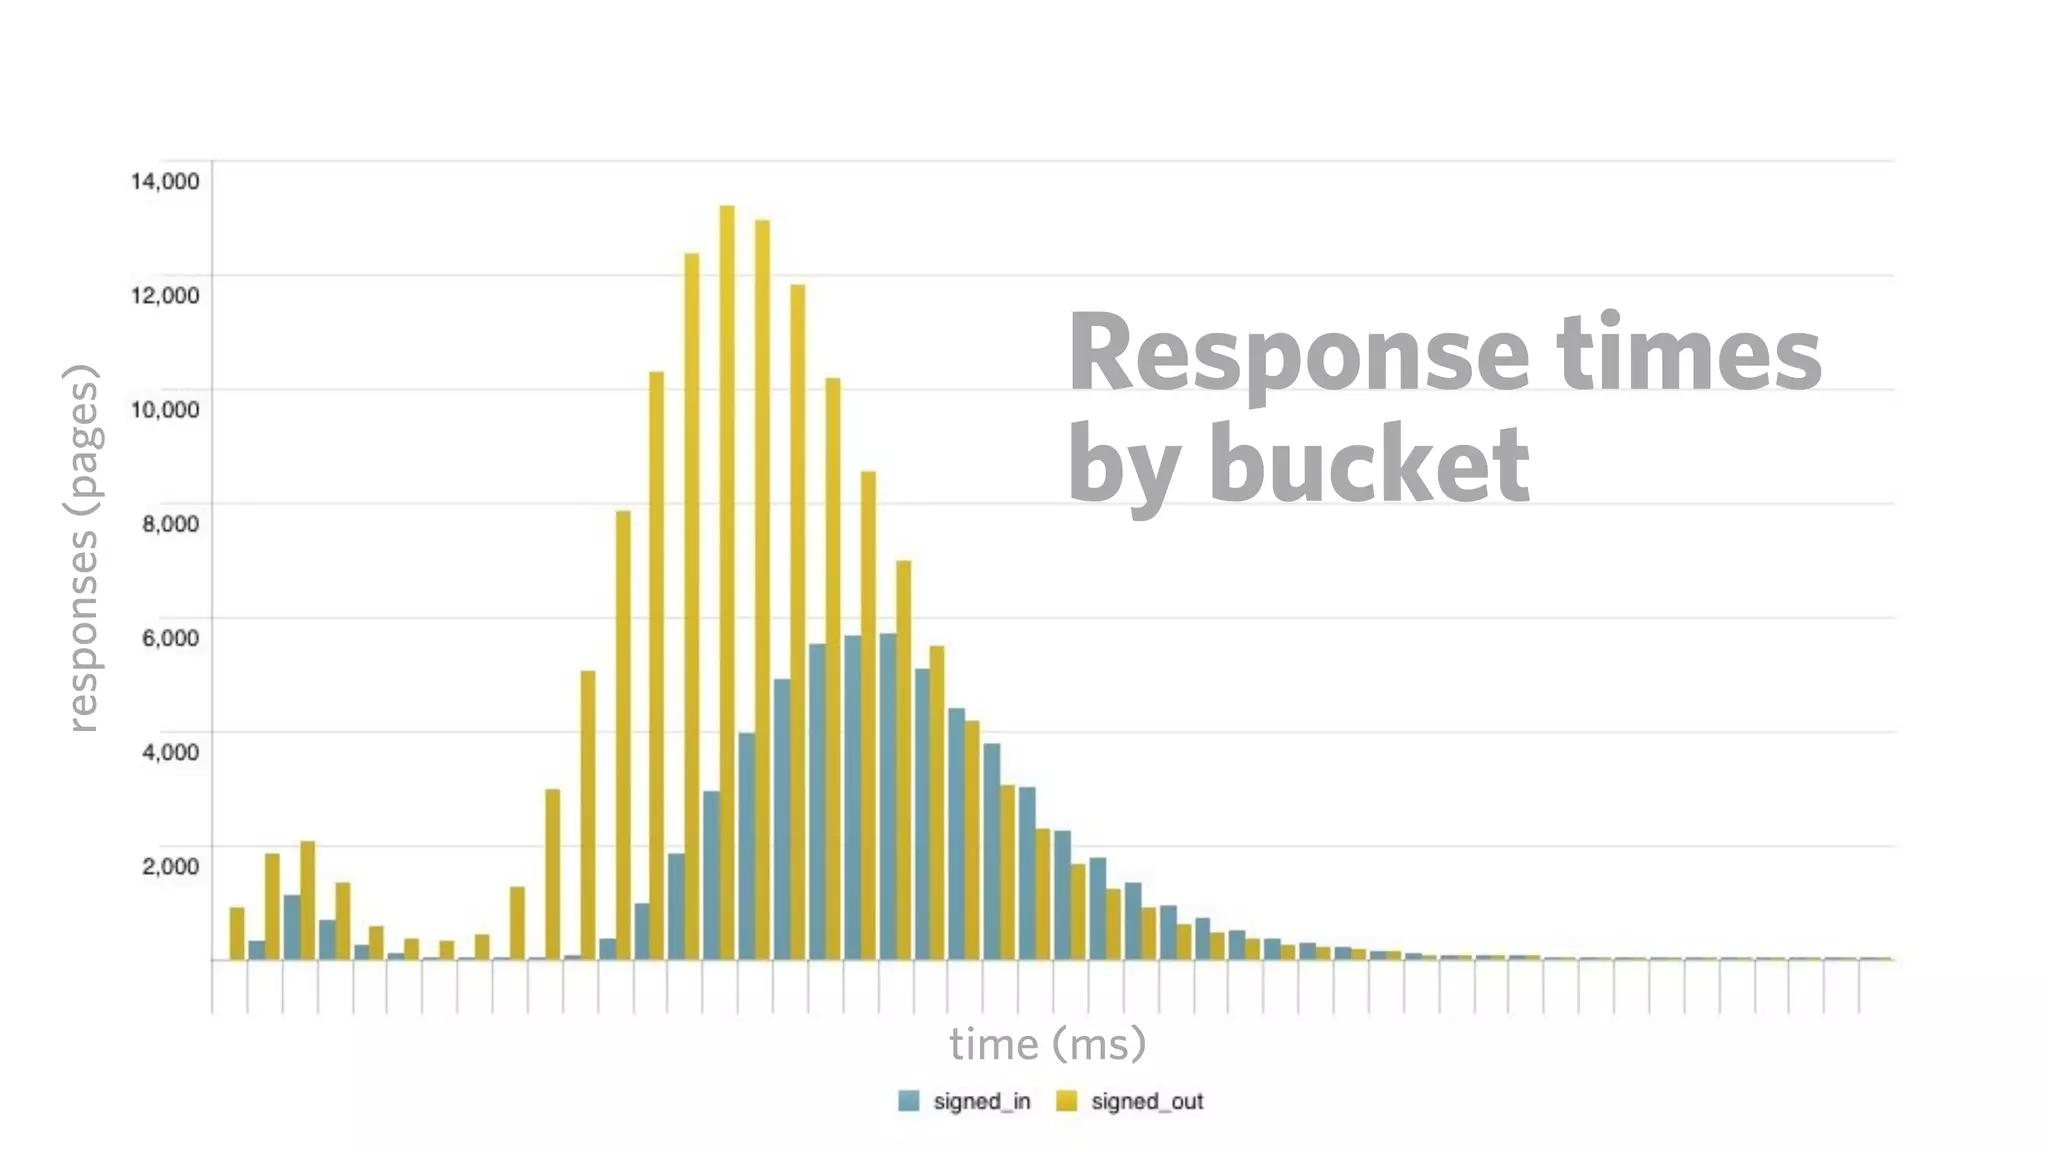

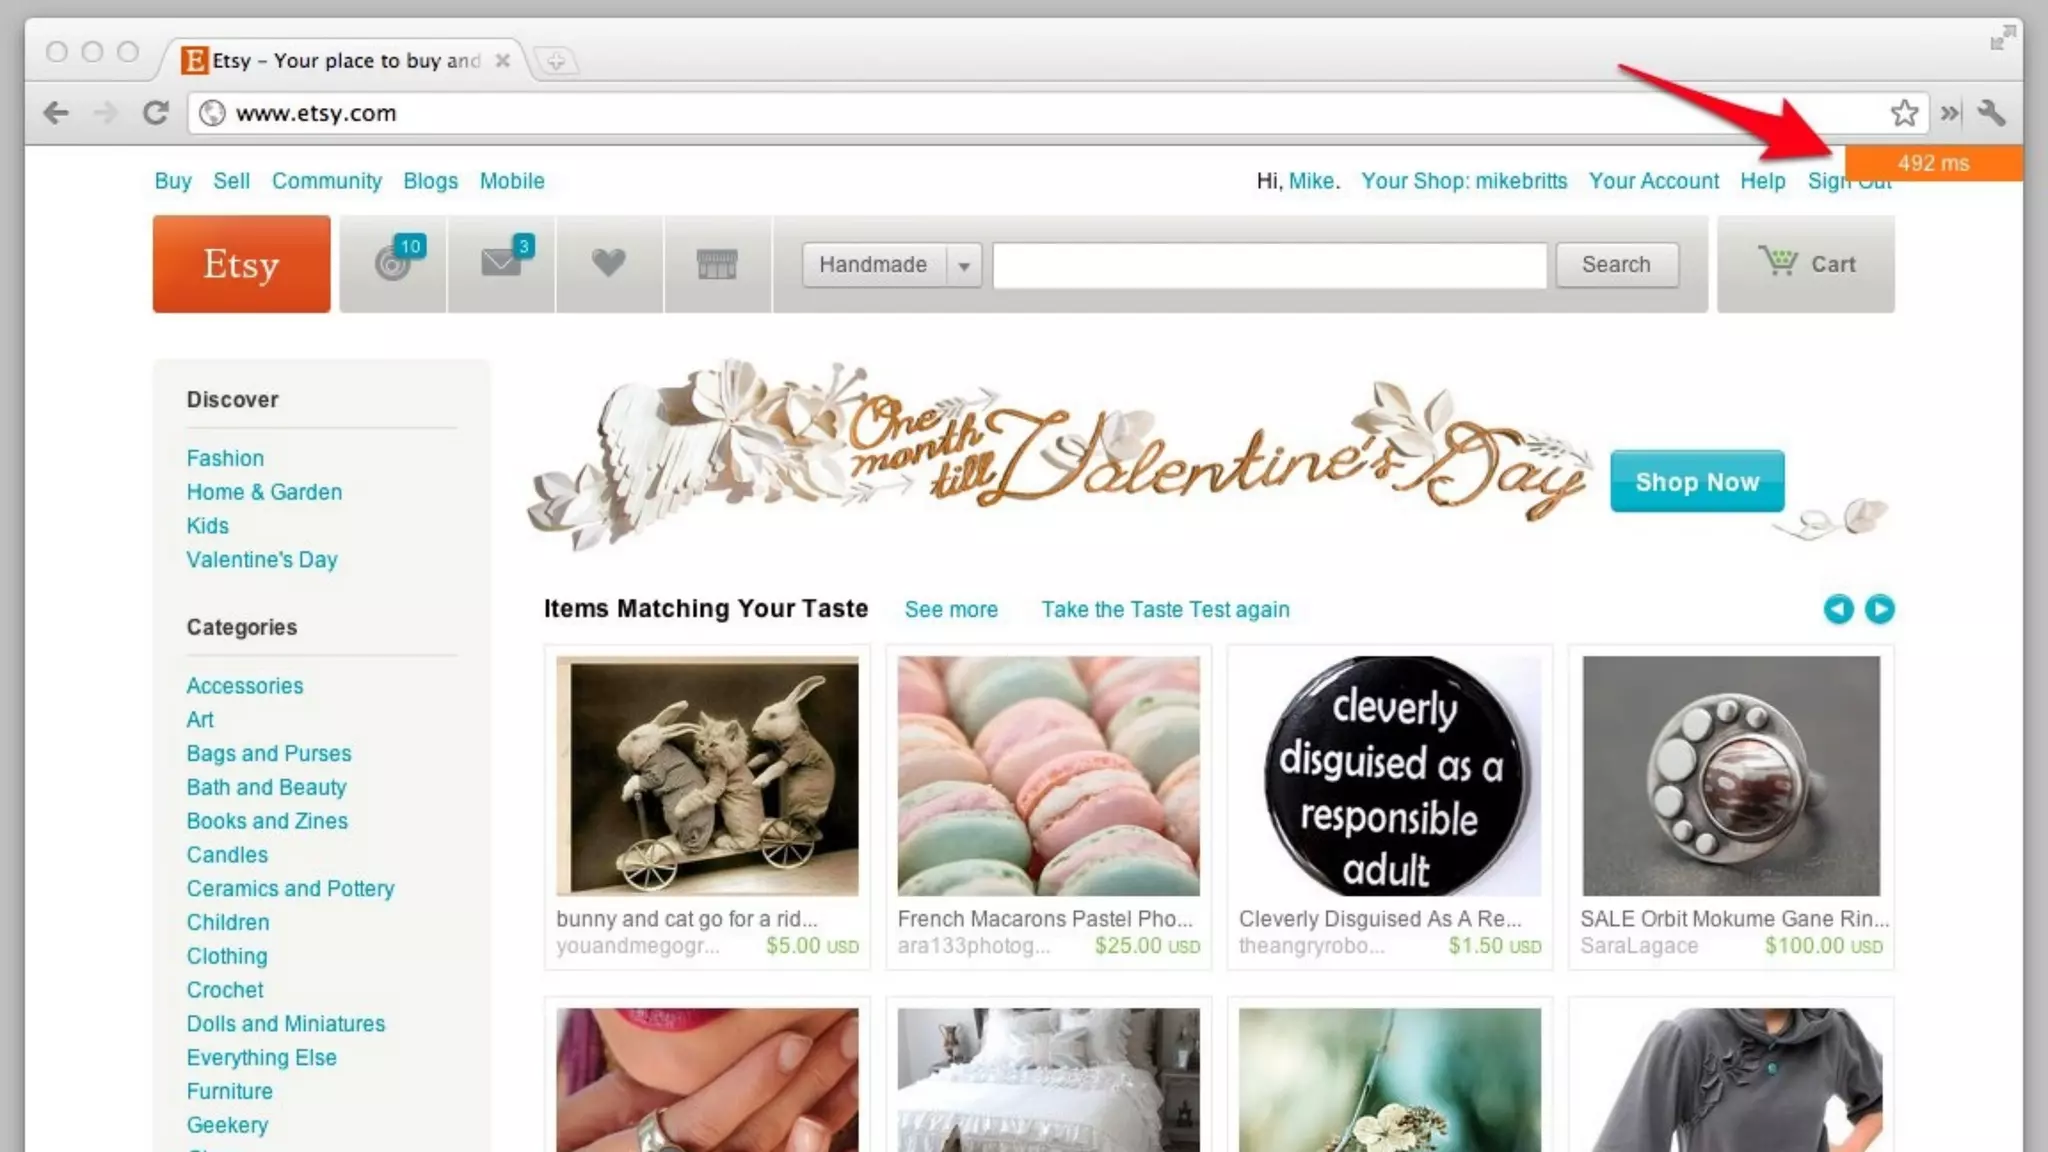


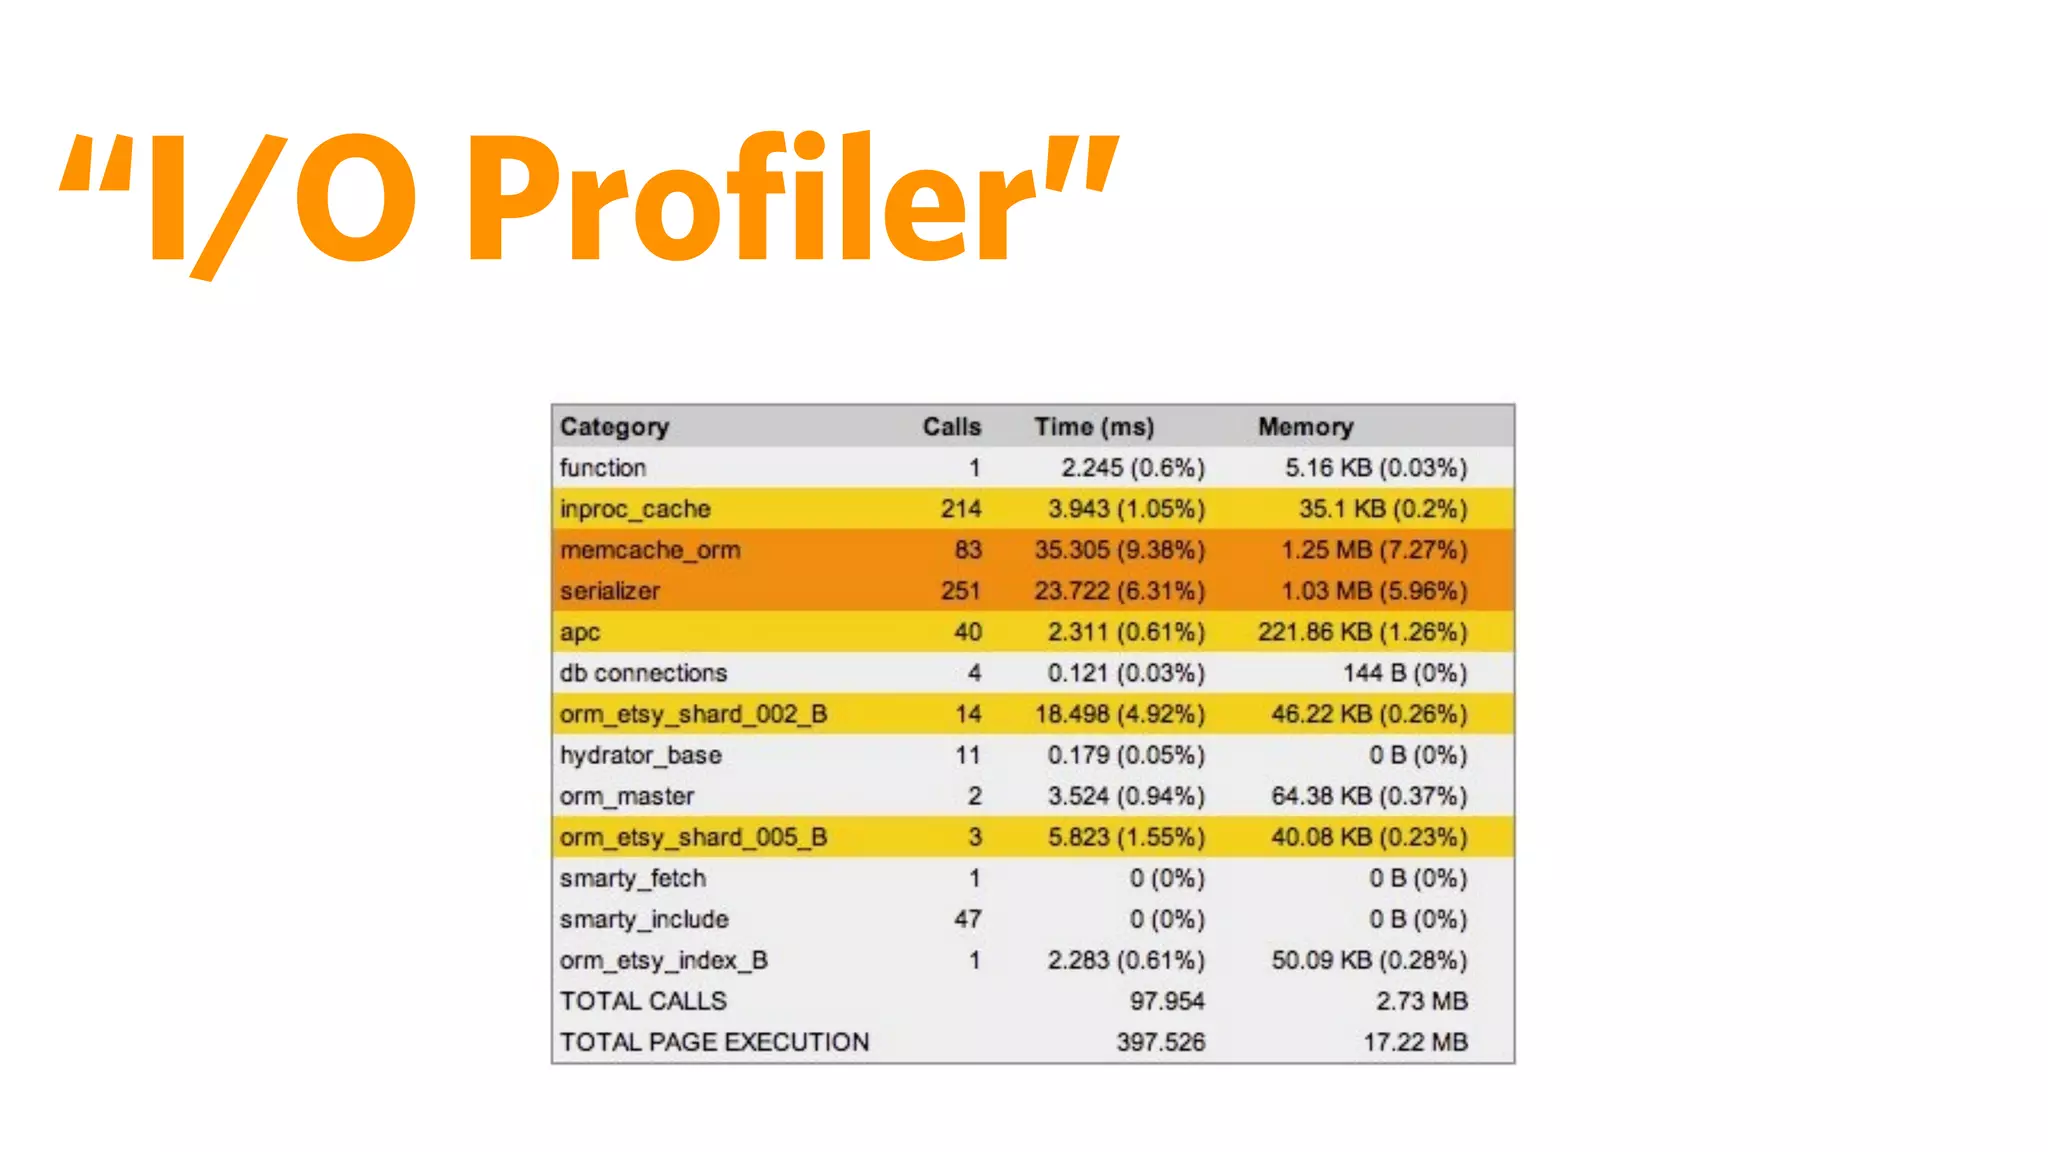
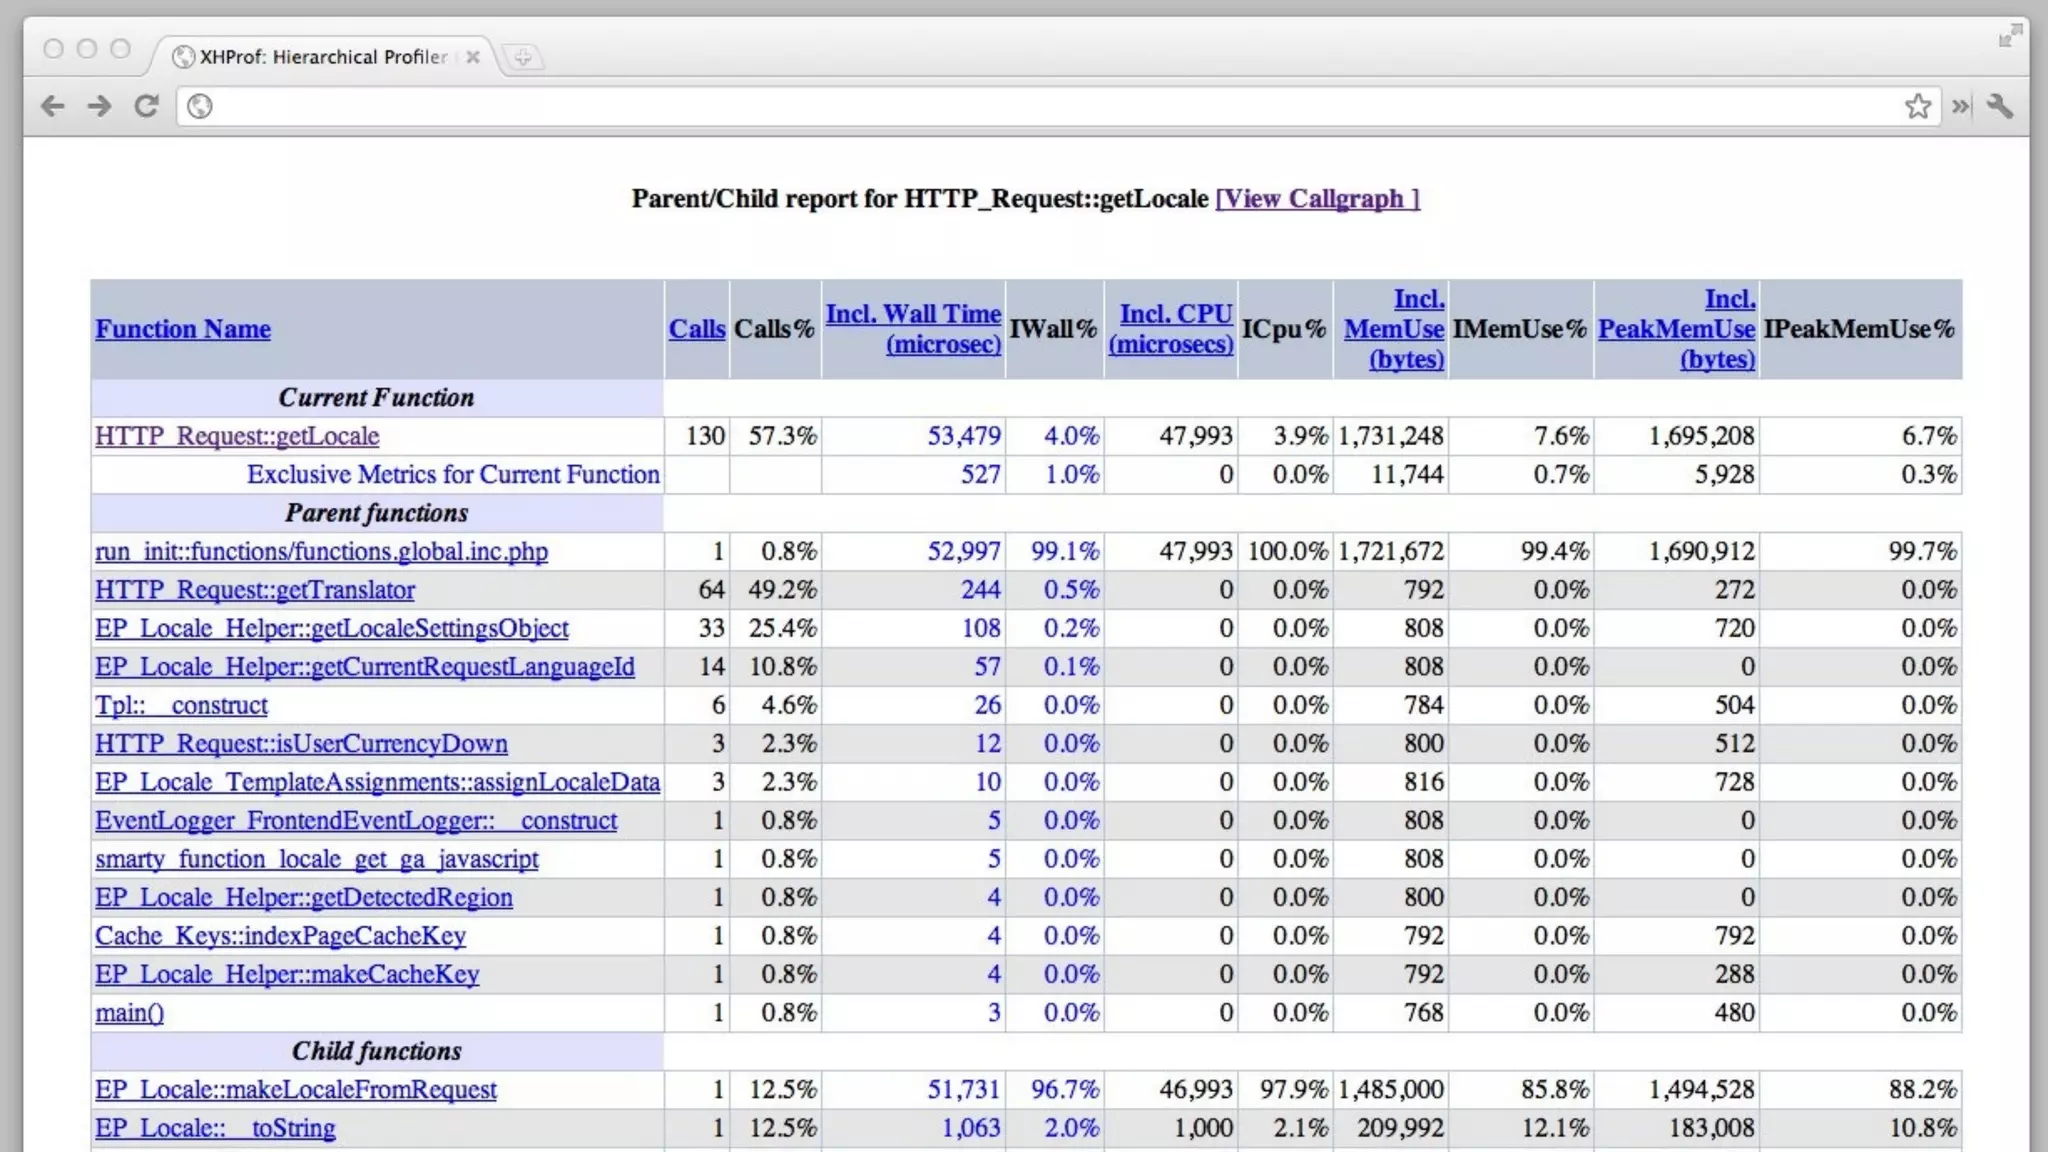


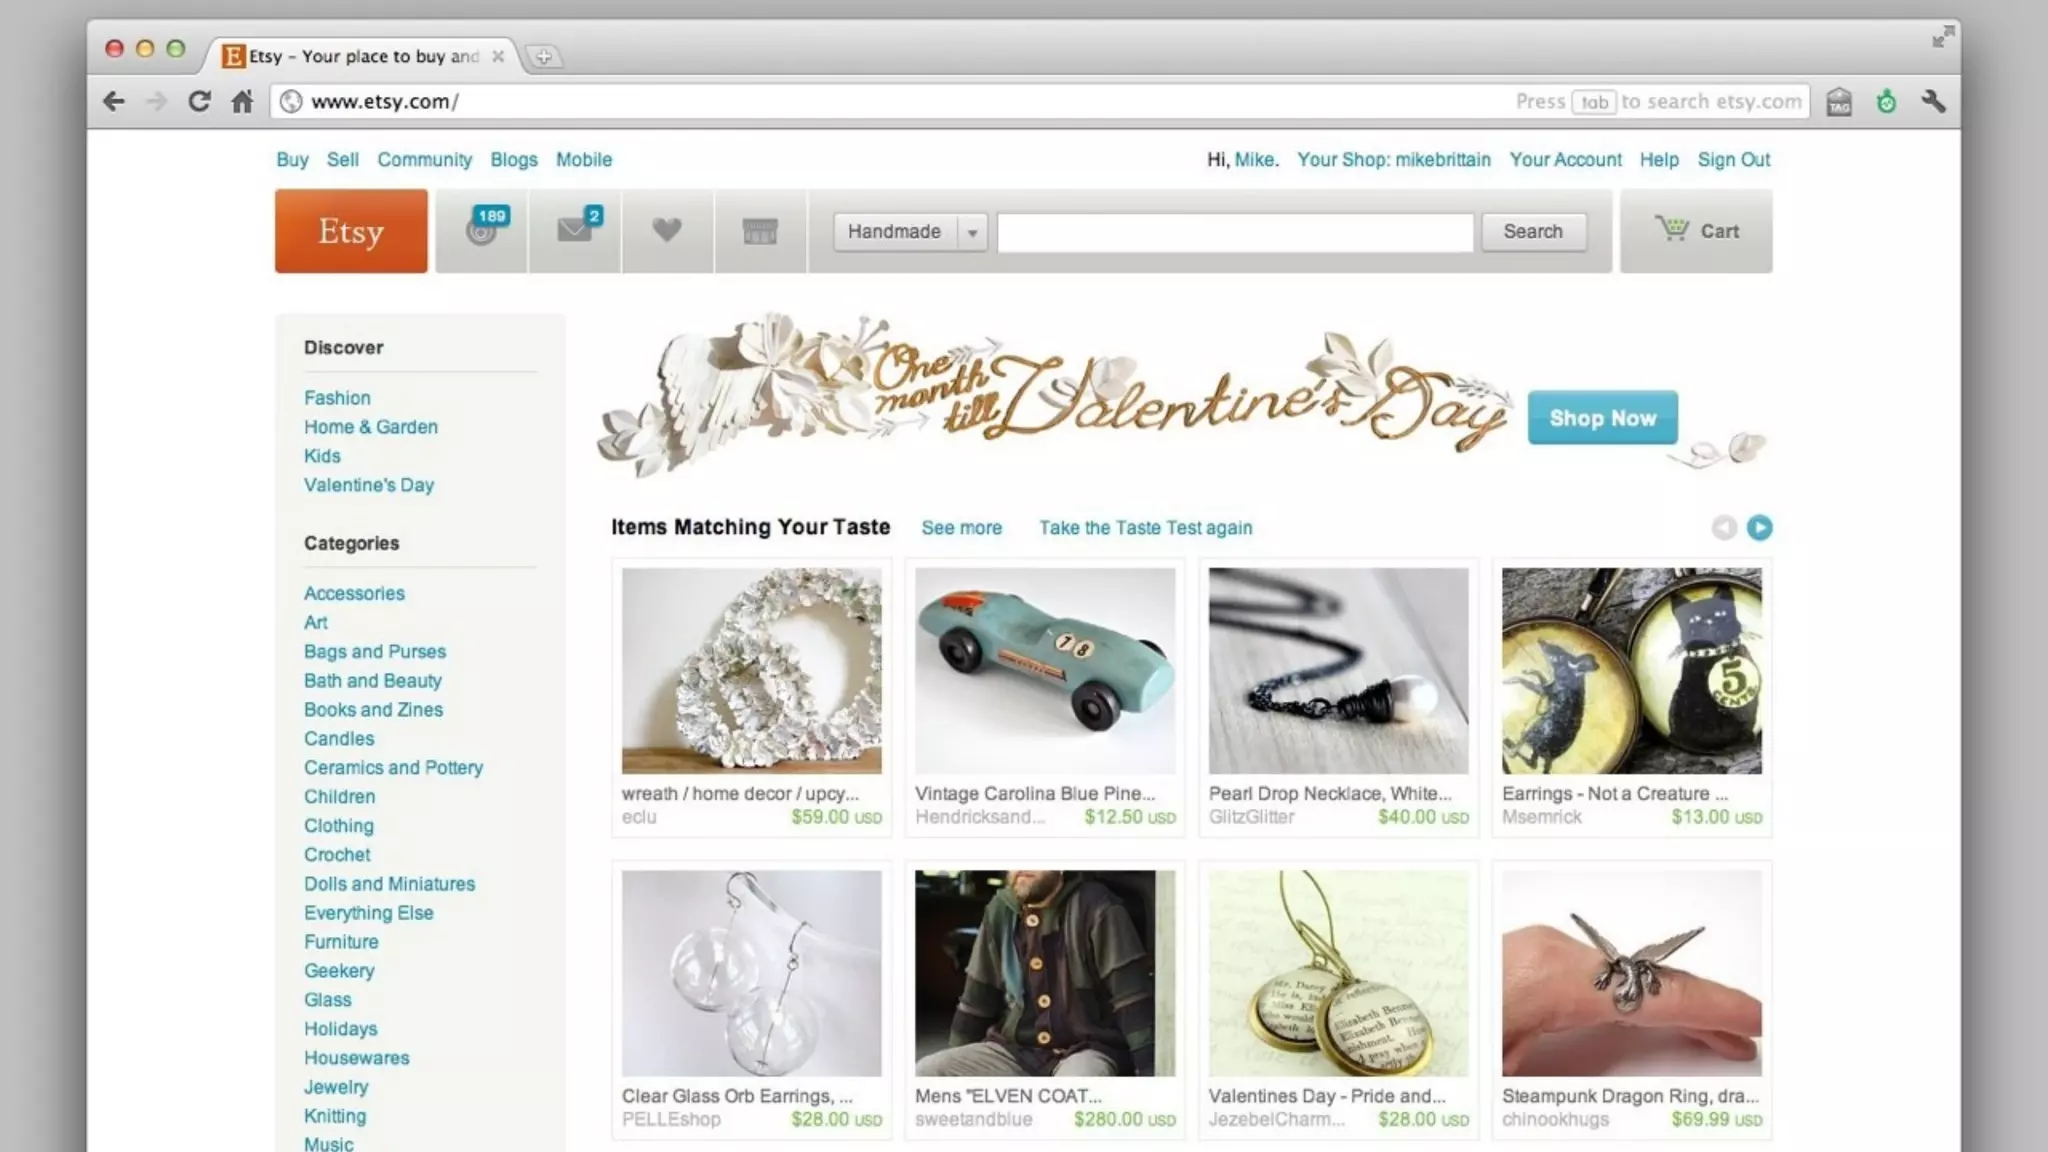
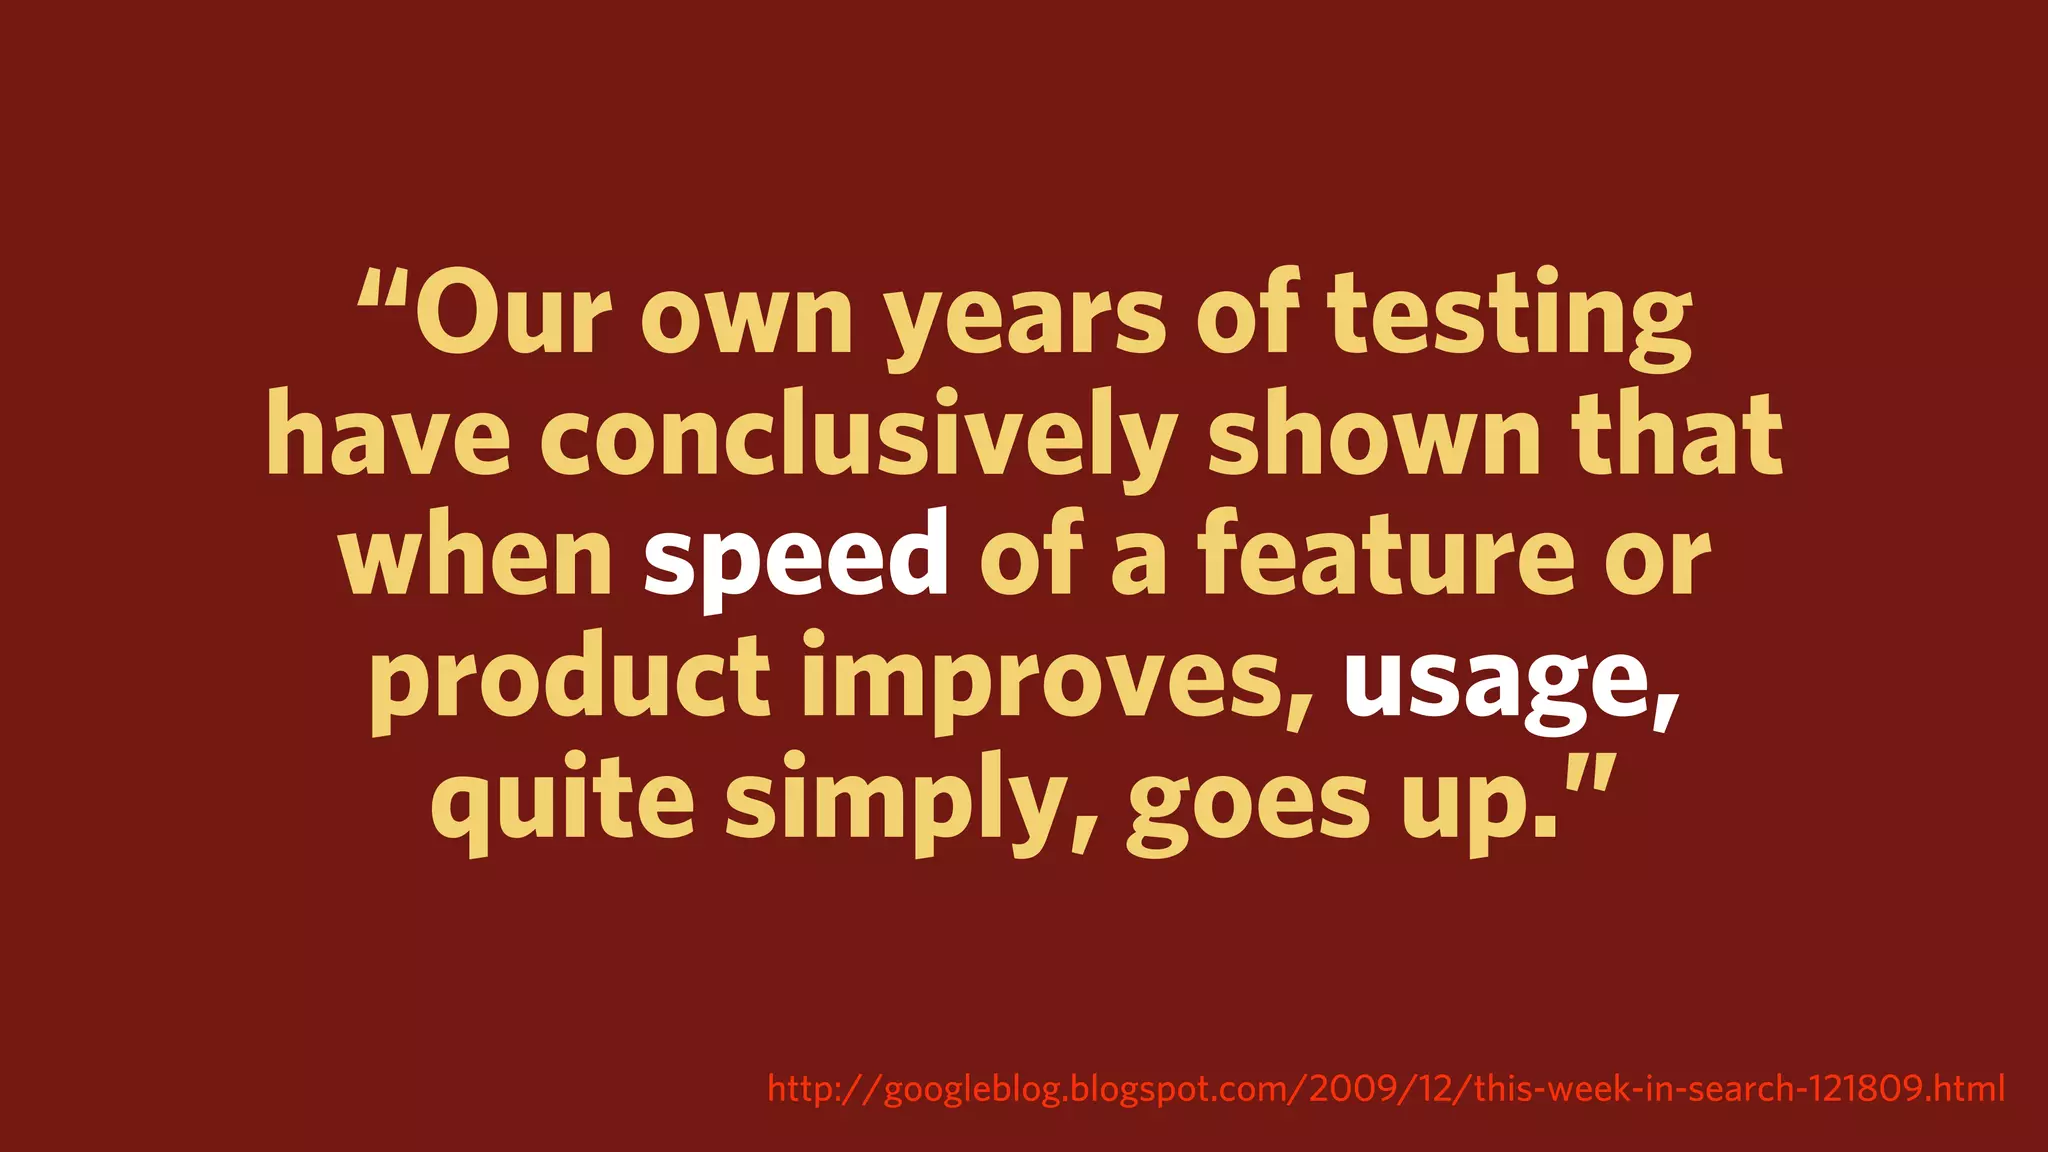
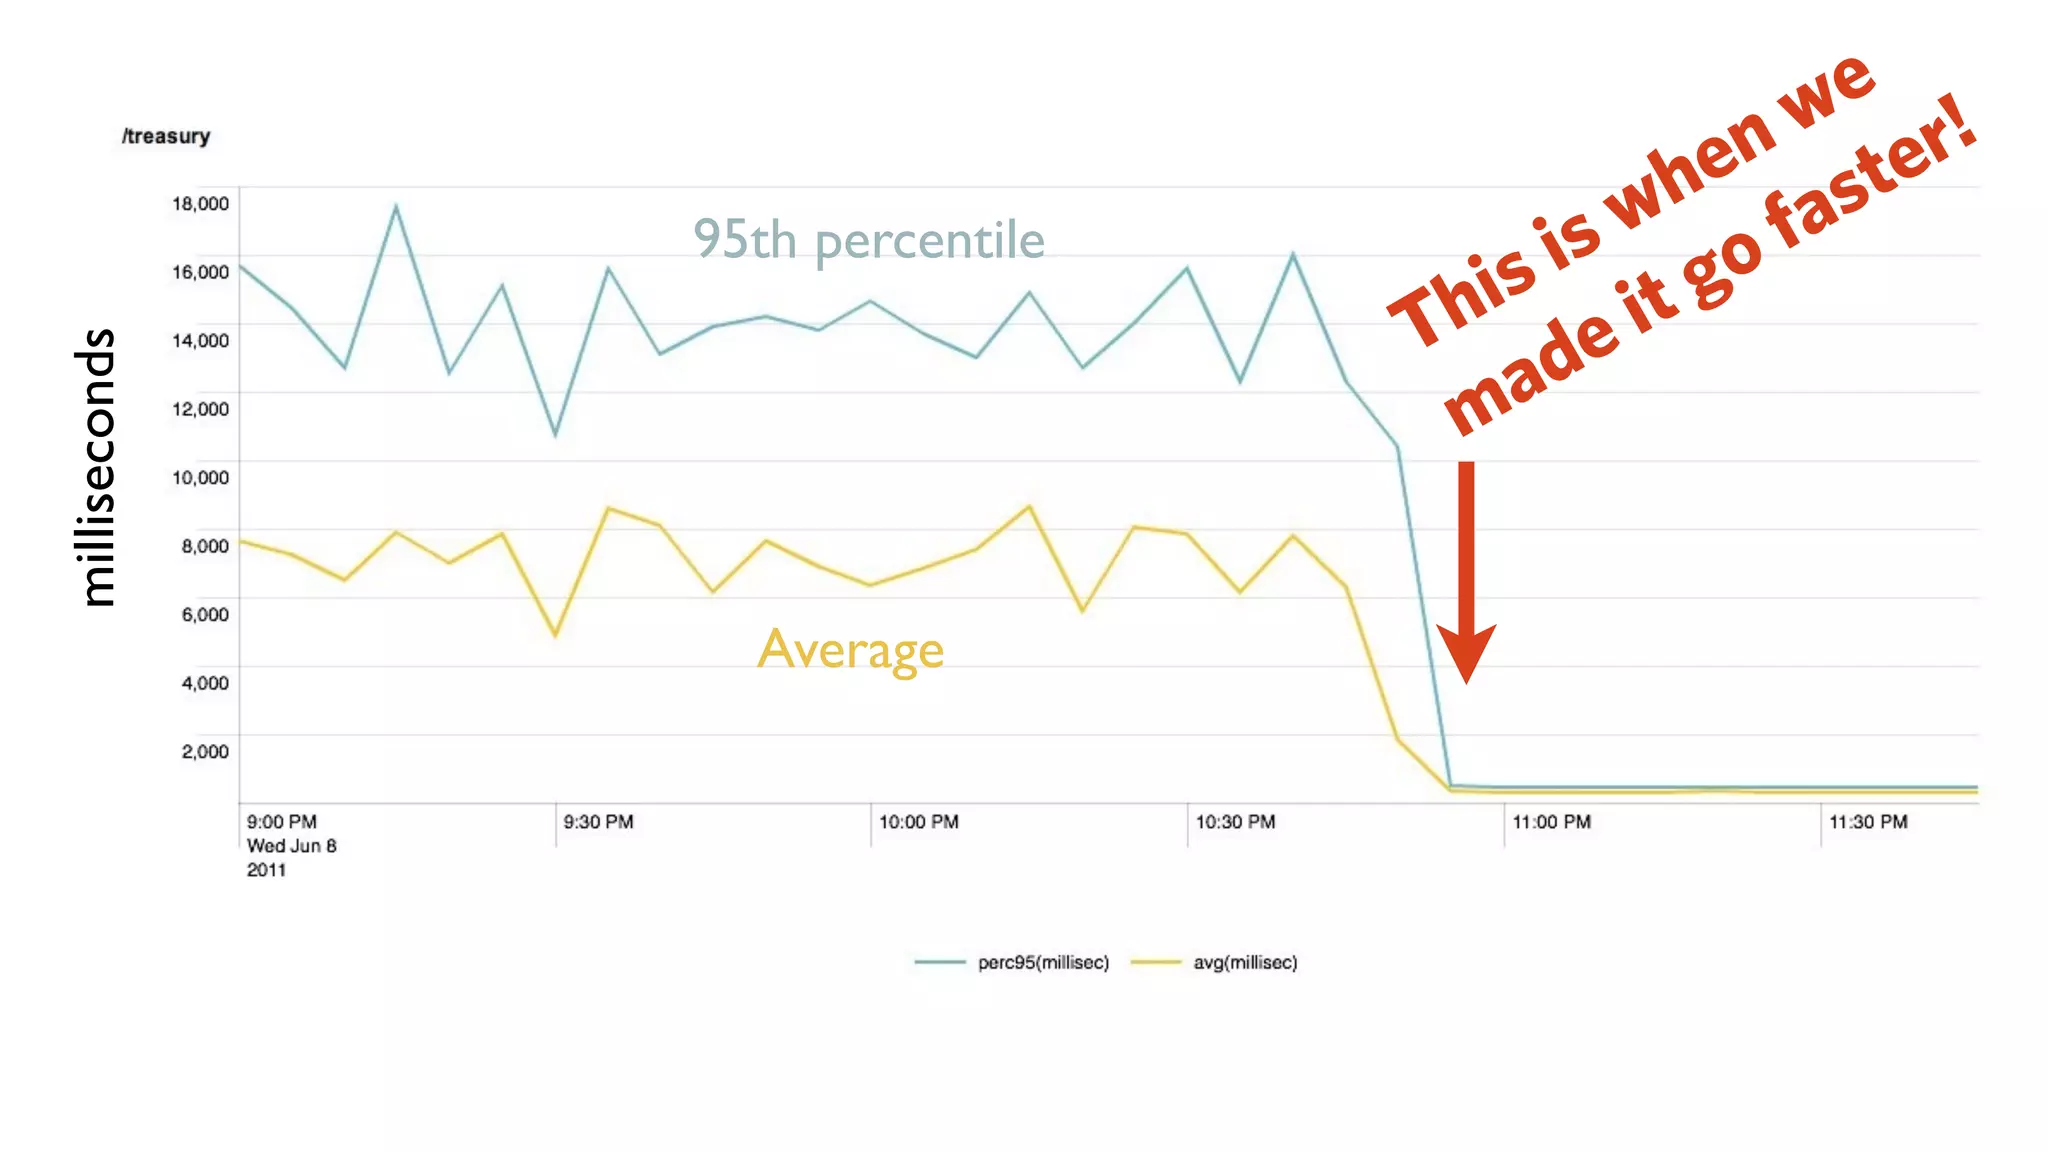
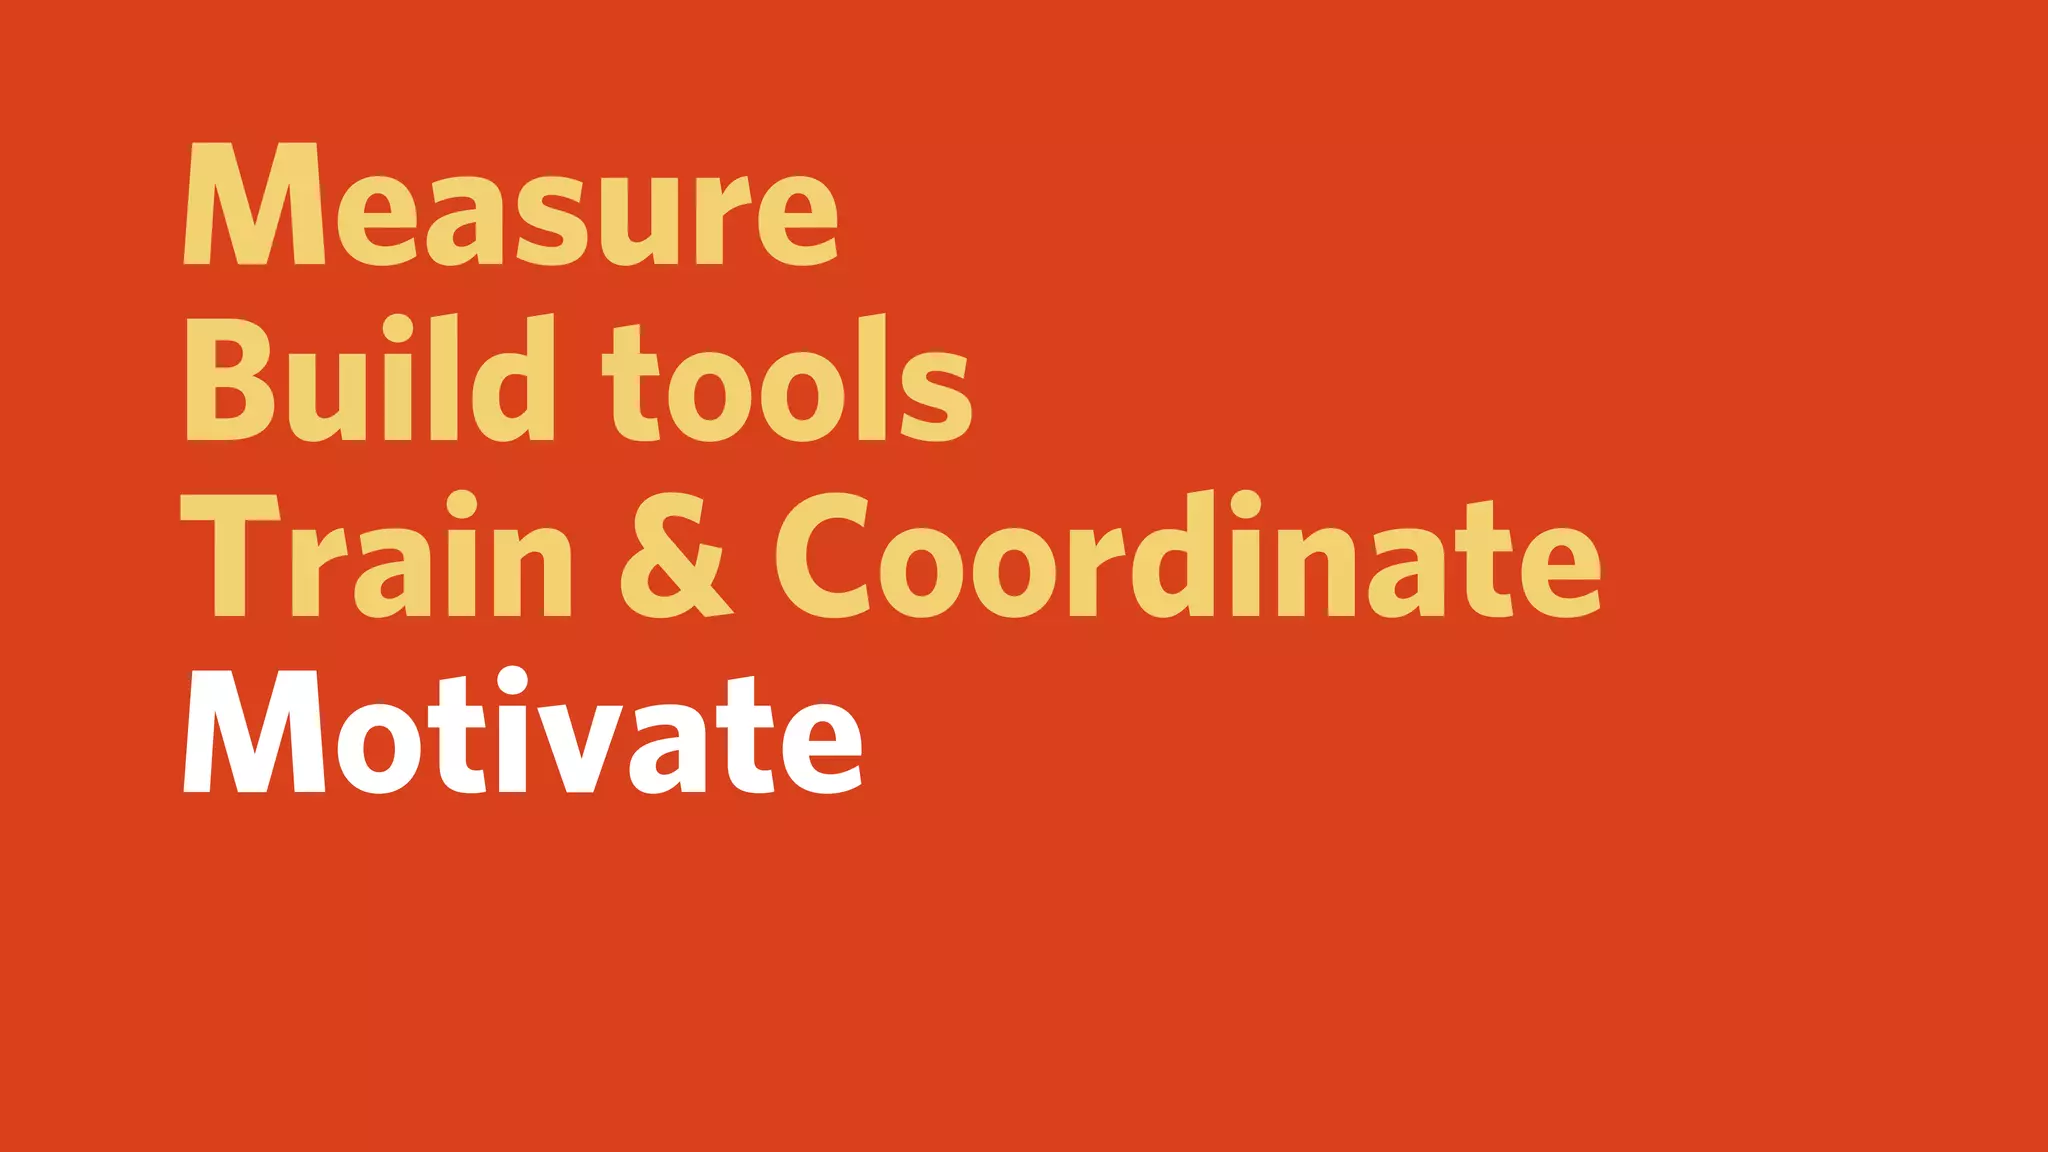
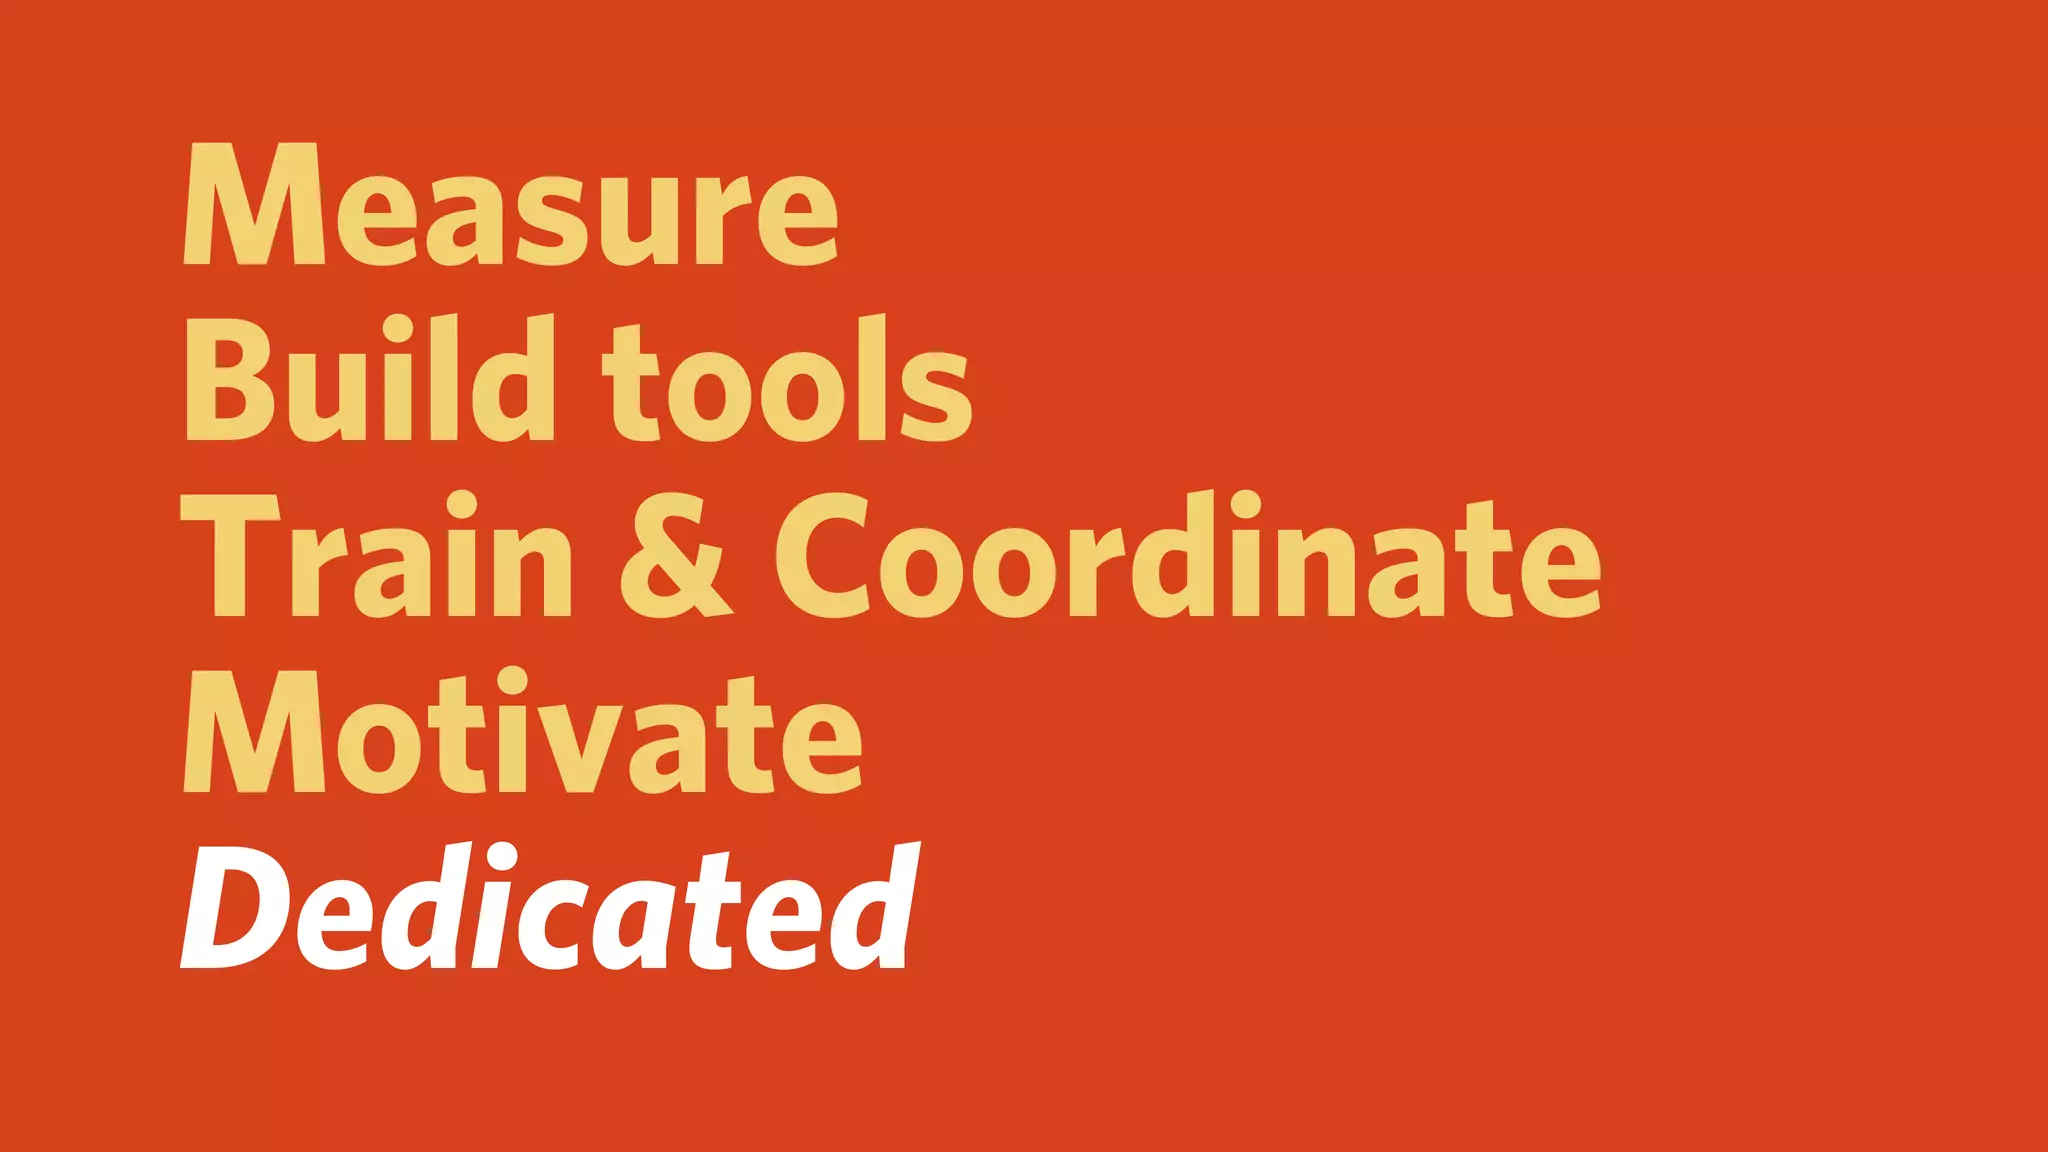
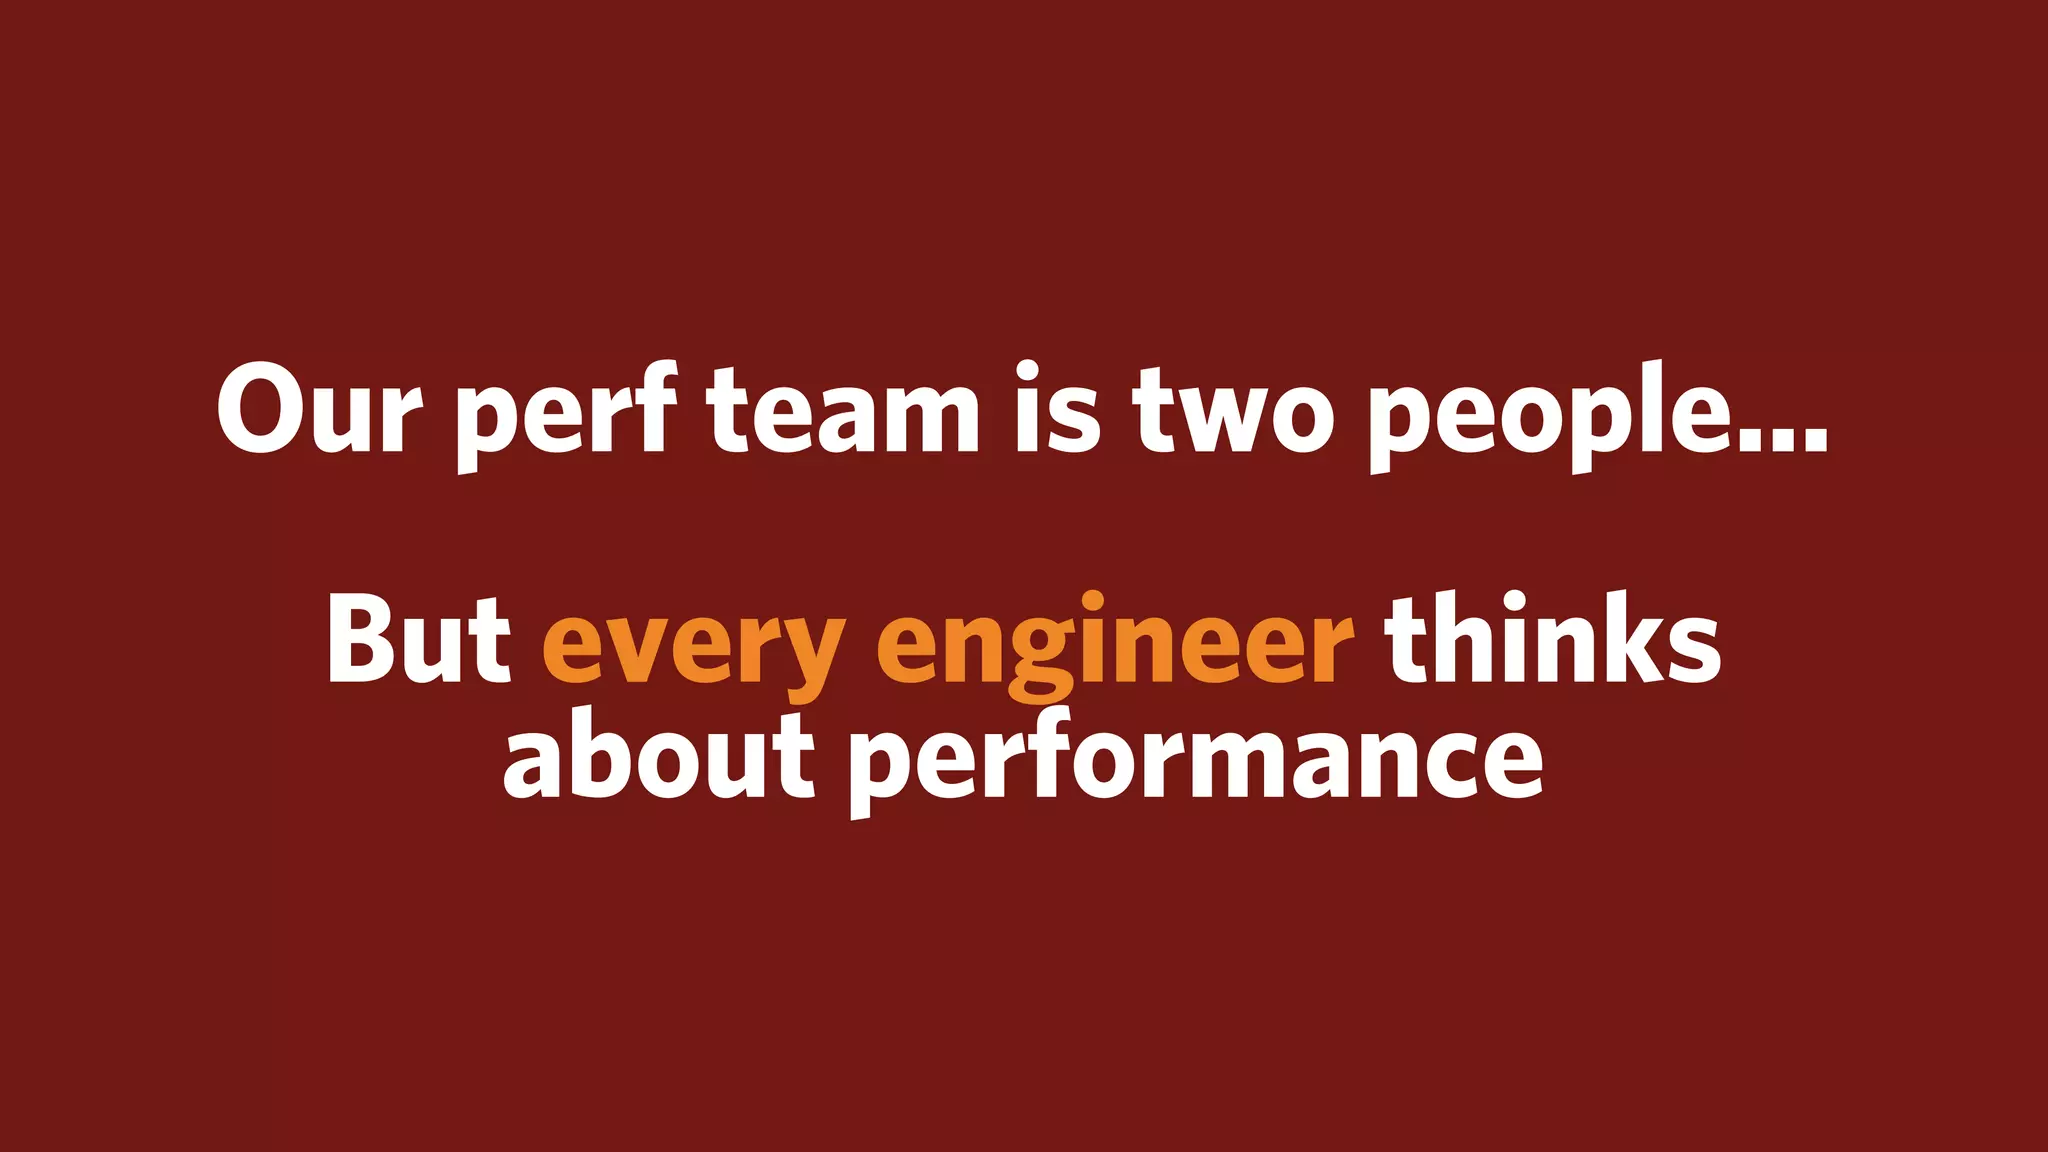
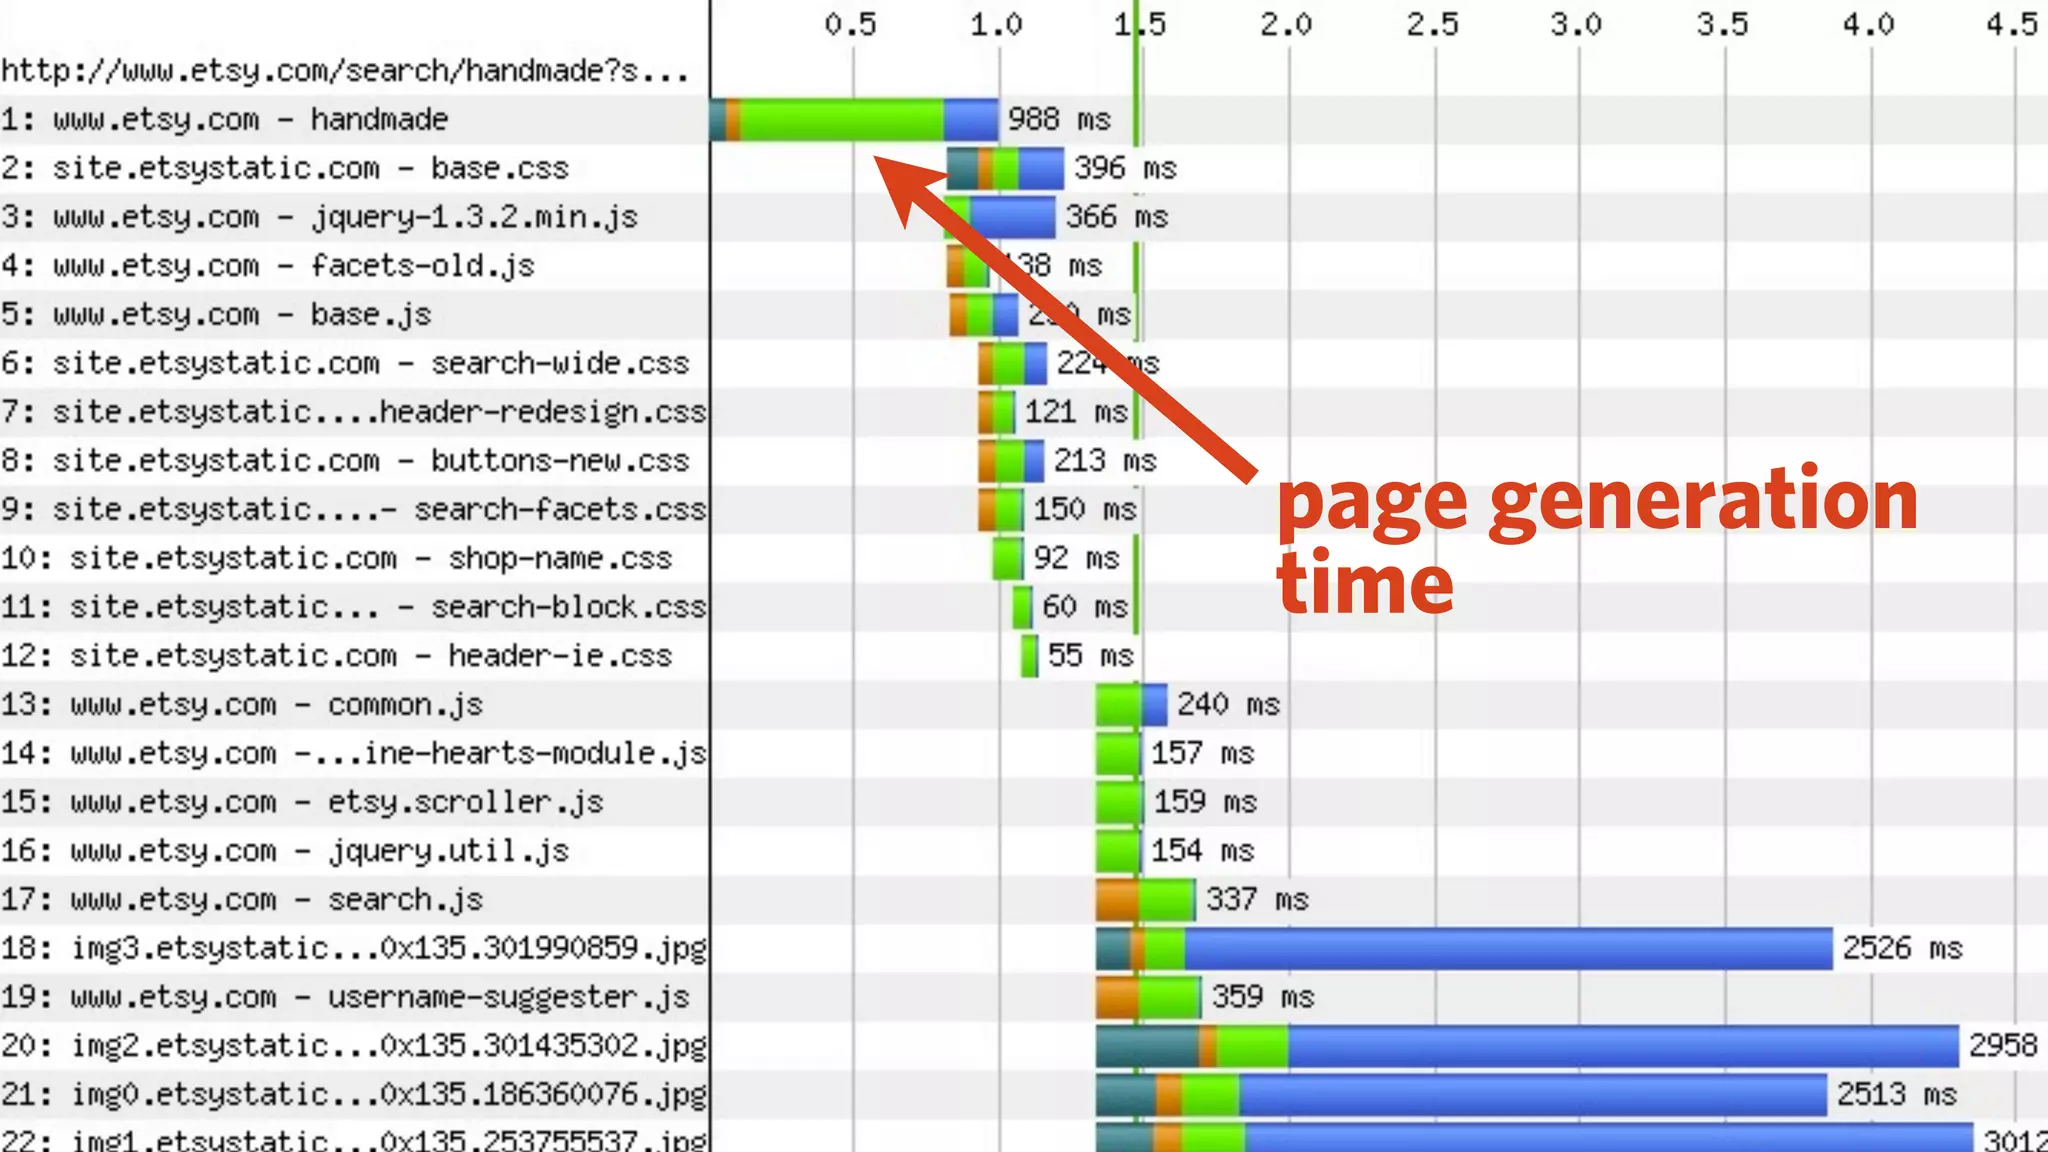
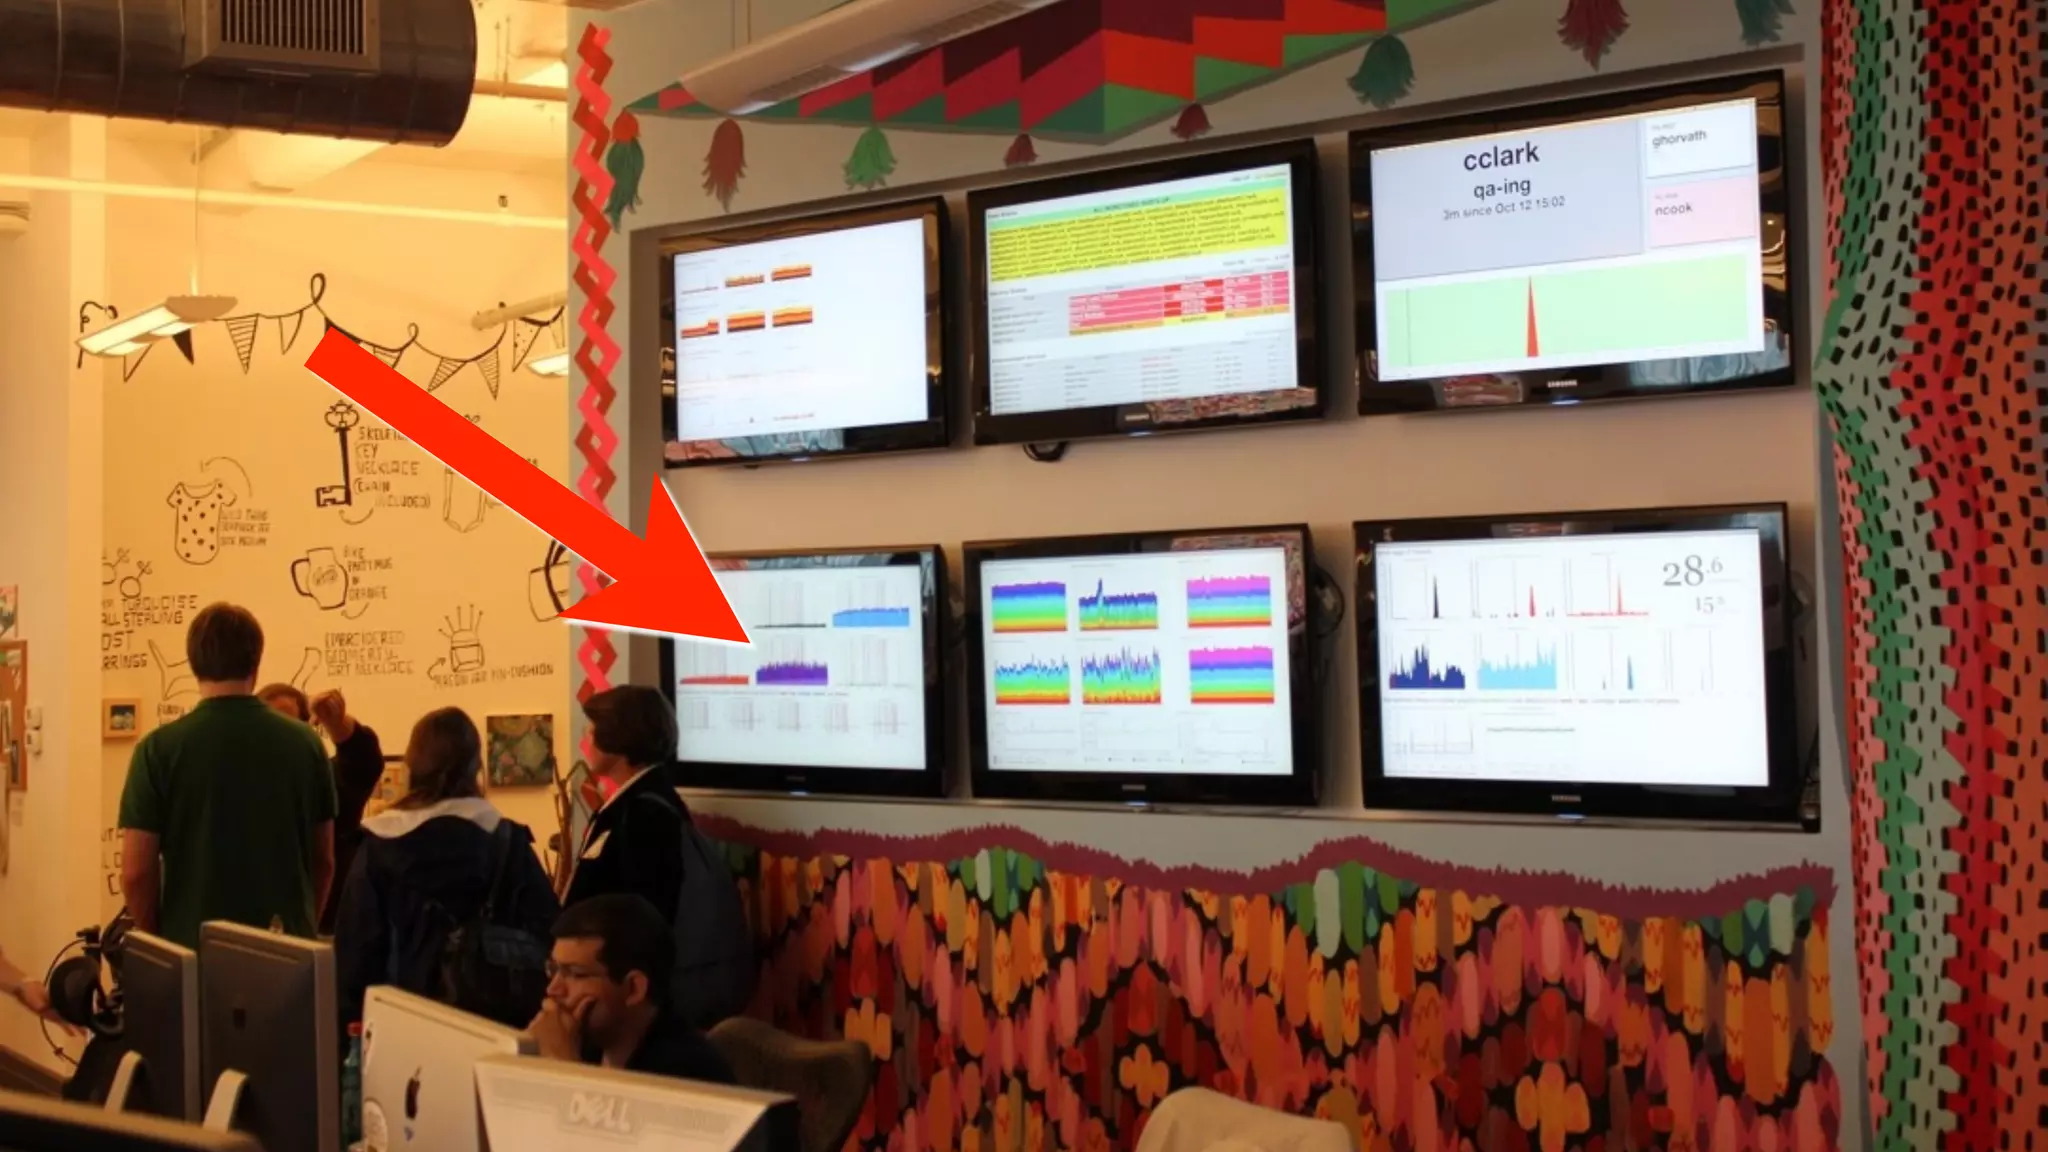
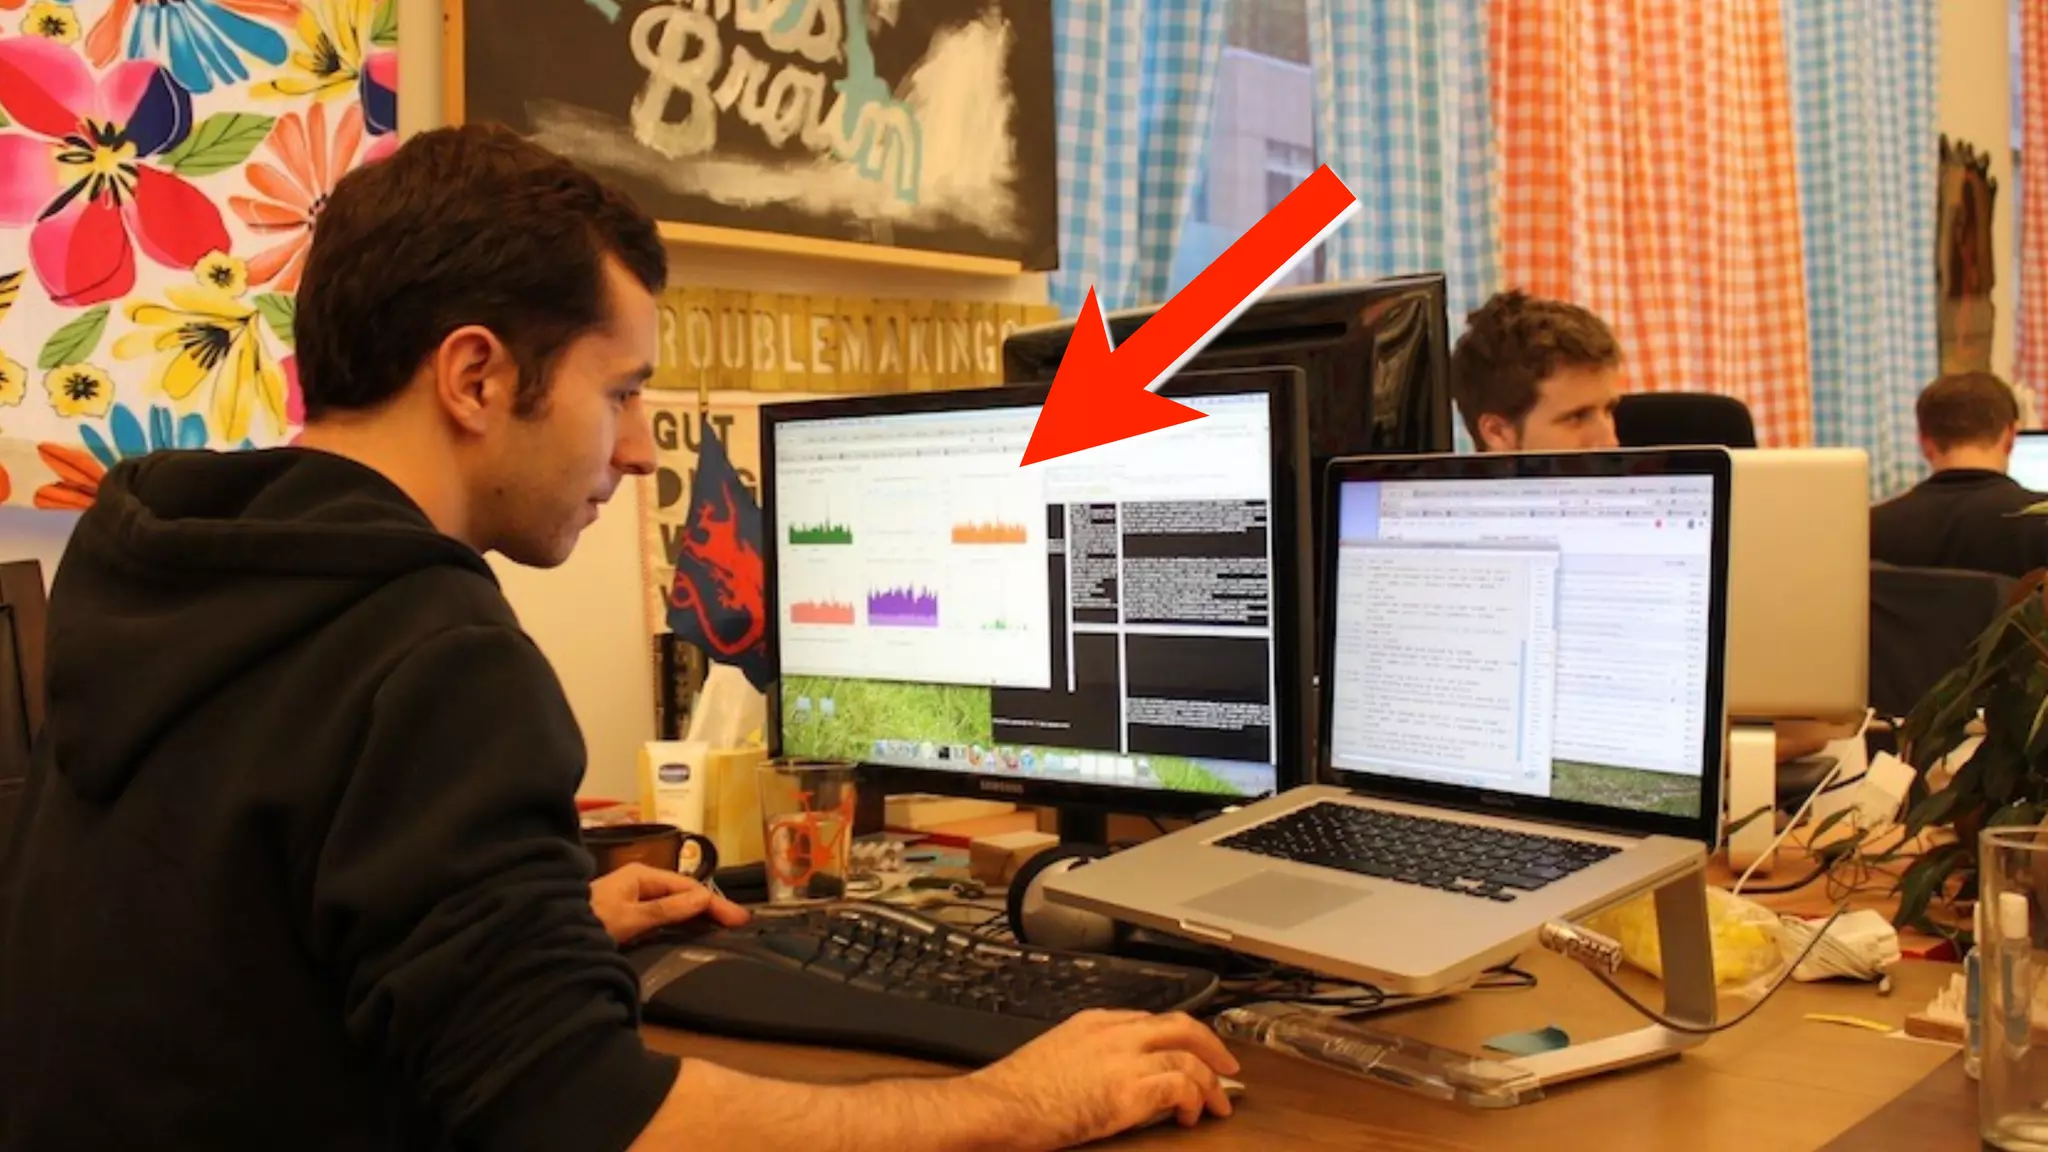
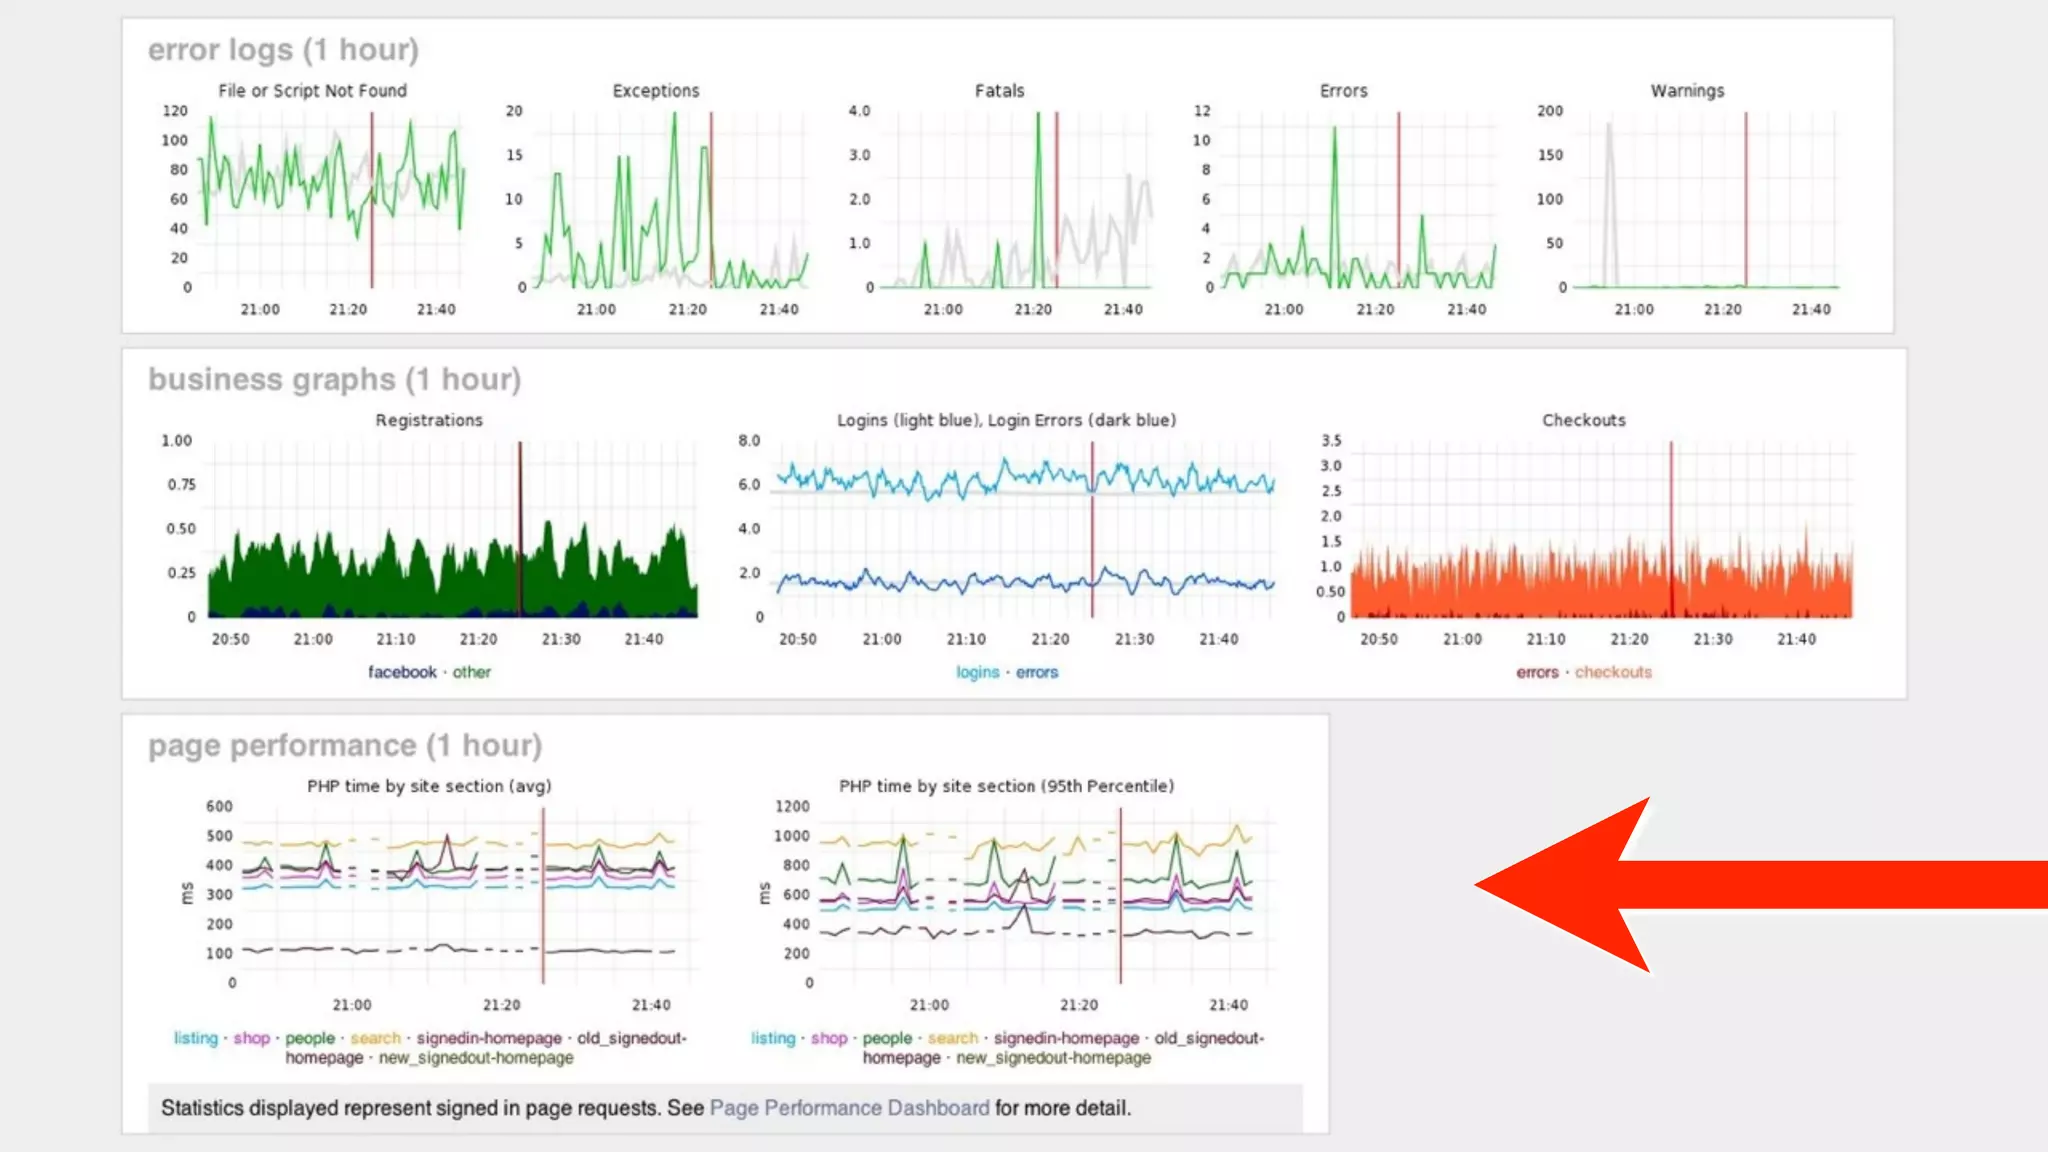
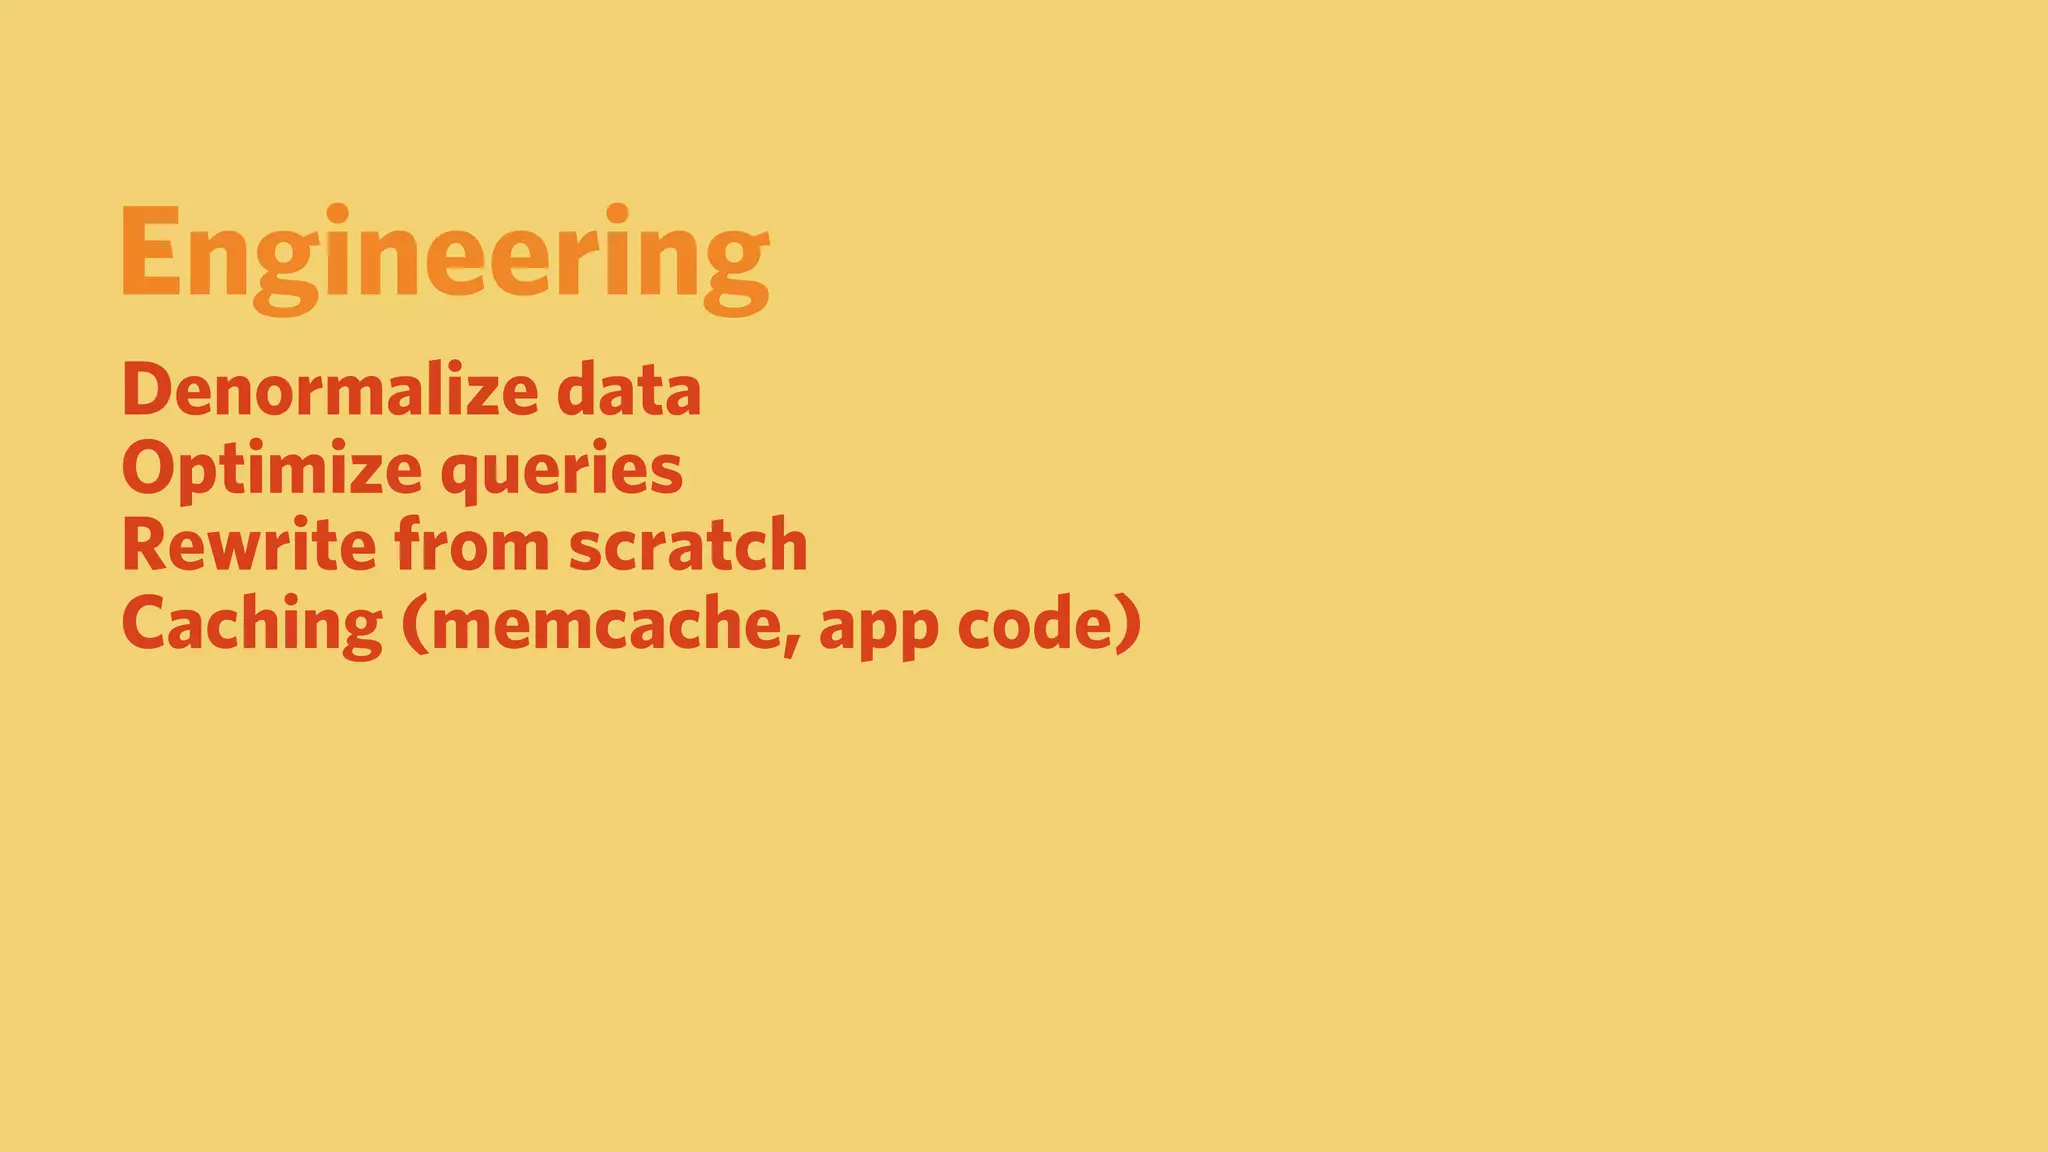
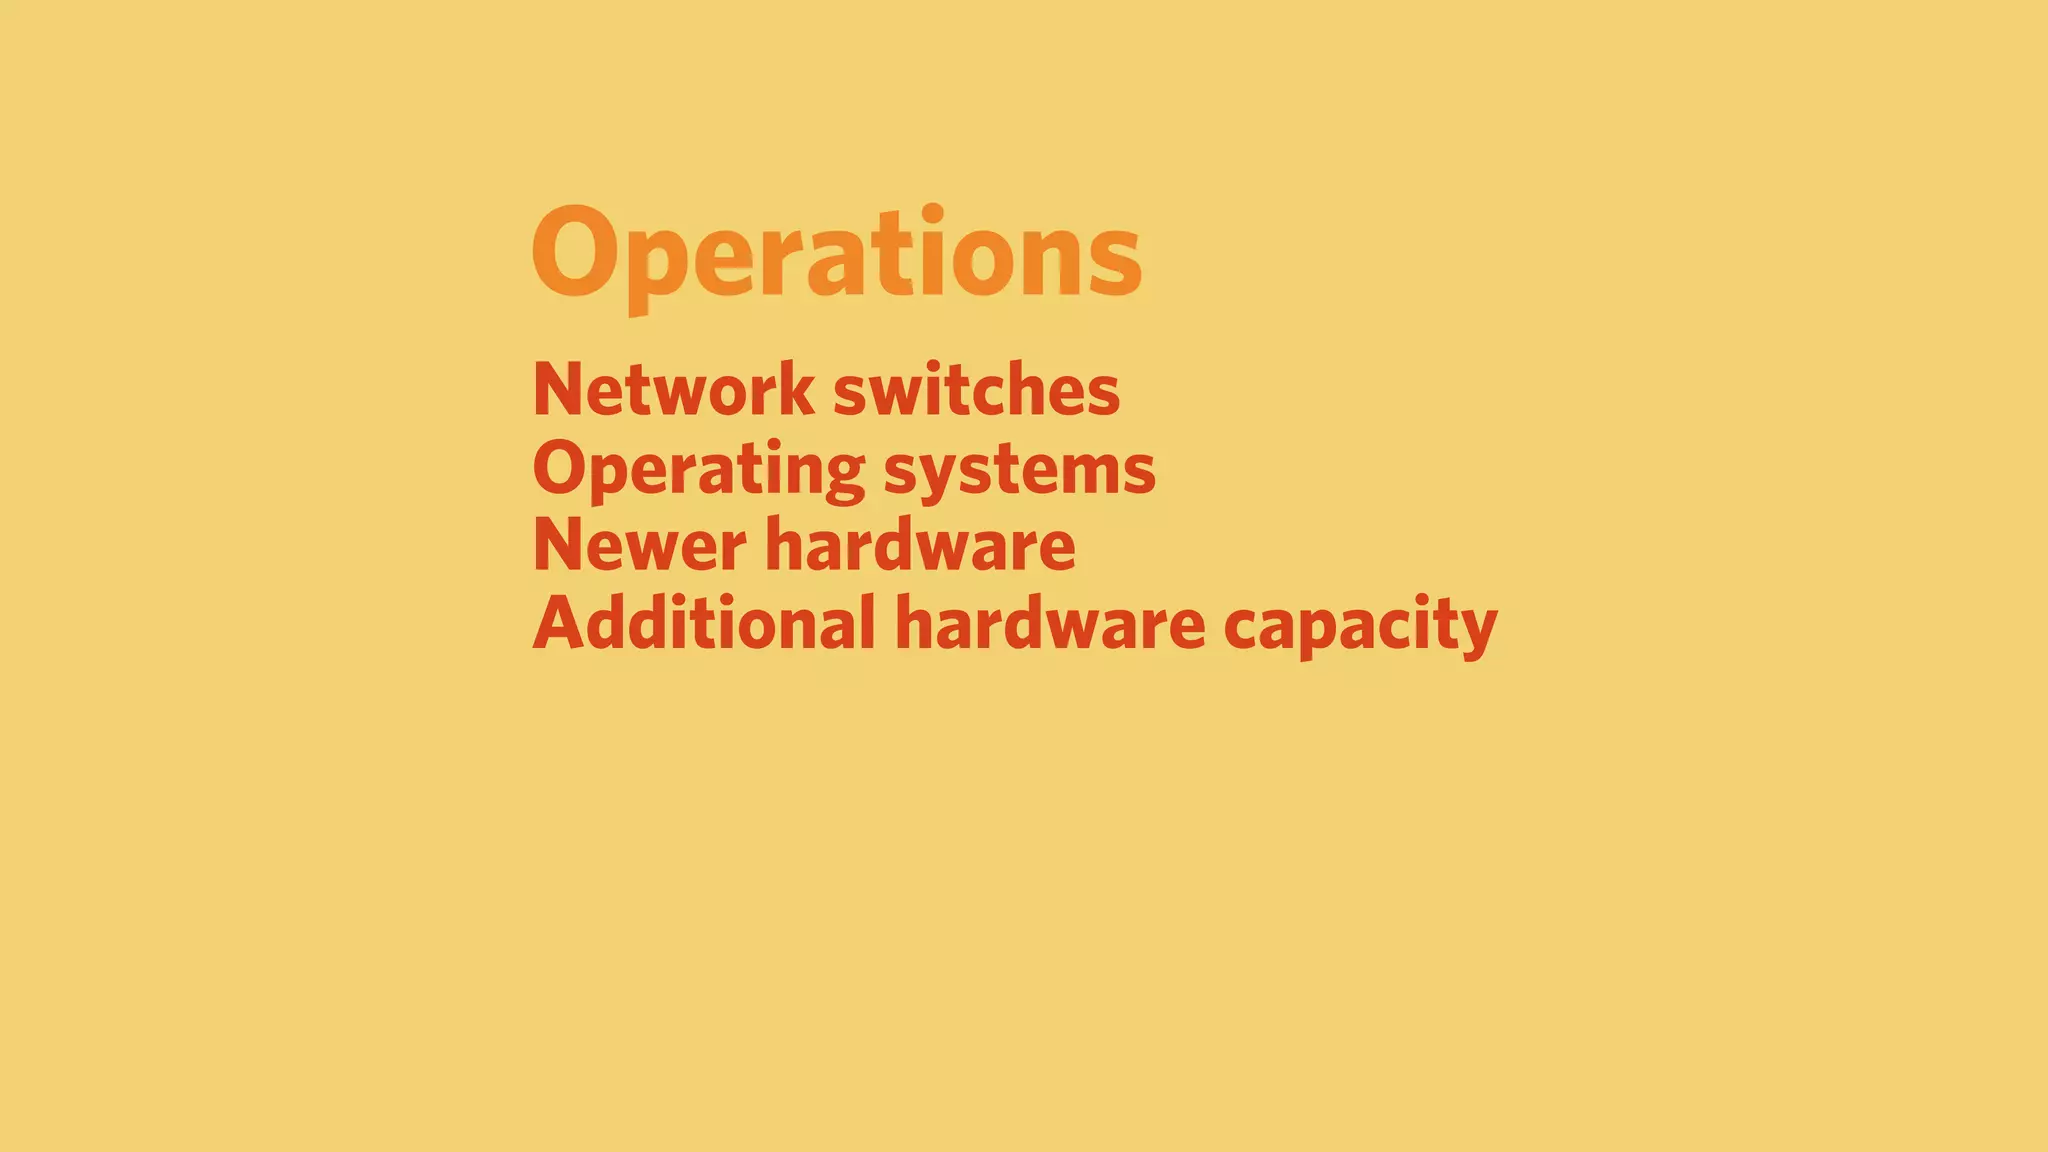
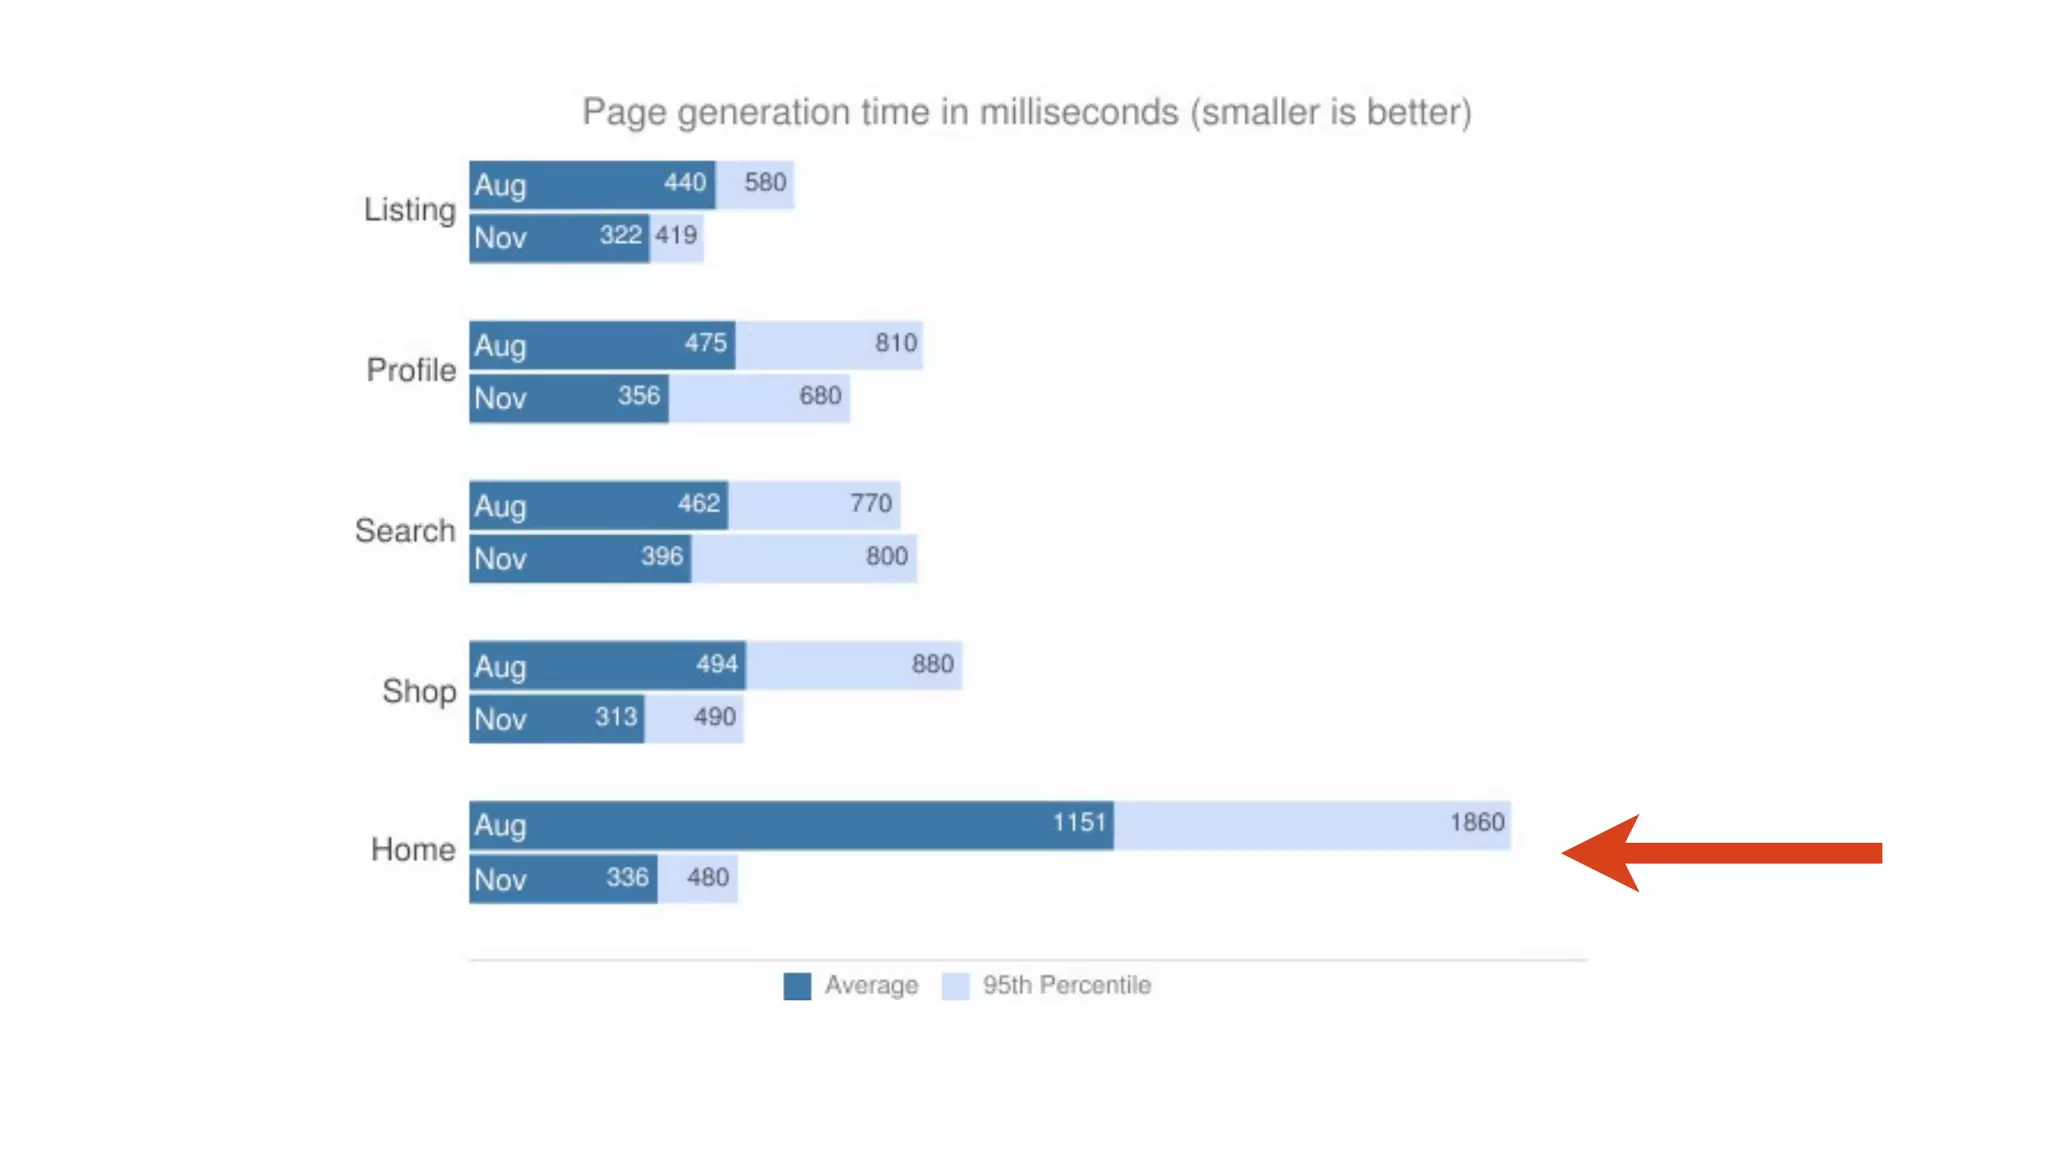
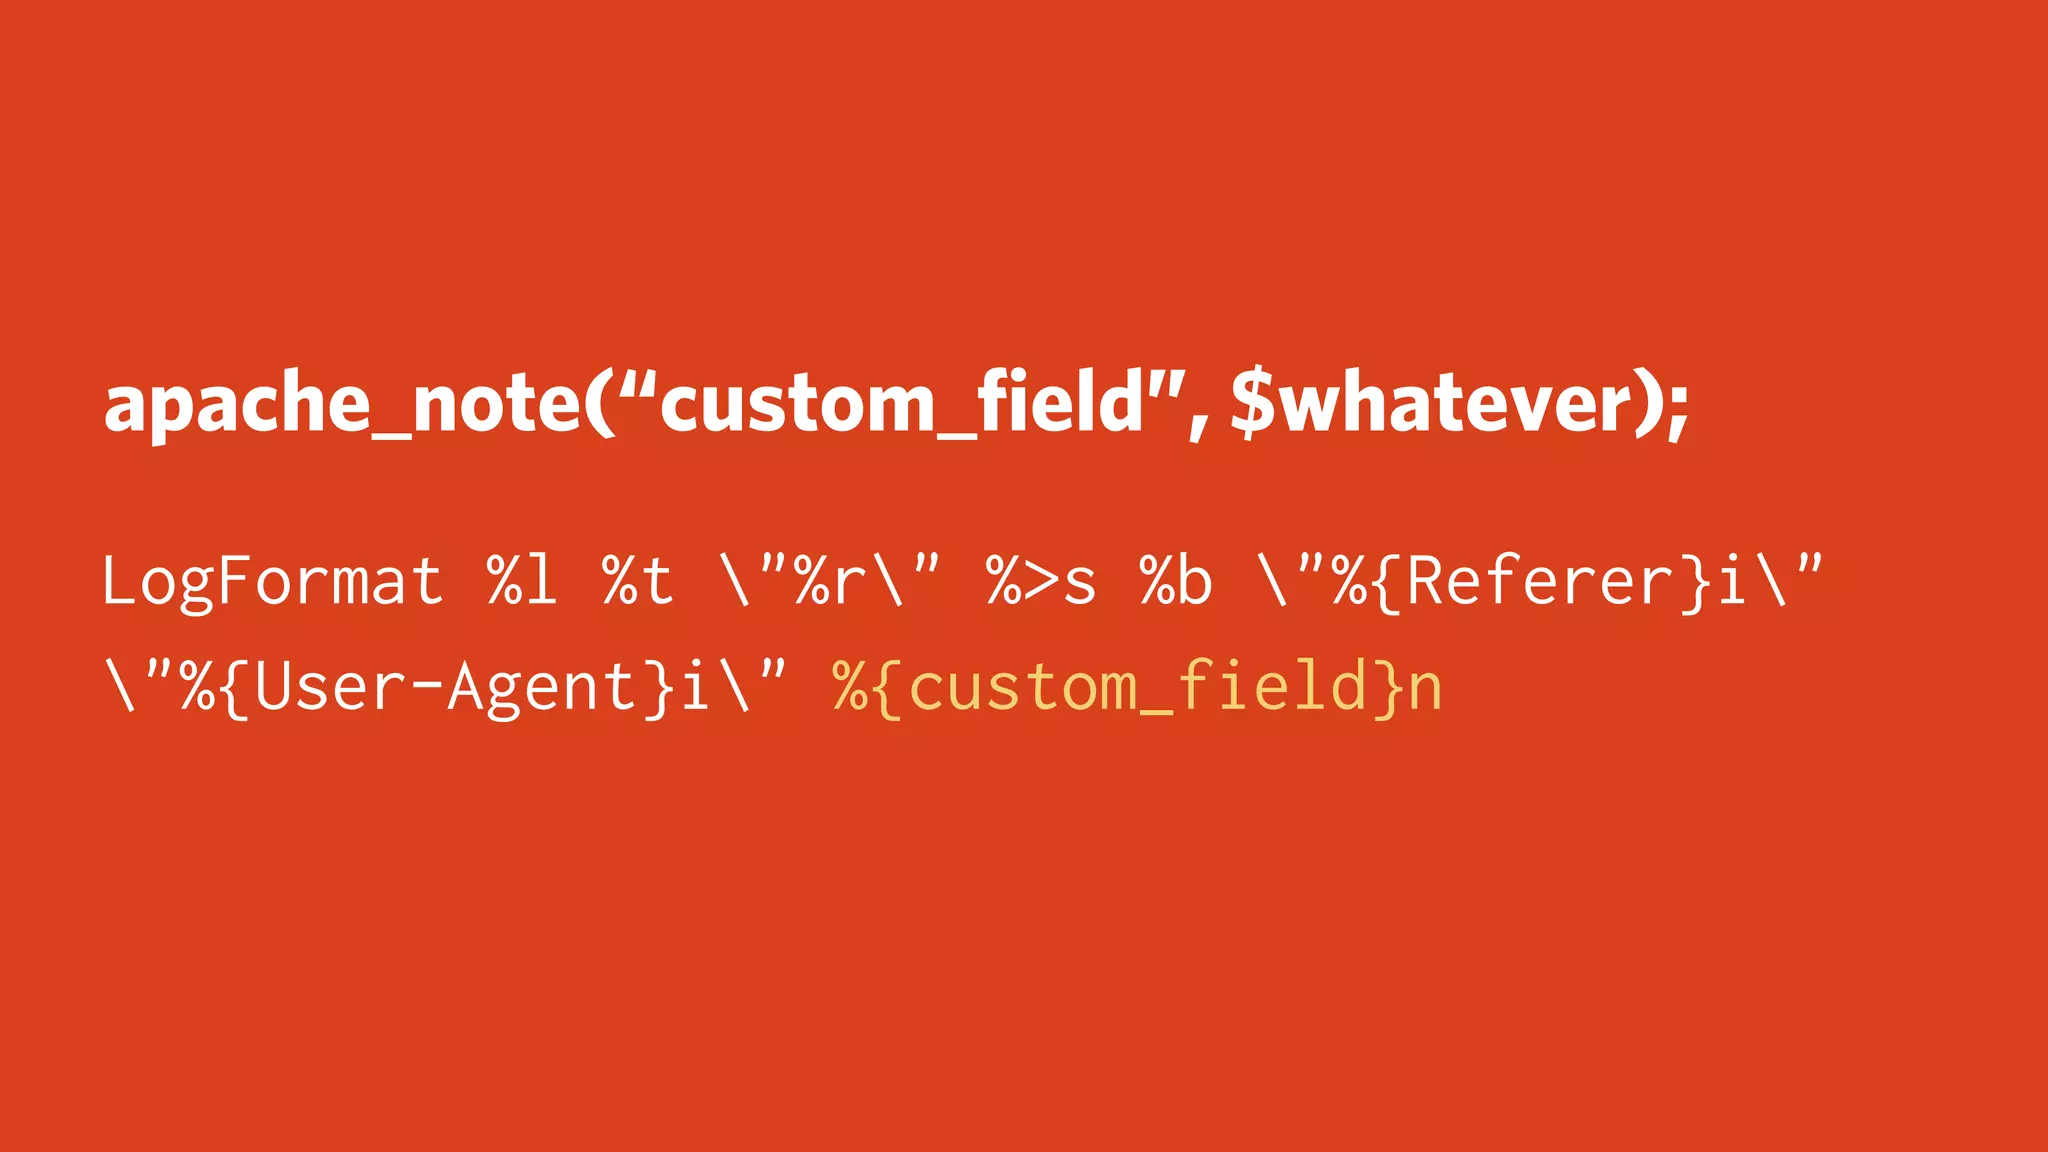
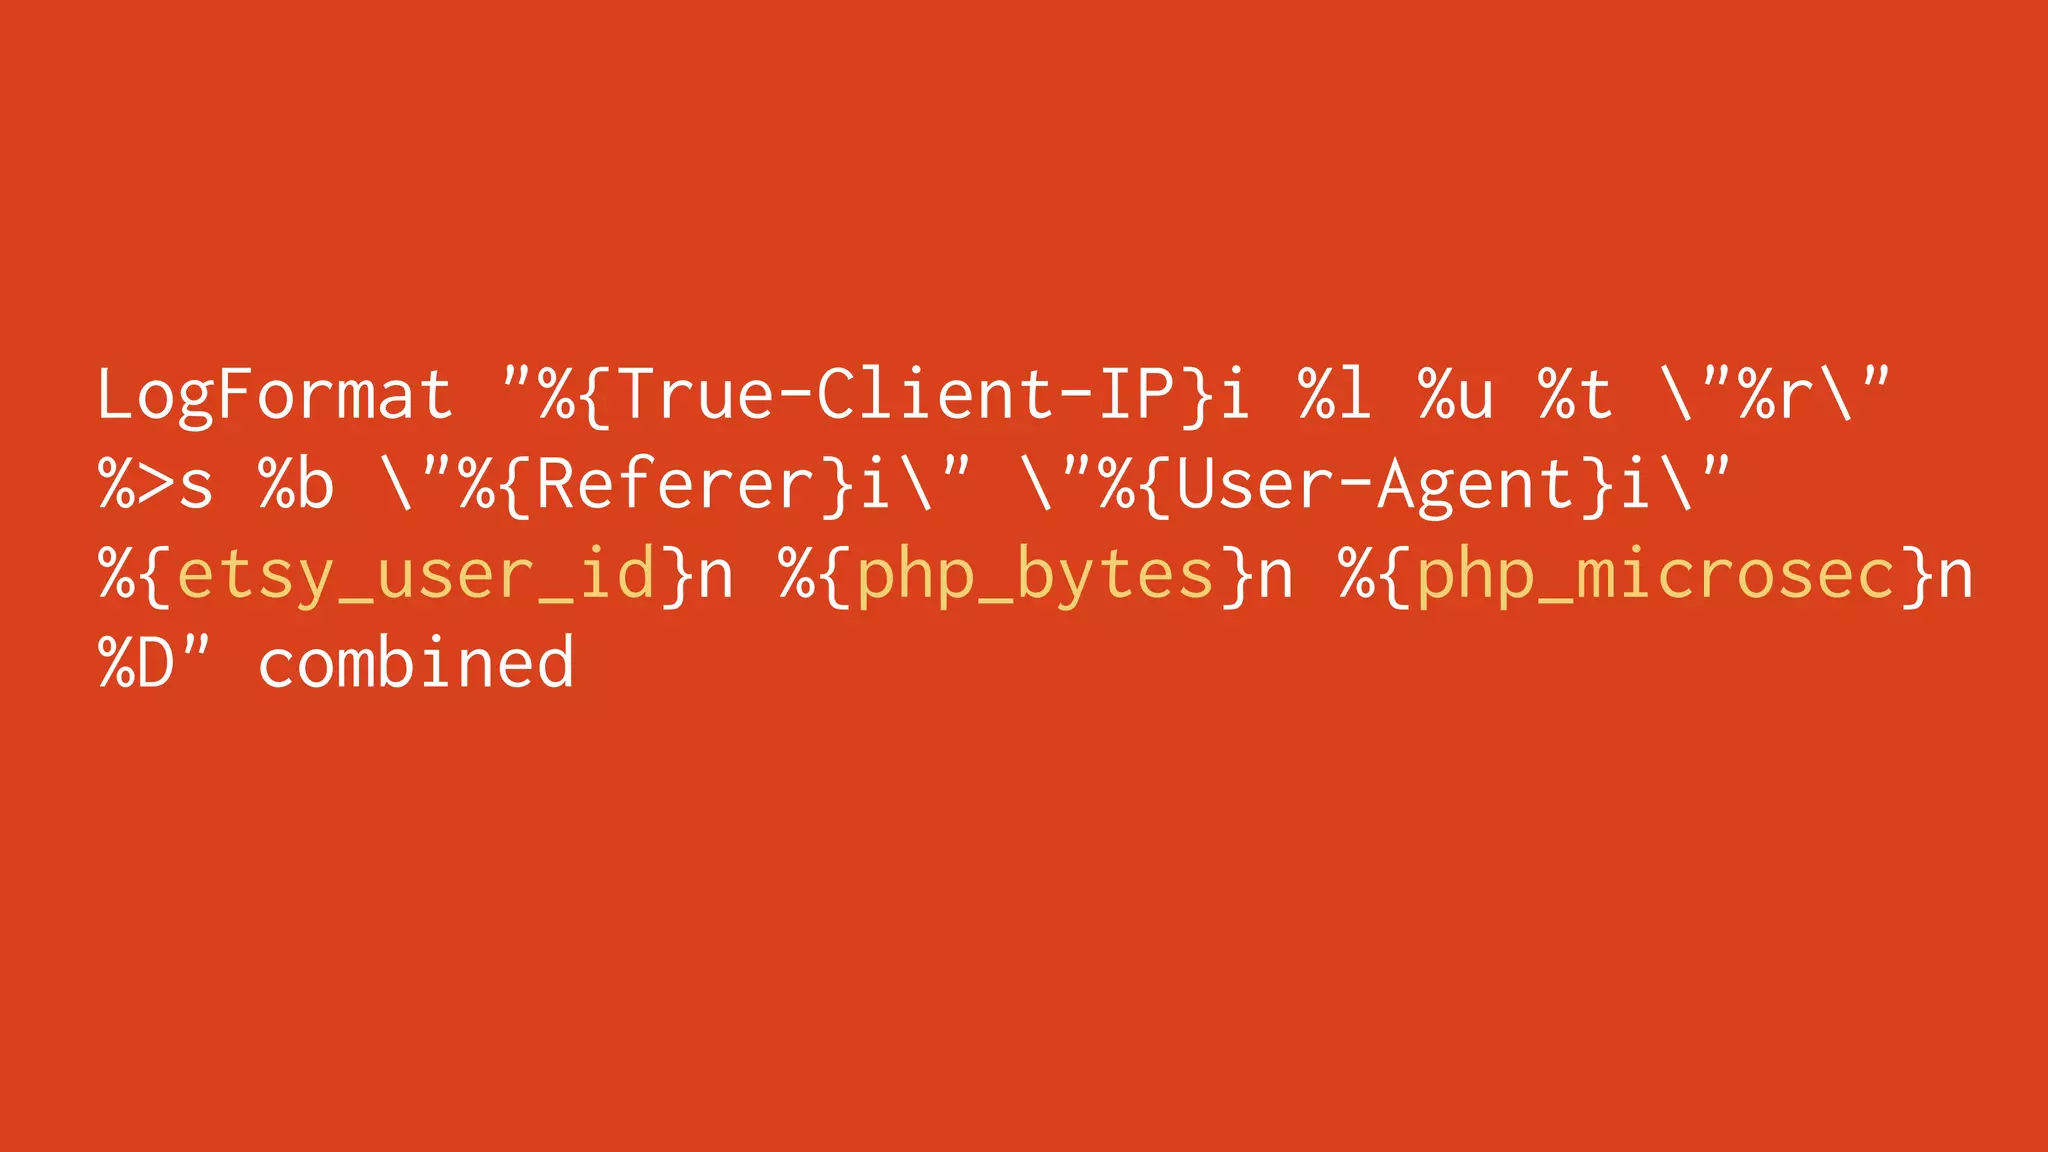
Etsy's performance culture is led by a team of two that focuses on measuring performance data, building tools to analyze logs and servers, training engineers, and motivating teams. They use tools like Logster to aggregate Apache logs into Graphite for generating graphs of metrics like response times. Profiling tools help identify slow database queries, services, and third party calls. The goal is to prove that improved speed leads to more usage and make all engineers consider performance in their work.


![Selenide alternative in Python - Introducing Selene [SeleniumCamp 2016]](https://cdn.slidesharecdn.com/ss_thumbnails/seleniumcamp2016-selenidealternativeinpython-introducingselene-160226140611-thumbnail.jpg?width=640&height=640&fit=bounds)


![How to create a performance-first culture [2018 WebPerfDays Amsterdam]](https://cdn.slidesharecdn.com/ss_thumbnails/2018-webperfdays-181116191738-thumbnail.jpg?width=640&height=640&fit=bounds)


![Vibe Coding vs. Spec-Driven Development [Free Meetup]](https://cdn.slidesharecdn.com/ss_thumbnails/vibecodingvsspecdrivendevelopment-251209105622-43f455e7-thumbnail.jpg?width=640&height=640&fit=bounds)
![Coded Agents – with UiPath SDK + LangGraph [Virtual Hands-on Workshop]](https://cdn.slidesharecdn.com/ss_thumbnails/codedagentsdeck-251215155422-5497c599-thumbnail.jpg?width=640&height=640&fit=bounds)


