Downloaded 138 times
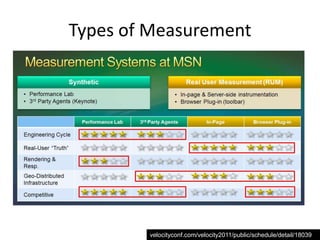

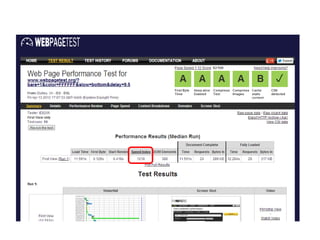
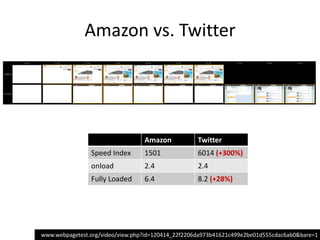
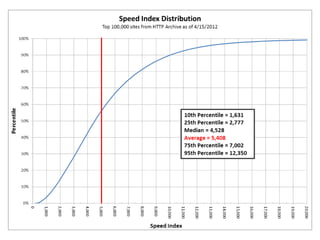

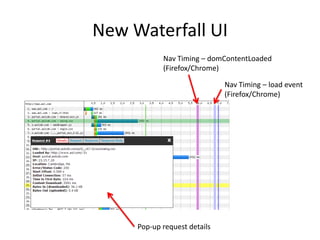
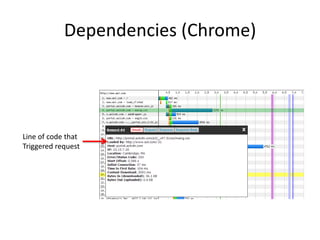
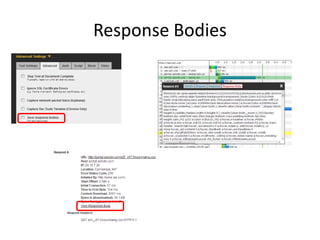


The document discusses various methods for measuring web performance, focusing on synthetic and real user monitoring (RUM) techniques. It highlights the differences between these approaches, such as the detail available and their ability to reflect actual user experiences. Additionally, it introduces performance metrics like speed index and new features in WebPageTest for improved performance analysis.