SlideShare a Scribd company logo
1 of 69
Properties of Nano Materials
Au
-
,
Au
Ref: Prof A K Gsnguli slides
The properties of materials can be different at the Nanoscale for two main
reasons:
First, nanomaterials have a relatively larger surface area when compared to
the same mass of material produced in a larger form.
Nano particles can make materials more chemically reactive and affect
their strength, magnetic or electrical properties.
Second, quantum effects can begin to dominate the behaviour of matter at
the Nanoscale
Reason of Properties Change in Nano
Size
• Nanoparticles exhibit unique properties due to their high surface
area to volume ratio.
• A spherical particle has a diameter (D) of 100nm.
– Calculate the volume (V) and surface area (SA)
3
3
-9 3
-22 3
4
3 6
(100 10 )
6
5.24 10
D
V r
V
V x m



 



2 2
-9 2
-14 2
4
(100 10 )
3.141 10
SA r D
SA
SA m
 

 
 
 
𝑆𝐴
𝑉
=
3.141 × 10⁻¹⁴𝑚2
5.24 × 10⁻²²𝑚3
𝑆𝐴
𝑉
≈ 6 × 10⁷
Surface Area:Volume Ratio
• This gives an approximate surface area to volume ratio of >107:1
which is significantly larger than a macro sized particle.
• As the surface area to volume ratio increases so does the
percentage of atoms at the surface and surface forces become
more dominant.
• Generally accepted material properties are derived from the
bulk, where the percentage of atoms at the surface is miniscule.
These properties change at the nanoscale.
Size
Nanoparticle Nanoparticle Volume Surface Area SA:Vol Ratio
Diameter
(nm)
Diameter
(um) (nm3) (nm2) (nm2/nm3)
1 0.001 0.524 3.14 6
10 0.01 524 314 0.6
100 0.1 523598 31416 0.06
1000 1 5.24E+08 3.14E+06 0.006
10000 10 5.24E+11 3.14E+08 0.0006
100000 100 5.24E+14 3.14E+10 0.00006
1000000 1000 5.24E+17 3.14E+12 0.000006
Some example calculations for volume and surface area of
nanoparticles.
These calculations use nm as unit of length.
Surface Area:Volume Ratio
In this graph:
SA = nm2
Vol = nm3
SA:Vol Ratio = nm2/nm3
The ratio increases
dramatically when the
nanoparticle diameter drops
below about 100 nm
Crystal Structure
• The spatial arrangement of atoms in a crystal lattice is
described by its unit cell.
• The unit cell is the smallest possible volume that
displays the full symmetry of the crystal.
• Many materials have a “preferred” unit cell.
Crystal Structure
• In 3 dimensions, unit cells are defined by 3 lattice
constants and 3 angles.
• This leads to 14 Bravais lattices, each having
characteristic restrictions on the lattice constants,
angles, and centering of atoms in the unit cell.
b
a
c
Crystal Structures
Simple Cubic
(SC)
Body Centered Cubic
(BCC)
Face Centered Cubic
(FCC)
For cubic unit cells, there are three centering types:
Size & Crystal Structure
• Most metals in the solid form close packed lattices
• Ag, Al, Cu, Co, Pb, Pt, Rh are Face Centered Cubic (FCC)
• Mg, Nd, Os, Re, Ru, Y, Zn are Hexagonal Close Packed (HCP)
• Cr, Li, Sr can form Body Centered Cubic (BCC) as well as (FCC) and
(HCP) depending upon formation energy
Size & Crystal Structure
• How does crystal structure impact nanoparticles?
• Nanoparticles have a “structural magic number”, that
is, the optimum number of atoms that leads to a stable
configuration while maintaining a specific structure.
• Structural magic number = minimum volume and
maximum density configuration
• If the crystal structure is known, then the number of
atoms per particle can be calculated.
Close-Packed Magic Number Clusters
• Number of atoms (y) in shell (n): y = 10n2 + 2 (n = 1,2,3…)
• Maximum number of nearest neighbors (metal-metal hcp packing)
• Decreasing percentage of surface atoms as cluster grows
Size & Crystal Structure
• For n layers, the number of atoms N in an
approximately spherical FCC nanoparticle is
given by the following formula:
N = 1/3[10n3 – 15n2 + 11n - 3]
• The number of atoms on the surface Nsurf
NSurf = 10n2 – 20n +12
Size & Crystal Structure
Poole, C., Owens, F. Introduction to Nanotechnology.
Wiley, New Jersey. 2003
Example Calculations:
How many atoms (N) are in
idealized Au NP’s with the
following diameters?
5 nm Au NP:
With 9 shells, n = 9 and
NP diameter = 17d = 4.896
nm
N = 1/3[10n3 – 15n2 + 11n - 3] N
= 2057
Other Approximate Values
10 nm = 17,900
20 nm = 137,000
30 nm = 482,000
40 nm = 1.1 million
50 nm = 2.2 million
The Nano particles affects many properties such as
 Magnetic properties
 Electrical properties
 Mechanical properties
 Thermal properties
 Band gap
 Optical properties
 Dielectric properties
Size Dependence of Properties
Mechanical Properties
dislocations
grain boundaries
atomic defects
 atomic defects, dislocations and strains
 grain boundaries and interfaces
 porosity
connectivity and percolation
short range order
connectivity and percolation
porosity
Yield strength refers to an
indication of maximum stress that
can be developed in a material
without causing
plastic deformation. It is the stress
at which a material exhibits a
specified permanent deformation
and is a practical approximation of
the elastic limit.
Hardness is a measure of the resistance to localize plastic deformation induced by
either mechanical indentation or abrasion. Macroscopic hardness is generally
characterized by strong intermolecular bonds.
Elastic modulus is the ratio of stress, below the proportional limit, to the
corresponding strain. It is the measure of rigidity or stiffness of a material.
Mechanical properties of nanomaterials may reach the theoretical strength, which are
one or two orders of magnitude higher than that of single crystals in the bulk
form.
Mechanical Properties
The mechanical properties of nanomaterials increase with decrease in size, because
smaller the size, lesser is the probability of finding imperfections such as dislocations,
vacancies, grain boundaries
• Strength of material improves significantly as the particle size decrease due to
perfect defect free surface.
• Hardness and yield strength of material also increases as particle size is
decreased.
• Elastic modulus and toughness of material also increases as particle size is
decreased.
Thermal properties
Melting Point (Microscopic Definition): Temperature at which
the atoms, ions, or molecules in a substance have enough energy to
overcome the intermolecular forces (Binding Energy) that hold the
them in a “fixed” position in a solid
Thermal properties
melt at the same temperature.
At macroscopic length scales (Bulk), the melting temperature of
materials is size-independent.
ice cube
glacier
Thermal properties
melting point
decreases
Nanocrystal size
decreases
surface energy
increases
Surface atoms require less energy to
move because they are in contact
with fewer atoms of the substance
Example:
10 nm Au NP melts at 964oC
bulk Au at 1064oC
<1.4 nm Au NPs melts below room temperature
3 nm CdSe nanocrystal melts at 700 K bulk CdSe
at 1678 K
In contact
with 3 atoms
In contact with 6 atoms
volume
Binding energy:
2
2/3
1/3 3/4
( 1) ( )
.
cZ Z d N Z
B E aA bA
A A

 
    
surface Electrostatic
repulsion Lack of
symmetry
Parity
2
1
surface SL
M M
f
T T
H r

 
 
 
 

 
Thermal properties
Melting point of the surface (1st layer)
TM Melting point of bulk materials
SL
  Solid-liquid interface energy
f
H
  Enthalpy
r  Radius of the particle
Melting point as a function of size
Source: Nanoscale Materials in Chemistry, Wiley, 2001
Melting point as a function of size
Source: Nanoscale Materials in Chemistry, Wiley, 2001
Au
Thermal Conductivity
bulk
•Heat is transported in materials by two different mechanisms:
Lattice vibration waves (phonons) and
Free electrons.
• In metals, the electron mechanism of heat transport is 8 significantly more
efficient than phonon processes.
•In the case of nonmetals, phonons are the main mechanism of thermal
transport.
In both metals and nonmetals, as the
system length scale is reduced to the
nanoscale, there are quantum
confinement and classical scattering
effects.
Optical Properties
Optical Properties
• The size dependence on the optical
properties of nanoparticles is the result of
two distinct phenomena:
a) Surface plasmon resonance (SPR)
-- metal nano-structures
b)Increased energy level spacing due to the
confinement of delocalized energy states.
-- prominent in semiconductors
Optical Properties -SPR
• Surface Plasmons
– Recall that metals can be modeled as an arrangement of
positive ions surrounded by a sea of free electrons.
– The sea of electrons behaves like a fluid and will move
under the influence of an electric field
+
-
+ + +
+ + + +
-
-
-
- - -
-
-
-
-
-
-
-
-
-
-
-
-
-
-
-
-
- -
-
- -
-
-
-
-
-
-
-
- -
-
-
-
- - - - - -
- -
- - - -
-
-
-
-
-
-
-
+
-
+ + +
+ + + +
-
-
-
- - -
-
-
- -
-
-
-
-
-
-
-
-
-
-
-
-
- -
-
- -
-
-
-
-
-
-
-
- -
-
-
- -
- - - - -
- -
- - - -
-
-
-
-
- -
-
-
-
-
- -
E-field
Optical Properties -SPR
Surface Plasmons
– If the electric field is oscillating (like a photon), then the
sea of electrons will oscillate too. These oscillations are
quantized and resonate at a specific frequency. Such
oscillations are called plasmon.
Source: MRS Bulletin 2005, 30(5), 338.
Resonance at a metal surface Resonance in metal NP
Optical Properties - SPR
• Surface Plasmons
– Formal definition: Plasmons are the coherent excitation of free
electrons in a metal.
– The plasmon resonance frequency (f) depends on particle size,
shape, and material type. It is related to the plasmon energy
(E) by Planck’s constant. E=h*f
– Surface plasmons are confined to the surface of the material.
– The optical properties of metal nanoparticles are dominated
by the interaction of surface plasmons with incident photons.
If the plasmons oscillation matches with the frequency of
incident radiation, resonance occurs and called surface
plasmon resonance. • It takes place when size of nanoparticle
is smaller than wavelength of incident radiations.
Optical Properties -SPR
Surface Plasmons
– Metal nanoparticles like gold and silver have plasmon frequencies in the
visible range.
– When white light impinges on metal nanoparticles the wavelength
corresponding to the plasmon frequency is absorbed.
– The spectral locations, strengths, and number of plasmon resonances for a
given particle depend on the particle’s shape and size.
Optical Properties
Optical absorption spectrum of 20- and 80-nm gold nanoparticles embedded in glass.
[Adapted from F. Gonella et al., in Handbook of Nanostructured Material and Nanotechnology,
H. S. Nalwa, ed., Academic Press, San Diego, 2000, Vol. 4, Chapter 2, p.85.]
• Absorption spectra of spherical Au nanoparticles
Martin, Olivier J.F. “Spectral response of plasmon resonant nanoparticles with non-regular
shape”. Optics Express Col. 6. No. 11 May 2000
Surface Plasmons: Shape
dependence of absorption spectra
•The amount of light that is scattered
into the far field is described by the
scattering cross section (SCS). The SCS
is plotted against the wavelength of light
used to illuminate a particle from a
specific angle.
•The arrows indicate the illumination
angle, and their colors correspond to the
different plot lines.
Optical Properties
Optical Properties- SPR
Martin, Olivier J.F. "Plasmons". Plasmons.
22 Mar. 2006. Ecole Polytechnique Fédérale
de Lausanne. 26 Jan. 2003.
Surface Plasmons:
Shape dependence of
absorption spectra. Resonant
frequency of different shapes
NPs are different.
Optical Properties – Band Gap
• Energy levels: from atoms to bulk materials…
– The Pauli Exclusion Principle states that electrons can only exist in unique,
discrete energy states.
– In an atom the energy states couple together through spin-orbit
interactions to form the energy levels .
– When atoms are brought together in a bulk material, the energy states form
nearly continuous bands of states, or in semiconductors and insulators,
nearly continuous bands separated by an energy gap.
N
Energy Energy
Atoms: Discrete Energy Levels Bulk Materials: Band Structures
Optical Properties- Band gap
• Energy levels
– In semiconductors and insulators, the valance band corresponds to the ground
states of the valance electrons.
– In semiconductors and insulators, the conduction band corresponds to excited
states where electrons are a free to move about in the material and participate in
conduction.
– In order for conduction to take place in a semiconductor, electrons must be
excited out of the valance band, across the band gap into the conduction band.
This process is called carrier generation.
– Conduction takes place due to the empty states in the valence band (holes) and
electrons in the conduction band.
Ec
Ev
Electron excited into conduction
band
band
gap
Optical Properties- Band gap
• Energy level spacing
– In semiconductors and insulators a photon with an energy equal to the band
gap energy is emitted when an electron in the conduction band recombines
with a hole in the valance band.
– The electronic band structure of a semiconductor dictates its optical
properties.
– GaP, a material commonly used for green LEDs, has an intrinsic band gap of
2.26 eV. Carrier recombination across the gap results in the emission of 550
nm light.
Eg = 2.26 eV
λ=550 nm
Optical Properties- Band gap
• Energy level spacing and quantum confinement
– The reduction in the number of atoms in a material results in the confinement
of normally delocalized energy states.
– Electron-hole pairs become spatially confined when the dimensions of a
nanoparticle approach the de Broglie wavelength of electrons in the
conduction band.
– As a result the spacing between energy bands of semiconductor or insulator is
increased (Similar to the particle in a box scenario, of introductory quantum
mechanics.)
Energy
Eg
Eg
Bulk Materials
Nano Materials
Increased
band gap
Band gap
The band gap is increases with reducing the
size of the particles
Bandgap is the energy needed to promote an electron from the valence band to
the conduction band
In bulk materials, there are 1023
atoms on surface, large no. of atoms
means large energy states, so band gap
is less.
As we go in nanorange, no. of atoms
decrease to 10-1000 atoms, so energy
states decrease, band gap is more.
Optical Properties - Band gap
• Energy level spacing and quantum confinement
– As semiconductor particle size is reduced the band gap
is increased.
– Absorbance and luminescence spectra are blue shifted
with decreasing particle size.
CdSe quantum dots
Jyoti K. Jaiswal and Sanford M. Simon. Potentials and pitfalls of fluorescent quantum
dots for biological imaging. TRENDS in Cell Biology Vol.14 No.9 September 2004
For semiconductors such as ZnO, CdS, and Si, the bandgap
changes with size
Optical Properties- Band gap
Electrical and Electronic Properties
• Effect of structure on conduction
– If nanostructures have fewer defects, one would
expect increased conductivity vs macroscale
• Other electrical effects on the nanoscale:
– Surface Scattering
– Change in Electronic Structure
– Ballistic Conduction
– Discrete Charging
– Tunneling Conduction
– Microstructural Effects
Surface Scattering
• Electrons have a mean-free-path (MFP) in solid
state materials.
• MFP is the distance between scattering events as
charge carriers move through the material.
• In metals, the MFP is on the order of 10’s of
nanometers.
• If the dimensions of a nanostructure are smaller
than the electron MFP, then surface scattering
becomes a factor.
Source of resistance: scattering
Total resistivity, ρT , of a metal is a
combination of the contribution of individual
and independent scattering, known as
Matthiessen’s rule:
thermal resistivity defect resistivity
Electron collisions with vibrating
atoms (phonons) displaced from their
equilibrium lattice positions are the
source of the thermal or phonon
contribution, which increases linearly
with temperature.
Impurity atoms, defects such as
vacancies, and grain boundaries
locally disrupt the periodic electric
potential of the lattice and
effectively cause electron scattering,
which is temperature independent.
Source
Considering individual electrical resistivity directly proportional to the respective
mean free path (λ) between collisions, the Matthiessen’s rule can be written as:
Increase in crystal perfection or reduction
of defects, which would result in a
reduction in defect scattering and, thus, a
reduction in resistivity.
However, the defect scattering makes a
minor contribution to the total electrical
resistivity of metals at room temperature,
and thus the reduction of defects has a very
small influence on the electrical resistivity.
Create an additional contribution to the
total resistivity due to surface
scattering, which plays a very important
role in determining the total electrical
resistivity of nanosized materials.
If the mean free electron path, λS, due
to the surface scattering is the smallest,
then it will dominate the total electrical
resistivity.
In nano, the surface scattering of electrons results in reduction of electrical conductivity.
+ ρs
Nano
 Reduction in material’s dimensions will increase crystal perfection or reduction
of defects, which would result in a reduction in defect scattering and, thus a
reduction in resistivity and conductivity increases.
 In nanowires and thin films, the surface scattering of electrons results in
reduction of electrical conductivity. When the critical dimension is smaller than
the mean free path, motion of electron will undergo elastic and inelastic
scattering.
Elastic scattering: electron reflects same way as photon reflects from mirror.
Both momentum and energy is conserved. Direction of motion of electron is
parallel to surface. Electrical conductivity is same as bulk materials.
Inelastic scattering: In this electron mean free path is terminated by
impinging on surface. The electron loses its kinetic energy and electrical
conductivity decreases.
Electrical and Electronic Properties
Surface scattering:
Electrical and Electronic Properties
Change of Electronic Structure:
Reduction in characteristic dimension below a critical size, i.e.
below De Broglie wavelength results in change of electronic
structure, leading to widening of band gap. Such a change
results in reduced electrical conductivity.
Some metal nanowires undergo transition to become
semiconductors and semiconductors might become insulators
when their diameters are reduced below a critical diameter.
Bulk
Nano
Reduced
dimension
Conductor/semiconductor Insulator
Increased Band-gap
Electrical and Electronic Properties
Change of Electronic Strucutre:
Electrical and Electronic Properties
Quantum Transport:
It occurs when length of conductor is smaller than electron mean
free path.
In this case, each transverse waveguide
mode or conducting channel contributes
G0 = 2e2h = 12.9kΩ-1
In ballistic transport there is no energy
dissipation and no elastic scattering takes
place.
 Ballistic conduction,
 Coulomb blockade and
 Tunnelling
Ballistic conduction:
Electrical and Electronic Properties
It occurs when length of conductor is smaller
than electron mean free path.
 Ballistic conduction:
L 

2
1
1
h L
R
q M 
 
 
 
 
2
1
h
R
q M

2
h L
R
q 

L 

Transport of a conductor
Ohm’s law
𝑖 𝐿 << 𝜆𝑚
𝑖𝑖 𝐿 << 𝜆𝜙
Coulomb Blockade & Single Electron Transistor
Electrical and Electronic Properties
 Coulomb Blockade & Single Electron Transistor:
It occurs when length of contact resistance is larger than resistance of nanostructures and total
capacitance of object is so small that adding a single electron requires significant energy.
Metal or semiconductor nanocrystals exhibit quantum effects that give rise to discrete charging of
metal particles.
Coulomb Blockade can be observed by making the device very small, like quantum dot (i.e. 3D
confinement). In this 3D confined state, electrons inside the QD will create a strong Coulomb
repulsion preventing other to flow. This, the device will no longer follow Ohms law. It require too
much Coulomb energy to add extra electron. This is called Coulomb blockade.
G
The Coulomb Energy
Ec = e2/2C
Electronic charge – e
Total Capacitance - C
Single Nanowire Transistor:
Electrical and Electronic Properties
 Tunelling:
It involves charge transport through an insulating medium
seperating two conductors that are closely spaced.
This is because electron wave function from two conductors
overlap inside insulator, when thickness is thin.
As thickness of layer increases, electrical conductivity decreases
Magnetic Properties
Magnetic Properties
due to the huge
surface energy
bulk materials nanostructured materials
Magnetic properties
are distinctly different
superparamagnetism
Ferromagnetism
Ref: Prof A K Gsnguli slides
Magnetic Properties
I
A Magnetic moment, (m or µ) = IA
Origin of Magnetism
Macroscopic Microscopic
(charge current) (atomic scale)
Magnetization (M) =
m
V
Magnetic moment per unit volume
Magnetic field strength (H) measure of the strength of the externally applied
magnetic field.
Magnetic moment
(m or µ)
is the measure of the strength of magnet can the ability to
produce magnetic field.
Magnetic induction /
Magnetic flux density (B) 
Magnetic flux per unit area.
0 ( )
B H M

 
Magnetic Susceptibility ,
M
H
  Gives physical idea about the magnetic
material
Energy of the magnetic moment (E) : E= - m.B
Magnetic Properties
Origin of Magnetism (atomic)
Nuclear Spin
Orbital motion of
electrons
Electron Spin
(Small effect)
electron nucleus
m m
Magnetic moment arising due to nucleus is
very small compared to electron.
or Am2
Electron
Nucleus
Magnetic Properties
Spin
Orbital
motion
Lattice
weak
In bulk, contribution of magnetic
moment due to orbital motion of
crystalline solid is small
In Nano  orbital – lattice coupling
decreases due to reduced surface energy
magnetization increases
Side reduced
Fundamental
component of
magnetism
Magnetism
of atom
Magnetism
of Molecule
Magnetism
of solid
Magnetism
of hybrids
Magnetic Properties
Spin
Orbital
motion
Lattice
weak
Contribution of magnetic moment due
to orbital motion of crystalline solid is
small in bulk
In Nano  orbital – lattice
coupling decreases due to reduced
surface energy magnetization
increases
Side reduced
Increase in Magnetization in nano
Decrease in Magnetization in further Nano
A Survey of Magnetic Nanoparticle Applications
A method for early diagnosis of brain cancer under development uses magnetic nanoparticles and nuclear magnetic
resonance (NMR) technology. The magnetic nanoparticles attach to particles in the blood stream called
microvesicles which originate in brain cancer cells. NMR is then used to detect these microvesicle/magnetic
nanoparticle clusters, allowing an early diagnosis.
Iron oxide nanoparticles can be used to improve Magnetic Resonance Imaging (MRI) of cancer tumors. The
nanoparticle is coated with a peptide that binds to a cancer tumor. Once the nanoparticles are attached to the tumor,
the magnetic property of the iron oxide enhances the images from the MRI scan.
Researchers at MIT have shown that iron oxide nanoparticles in water can be used to increase the amount of heat
transfer out of a system at localized hot spots. The researchers believe this technique could be applied to cooling
a wide range of devices, from electronics devices to fusion reactors.
Magnetic nanoparticles can attach to cancer cells in the blood stream. These nanoparticles may allow doctors to
remove cancer cells before they can establish new tumors.
Using nanoscavengers, in which a layer of reactive nanoparticles coat a synthetic core which is designed to be easily
magnetized. The nanoparticles, for example silver nanoparticles if bacteria is a problem, attach to or kill the
pollutants. Then when a magnetic field is applied the nanoscavengers are removed from the water.
Nanoparticles containing iron oxide that allows the nanoparticles to be directed, by a magnetic field, to stents.
This could allow drugs to be delivered directly to stents placed in arteries.
Iron oxide nanoparticles can used to improve MRI images of cancer tumors. The nanoparticle is coated with a
peptide that binds to a cancer tumor, once the nanoparticles are attached to the tumor the magnetic property of
the iron oxide enhances the images from the Magnetic Resonance Imagining scan.
Thank You

More Related Content

What's hot

Thermoelectricity
ThermoelectricityThermoelectricity
Thermoelectricityvani_lj
 
Metal nanocluster
Metal nanoclusterMetal nanocluster
Metal nanoclusterSudama04
 
Hydrothermal synthesis and characterization of one
Hydrothermal synthesis and characterization of oneHydrothermal synthesis and characterization of one
Hydrothermal synthesis and characterization of oneAlexander Decker
 
Core shell nanostructures
Core shell nanostructuresCore shell nanostructures
Core shell nanostructuresshashank chetty
 
Semiconductor part-2
Semiconductor part-2Semiconductor part-2
Semiconductor part-2Santanu Paria
 
Introduction to Nano-materials
Introduction to Nano-materials Introduction to Nano-materials
Introduction to Nano-materials Yashh Pandya
 
Splitting of water
Splitting of waterSplitting of water
Splitting of waterJohara13
 
Synthesis and Characterization of nanoparticle
Synthesis and Characterization of nanoparticleSynthesis and Characterization of nanoparticle
Synthesis and Characterization of nanoparticleMohammad Azam
 
Transmission Electron Microscope
Transmission Electron MicroscopeTransmission Electron Microscope
Transmission Electron MicroscopeManoranjan Ghosh
 

What's hot (20)

Magnetron sputtering
Magnetron sputteringMagnetron sputtering
Magnetron sputtering
 
Preparation of thin films
Preparation of thin filmsPreparation of thin films
Preparation of thin films
 
Thermoelectricity
ThermoelectricityThermoelectricity
Thermoelectricity
 
Metal nanocluster
Metal nanoclusterMetal nanocluster
Metal nanocluster
 
Quantum dots
Quantum dots Quantum dots
Quantum dots
 
Hydrothermal synthesis and characterization of one
Hydrothermal synthesis and characterization of oneHydrothermal synthesis and characterization of one
Hydrothermal synthesis and characterization of one
 
Nanomaterials
NanomaterialsNanomaterials
Nanomaterials
 
Synthesis of nanomaterials
Synthesis of nanomaterialsSynthesis of nanomaterials
Synthesis of nanomaterials
 
Core shell nanostructures
Core shell nanostructuresCore shell nanostructures
Core shell nanostructures
 
Semiconductor part-2
Semiconductor part-2Semiconductor part-2
Semiconductor part-2
 
Introduction to Nano-materials
Introduction to Nano-materials Introduction to Nano-materials
Introduction to Nano-materials
 
Splitting of water
Splitting of waterSplitting of water
Splitting of water
 
Chemical vapour deposition
Chemical vapour depositionChemical vapour deposition
Chemical vapour deposition
 
Quantum dots
Quantum dotsQuantum dots
Quantum dots
 
Synthesis and Characterization of nanoparticle
Synthesis and Characterization of nanoparticleSynthesis and Characterization of nanoparticle
Synthesis and Characterization of nanoparticle
 
Phonons lecture
Phonons lecturePhonons lecture
Phonons lecture
 
Growth of single crystals
Growth of  single crystalsGrowth of  single crystals
Growth of single crystals
 
Transmission Electron Microscope
Transmission Electron MicroscopeTransmission Electron Microscope
Transmission Electron Microscope
 
Presentation
PresentationPresentation
Presentation
 
14 ch60r29 hydrogen production
14 ch60r29 hydrogen production14 ch60r29 hydrogen production
14 ch60r29 hydrogen production
 

Similar to 13_Properties of Nanomaterials.pptx

Properties of Nano-materials
Properties of Nano-materialsProperties of Nano-materials
Properties of Nano-materialsPartha P. Mishra
 
sizedependentproperties.pptx
sizedependentproperties.pptxsizedependentproperties.pptx
sizedependentproperties.pptxAditya Bhardwaj
 
NanoBiotechnology Lecture-1-3-2023.pdf
NanoBiotechnology Lecture-1-3-2023.pdfNanoBiotechnology Lecture-1-3-2023.pdf
NanoBiotechnology Lecture-1-3-2023.pdfSudeshnaChakraborty38
 
Nanotechnology In Bio Medical Applications
Nanotechnology In Bio Medical ApplicationsNanotechnology In Bio Medical Applications
Nanotechnology In Bio Medical Applicationslusik
 
cnt-nanomaterials-130227040648-phpapp02.pdf
cnt-nanomaterials-130227040648-phpapp02.pdfcnt-nanomaterials-130227040648-phpapp02.pdf
cnt-nanomaterials-130227040648-phpapp02.pdfmukhtareffendi2
 
Size effects
Size effectsSize effects
Size effectssameerr98
 
Fundamentals of Nanomaterials.pdf
Fundamentals of Nanomaterials.pdfFundamentals of Nanomaterials.pdf
Fundamentals of Nanomaterials.pdfJeganparamasivam19
 
NACK_U3_Maeder_Nanoparticles_Nanostructures.pptx
NACK_U3_Maeder_Nanoparticles_Nanostructures.pptxNACK_U3_Maeder_Nanoparticles_Nanostructures.pptx
NACK_U3_Maeder_Nanoparticles_Nanostructures.pptxNavinrajTI1
 
Crystal structure of metals and semiconductors
Crystal structure of metals and semiconductorsCrystal structure of metals and semiconductors
Crystal structure of metals and semiconductorsMUKHTIAR HUSSAIN
 
Introduction nanoscience
Introduction nanoscienceIntroduction nanoscience
Introduction nanosciencePraveen Vaidya
 
Size effect of nanomaterials part1
Size effect of nanomaterials part1Size effect of nanomaterials part1
Size effect of nanomaterials part1Mugilan Narayanasamy
 
Surface and bulk
Surface and bulk Surface and bulk
Surface and bulk hacguest
 
Introduction to nanoscience and nanotechnology
Introduction to nanoscience and nanotechnologyIntroduction to nanoscience and nanotechnology
Introduction to nanoscience and nanotechnologyaimanmukhtar1
 

Similar to 13_Properties of Nanomaterials.pptx (20)

Properties of Nano-materials
Properties of Nano-materialsProperties of Nano-materials
Properties of Nano-materials
 
sizedependentproperties.pptx
sizedependentproperties.pptxsizedependentproperties.pptx
sizedependentproperties.pptx
 
NanoBiotechnology Lecture-1-3-2023.pdf
NanoBiotechnology Lecture-1-3-2023.pdfNanoBiotechnology Lecture-1-3-2023.pdf
NanoBiotechnology Lecture-1-3-2023.pdf
 
Nanotechnology In Bio Medical Applications
Nanotechnology In Bio Medical ApplicationsNanotechnology In Bio Medical Applications
Nanotechnology In Bio Medical Applications
 
cnt-nanomaterials-130227040648-phpapp02.pdf
cnt-nanomaterials-130227040648-phpapp02.pdfcnt-nanomaterials-130227040648-phpapp02.pdf
cnt-nanomaterials-130227040648-phpapp02.pdf
 
Size effects
Size effectsSize effects
Size effects
 
Size effect of nanomaterials
Size effect of nanomaterials Size effect of nanomaterials
Size effect of nanomaterials
 
Fundamentals of Nanomaterials.pdf
Fundamentals of Nanomaterials.pdfFundamentals of Nanomaterials.pdf
Fundamentals of Nanomaterials.pdf
 
NACK_U3_Maeder_Nanoparticles_Nanostructures.pptx
NACK_U3_Maeder_Nanoparticles_Nanostructures.pptxNACK_U3_Maeder_Nanoparticles_Nanostructures.pptx
NACK_U3_Maeder_Nanoparticles_Nanostructures.pptx
 
Nano technology.pptx
Nano technology.pptxNano technology.pptx
Nano technology.pptx
 
Material and Metallurgy Introduction
Material and Metallurgy IntroductionMaterial and Metallurgy Introduction
Material and Metallurgy Introduction
 
Crystal structure of metals and semiconductors
Crystal structure of metals and semiconductorsCrystal structure of metals and semiconductors
Crystal structure of metals and semiconductors
 
Introduction nanoscience
Introduction nanoscienceIntroduction nanoscience
Introduction nanoscience
 
CHEMISTRY OF NANOSCALE MATERIALS
CHEMISTRY OF NANOSCALE MATERIALSCHEMISTRY OF NANOSCALE MATERIALS
CHEMISTRY OF NANOSCALE MATERIALS
 
nanotechnology.pptx
nanotechnology.pptxnanotechnology.pptx
nanotechnology.pptx
 
Size effect of nanomaterials part1
Size effect of nanomaterials part1Size effect of nanomaterials part1
Size effect of nanomaterials part1
 
Liquids and Solids
Liquids and SolidsLiquids and Solids
Liquids and Solids
 
Surface and bulk
Surface and bulk Surface and bulk
Surface and bulk
 
6. Nanomaterials
6. Nanomaterials6. Nanomaterials
6. Nanomaterials
 
Introduction to nanoscience and nanotechnology
Introduction to nanoscience and nanotechnologyIntroduction to nanoscience and nanotechnology
Introduction to nanoscience and nanotechnology
 

Recently uploaded

BUMI DAN ANTARIKSA PROJEK IPAS SMK KELAS X.pdf
BUMI DAN ANTARIKSA PROJEK IPAS SMK KELAS X.pdfBUMI DAN ANTARIKSA PROJEK IPAS SMK KELAS X.pdf
BUMI DAN ANTARIKSA PROJEK IPAS SMK KELAS X.pdfWildaNurAmalia2
 
SOLUBLE PATTERN RECOGNITION RECEPTORS.pptx
SOLUBLE PATTERN RECOGNITION RECEPTORS.pptxSOLUBLE PATTERN RECOGNITION RECEPTORS.pptx
SOLUBLE PATTERN RECOGNITION RECEPTORS.pptxkessiyaTpeter
 
BIOETHICS IN RECOMBINANT DNA TECHNOLOGY.
BIOETHICS IN RECOMBINANT DNA TECHNOLOGY.BIOETHICS IN RECOMBINANT DNA TECHNOLOGY.
BIOETHICS IN RECOMBINANT DNA TECHNOLOGY.PraveenaKalaiselvan1
 
RESPIRATORY ADAPTATIONS TO HYPOXIA IN HUMNAS.pptx
RESPIRATORY ADAPTATIONS TO HYPOXIA IN HUMNAS.pptxRESPIRATORY ADAPTATIONS TO HYPOXIA IN HUMNAS.pptx
RESPIRATORY ADAPTATIONS TO HYPOXIA IN HUMNAS.pptxFarihaAbdulRasheed
 
Vision and reflection on Mining Software Repositories research in 2024
Vision and reflection on Mining Software Repositories research in 2024Vision and reflection on Mining Software Repositories research in 2024
Vision and reflection on Mining Software Repositories research in 2024AyushiRastogi48
 
Evidences of Evolution General Biology 2
Evidences of Evolution General Biology 2Evidences of Evolution General Biology 2
Evidences of Evolution General Biology 2John Carlo Rollon
 
Pests of safflower_Binomics_Identification_Dr.UPR.pdf
Pests of safflower_Binomics_Identification_Dr.UPR.pdfPests of safflower_Binomics_Identification_Dr.UPR.pdf
Pests of safflower_Binomics_Identification_Dr.UPR.pdfPirithiRaju
 
zoogeography of pakistan.pptx fauna of Pakistan
zoogeography of pakistan.pptx fauna of Pakistanzoogeography of pakistan.pptx fauna of Pakistan
zoogeography of pakistan.pptx fauna of Pakistanzohaibmir069
 
FREE NURSING BUNDLE FOR NURSES.PDF by na
FREE NURSING BUNDLE FOR NURSES.PDF by naFREE NURSING BUNDLE FOR NURSES.PDF by na
FREE NURSING BUNDLE FOR NURSES.PDF by naJASISJULIANOELYNV
 
BREEDING FOR RESISTANCE TO BIOTIC STRESS.pptx
BREEDING FOR RESISTANCE TO BIOTIC STRESS.pptxBREEDING FOR RESISTANCE TO BIOTIC STRESS.pptx
BREEDING FOR RESISTANCE TO BIOTIC STRESS.pptxPABOLU TEJASREE
 
‏‏VIRUS - 123455555555555555555555555555555555555555
‏‏VIRUS -  123455555555555555555555555555555555555555‏‏VIRUS -  123455555555555555555555555555555555555555
‏‏VIRUS - 123455555555555555555555555555555555555555kikilily0909
 
Recombinant DNA technology( Transgenic plant and animal)
Recombinant DNA technology( Transgenic plant and animal)Recombinant DNA technology( Transgenic plant and animal)
Recombinant DNA technology( Transgenic plant and animal)DHURKADEVIBASKAR
 
Call Us ≽ 9953322196 ≼ Call Girls In Lajpat Nagar (Delhi) |
Call Us ≽ 9953322196 ≼ Call Girls In Lajpat Nagar (Delhi) |Call Us ≽ 9953322196 ≼ Call Girls In Lajpat Nagar (Delhi) |
Call Us ≽ 9953322196 ≼ Call Girls In Lajpat Nagar (Delhi) |aasikanpl
 
Call Girls in Mayapuri Delhi 💯Call Us 🔝9953322196🔝 💯Escort.
Call Girls in Mayapuri Delhi 💯Call Us 🔝9953322196🔝 💯Escort.Call Girls in Mayapuri Delhi 💯Call Us 🔝9953322196🔝 💯Escort.
Call Girls in Mayapuri Delhi 💯Call Us 🔝9953322196🔝 💯Escort.aasikanpl
 
TOPIC 8 Temperature and Heat.pdf physics
TOPIC 8 Temperature and Heat.pdf physicsTOPIC 8 Temperature and Heat.pdf physics
TOPIC 8 Temperature and Heat.pdf physicsssuserddc89b
 
(9818099198) Call Girls In Noida Sector 14 (NOIDA ESCORTS)
(9818099198) Call Girls In Noida Sector 14 (NOIDA ESCORTS)(9818099198) Call Girls In Noida Sector 14 (NOIDA ESCORTS)
(9818099198) Call Girls In Noida Sector 14 (NOIDA ESCORTS)riyaescorts54
 
Bentham & Hooker's Classification. along with the merits and demerits of the ...
Bentham & Hooker's Classification. along with the merits and demerits of the ...Bentham & Hooker's Classification. along with the merits and demerits of the ...
Bentham & Hooker's Classification. along with the merits and demerits of the ...Nistarini College, Purulia (W.B) India
 
Pests of jatropha_Bionomics_identification_Dr.UPR.pdf
Pests of jatropha_Bionomics_identification_Dr.UPR.pdfPests of jatropha_Bionomics_identification_Dr.UPR.pdf
Pests of jatropha_Bionomics_identification_Dr.UPR.pdfPirithiRaju
 
Speech, hearing, noise, intelligibility.pptx
Speech, hearing, noise, intelligibility.pptxSpeech, hearing, noise, intelligibility.pptx
Speech, hearing, noise, intelligibility.pptxpriyankatabhane
 

Recently uploaded (20)

BUMI DAN ANTARIKSA PROJEK IPAS SMK KELAS X.pdf
BUMI DAN ANTARIKSA PROJEK IPAS SMK KELAS X.pdfBUMI DAN ANTARIKSA PROJEK IPAS SMK KELAS X.pdf
BUMI DAN ANTARIKSA PROJEK IPAS SMK KELAS X.pdf
 
SOLUBLE PATTERN RECOGNITION RECEPTORS.pptx
SOLUBLE PATTERN RECOGNITION RECEPTORS.pptxSOLUBLE PATTERN RECOGNITION RECEPTORS.pptx
SOLUBLE PATTERN RECOGNITION RECEPTORS.pptx
 
BIOETHICS IN RECOMBINANT DNA TECHNOLOGY.
BIOETHICS IN RECOMBINANT DNA TECHNOLOGY.BIOETHICS IN RECOMBINANT DNA TECHNOLOGY.
BIOETHICS IN RECOMBINANT DNA TECHNOLOGY.
 
RESPIRATORY ADAPTATIONS TO HYPOXIA IN HUMNAS.pptx
RESPIRATORY ADAPTATIONS TO HYPOXIA IN HUMNAS.pptxRESPIRATORY ADAPTATIONS TO HYPOXIA IN HUMNAS.pptx
RESPIRATORY ADAPTATIONS TO HYPOXIA IN HUMNAS.pptx
 
Vision and reflection on Mining Software Repositories research in 2024
Vision and reflection on Mining Software Repositories research in 2024Vision and reflection on Mining Software Repositories research in 2024
Vision and reflection on Mining Software Repositories research in 2024
 
Evidences of Evolution General Biology 2
Evidences of Evolution General Biology 2Evidences of Evolution General Biology 2
Evidences of Evolution General Biology 2
 
Pests of safflower_Binomics_Identification_Dr.UPR.pdf
Pests of safflower_Binomics_Identification_Dr.UPR.pdfPests of safflower_Binomics_Identification_Dr.UPR.pdf
Pests of safflower_Binomics_Identification_Dr.UPR.pdf
 
zoogeography of pakistan.pptx fauna of Pakistan
zoogeography of pakistan.pptx fauna of Pakistanzoogeography of pakistan.pptx fauna of Pakistan
zoogeography of pakistan.pptx fauna of Pakistan
 
FREE NURSING BUNDLE FOR NURSES.PDF by na
FREE NURSING BUNDLE FOR NURSES.PDF by naFREE NURSING BUNDLE FOR NURSES.PDF by na
FREE NURSING BUNDLE FOR NURSES.PDF by na
 
BREEDING FOR RESISTANCE TO BIOTIC STRESS.pptx
BREEDING FOR RESISTANCE TO BIOTIC STRESS.pptxBREEDING FOR RESISTANCE TO BIOTIC STRESS.pptx
BREEDING FOR RESISTANCE TO BIOTIC STRESS.pptx
 
‏‏VIRUS - 123455555555555555555555555555555555555555
‏‏VIRUS -  123455555555555555555555555555555555555555‏‏VIRUS -  123455555555555555555555555555555555555555
‏‏VIRUS - 123455555555555555555555555555555555555555
 
Recombinant DNA technology( Transgenic plant and animal)
Recombinant DNA technology( Transgenic plant and animal)Recombinant DNA technology( Transgenic plant and animal)
Recombinant DNA technology( Transgenic plant and animal)
 
Call Us ≽ 9953322196 ≼ Call Girls In Lajpat Nagar (Delhi) |
Call Us ≽ 9953322196 ≼ Call Girls In Lajpat Nagar (Delhi) |Call Us ≽ 9953322196 ≼ Call Girls In Lajpat Nagar (Delhi) |
Call Us ≽ 9953322196 ≼ Call Girls In Lajpat Nagar (Delhi) |
 
Call Girls in Mayapuri Delhi 💯Call Us 🔝9953322196🔝 💯Escort.
Call Girls in Mayapuri Delhi 💯Call Us 🔝9953322196🔝 💯Escort.Call Girls in Mayapuri Delhi 💯Call Us 🔝9953322196🔝 💯Escort.
Call Girls in Mayapuri Delhi 💯Call Us 🔝9953322196🔝 💯Escort.
 
TOPIC 8 Temperature and Heat.pdf physics
TOPIC 8 Temperature and Heat.pdf physicsTOPIC 8 Temperature and Heat.pdf physics
TOPIC 8 Temperature and Heat.pdf physics
 
(9818099198) Call Girls In Noida Sector 14 (NOIDA ESCORTS)
(9818099198) Call Girls In Noida Sector 14 (NOIDA ESCORTS)(9818099198) Call Girls In Noida Sector 14 (NOIDA ESCORTS)
(9818099198) Call Girls In Noida Sector 14 (NOIDA ESCORTS)
 
Volatile Oils Pharmacognosy And Phytochemistry -I
Volatile Oils Pharmacognosy And Phytochemistry -IVolatile Oils Pharmacognosy And Phytochemistry -I
Volatile Oils Pharmacognosy And Phytochemistry -I
 
Bentham & Hooker's Classification. along with the merits and demerits of the ...
Bentham & Hooker's Classification. along with the merits and demerits of the ...Bentham & Hooker's Classification. along with the merits and demerits of the ...
Bentham & Hooker's Classification. along with the merits and demerits of the ...
 
Pests of jatropha_Bionomics_identification_Dr.UPR.pdf
Pests of jatropha_Bionomics_identification_Dr.UPR.pdfPests of jatropha_Bionomics_identification_Dr.UPR.pdf
Pests of jatropha_Bionomics_identification_Dr.UPR.pdf
 
Speech, hearing, noise, intelligibility.pptx
Speech, hearing, noise, intelligibility.pptxSpeech, hearing, noise, intelligibility.pptx
Speech, hearing, noise, intelligibility.pptx
 

13_Properties of Nanomaterials.pptx

  • 1. Properties of Nano Materials
  • 2. Au - , Au Ref: Prof A K Gsnguli slides
  • 3. The properties of materials can be different at the Nanoscale for two main reasons: First, nanomaterials have a relatively larger surface area when compared to the same mass of material produced in a larger form. Nano particles can make materials more chemically reactive and affect their strength, magnetic or electrical properties. Second, quantum effects can begin to dominate the behaviour of matter at the Nanoscale Reason of Properties Change in Nano
  • 4. Size • Nanoparticles exhibit unique properties due to their high surface area to volume ratio. • A spherical particle has a diameter (D) of 100nm. – Calculate the volume (V) and surface area (SA) 3 3 -9 3 -22 3 4 3 6 (100 10 ) 6 5.24 10 D V r V V x m         2 2 -9 2 -14 2 4 (100 10 ) 3.141 10 SA r D SA SA m          𝑆𝐴 𝑉 = 3.141 × 10⁻¹⁴𝑚2 5.24 × 10⁻²²𝑚3 𝑆𝐴 𝑉 ≈ 6 × 10⁷
  • 5. Surface Area:Volume Ratio • This gives an approximate surface area to volume ratio of >107:1 which is significantly larger than a macro sized particle. • As the surface area to volume ratio increases so does the percentage of atoms at the surface and surface forces become more dominant. • Generally accepted material properties are derived from the bulk, where the percentage of atoms at the surface is miniscule. These properties change at the nanoscale.
  • 6. Size Nanoparticle Nanoparticle Volume Surface Area SA:Vol Ratio Diameter (nm) Diameter (um) (nm3) (nm2) (nm2/nm3) 1 0.001 0.524 3.14 6 10 0.01 524 314 0.6 100 0.1 523598 31416 0.06 1000 1 5.24E+08 3.14E+06 0.006 10000 10 5.24E+11 3.14E+08 0.0006 100000 100 5.24E+14 3.14E+10 0.00006 1000000 1000 5.24E+17 3.14E+12 0.000006 Some example calculations for volume and surface area of nanoparticles. These calculations use nm as unit of length.
  • 7. Surface Area:Volume Ratio In this graph: SA = nm2 Vol = nm3 SA:Vol Ratio = nm2/nm3 The ratio increases dramatically when the nanoparticle diameter drops below about 100 nm
  • 8. Crystal Structure • The spatial arrangement of atoms in a crystal lattice is described by its unit cell. • The unit cell is the smallest possible volume that displays the full symmetry of the crystal. • Many materials have a “preferred” unit cell.
  • 9. Crystal Structure • In 3 dimensions, unit cells are defined by 3 lattice constants and 3 angles. • This leads to 14 Bravais lattices, each having characteristic restrictions on the lattice constants, angles, and centering of atoms in the unit cell. b a c
  • 10. Crystal Structures Simple Cubic (SC) Body Centered Cubic (BCC) Face Centered Cubic (FCC) For cubic unit cells, there are three centering types:
  • 11. Size & Crystal Structure • Most metals in the solid form close packed lattices • Ag, Al, Cu, Co, Pb, Pt, Rh are Face Centered Cubic (FCC) • Mg, Nd, Os, Re, Ru, Y, Zn are Hexagonal Close Packed (HCP) • Cr, Li, Sr can form Body Centered Cubic (BCC) as well as (FCC) and (HCP) depending upon formation energy
  • 12. Size & Crystal Structure • How does crystal structure impact nanoparticles? • Nanoparticles have a “structural magic number”, that is, the optimum number of atoms that leads to a stable configuration while maintaining a specific structure. • Structural magic number = minimum volume and maximum density configuration • If the crystal structure is known, then the number of atoms per particle can be calculated.
  • 13. Close-Packed Magic Number Clusters • Number of atoms (y) in shell (n): y = 10n2 + 2 (n = 1,2,3…) • Maximum number of nearest neighbors (metal-metal hcp packing) • Decreasing percentage of surface atoms as cluster grows
  • 14. Size & Crystal Structure • For n layers, the number of atoms N in an approximately spherical FCC nanoparticle is given by the following formula: N = 1/3[10n3 – 15n2 + 11n - 3] • The number of atoms on the surface Nsurf NSurf = 10n2 – 20n +12
  • 15. Size & Crystal Structure Poole, C., Owens, F. Introduction to Nanotechnology. Wiley, New Jersey. 2003 Example Calculations: How many atoms (N) are in idealized Au NP’s with the following diameters? 5 nm Au NP: With 9 shells, n = 9 and NP diameter = 17d = 4.896 nm N = 1/3[10n3 – 15n2 + 11n - 3] N = 2057 Other Approximate Values 10 nm = 17,900 20 nm = 137,000 30 nm = 482,000 40 nm = 1.1 million 50 nm = 2.2 million
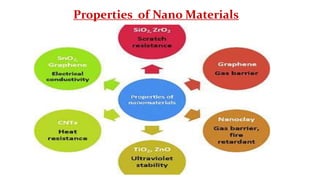
  • 16. The Nano particles affects many properties such as  Magnetic properties  Electrical properties  Mechanical properties  Thermal properties  Band gap  Optical properties  Dielectric properties Size Dependence of Properties
  • 18. Mechanical Properties dislocations grain boundaries atomic defects  atomic defects, dislocations and strains  grain boundaries and interfaces  porosity connectivity and percolation short range order connectivity and percolation porosity
  • 19. Yield strength refers to an indication of maximum stress that can be developed in a material without causing plastic deformation. It is the stress at which a material exhibits a specified permanent deformation and is a practical approximation of the elastic limit. Hardness is a measure of the resistance to localize plastic deformation induced by either mechanical indentation or abrasion. Macroscopic hardness is generally characterized by strong intermolecular bonds. Elastic modulus is the ratio of stress, below the proportional limit, to the corresponding strain. It is the measure of rigidity or stiffness of a material.
  • 20. Mechanical properties of nanomaterials may reach the theoretical strength, which are one or two orders of magnitude higher than that of single crystals in the bulk form. Mechanical Properties The mechanical properties of nanomaterials increase with decrease in size, because smaller the size, lesser is the probability of finding imperfections such as dislocations, vacancies, grain boundaries • Strength of material improves significantly as the particle size decrease due to perfect defect free surface. • Hardness and yield strength of material also increases as particle size is decreased. • Elastic modulus and toughness of material also increases as particle size is decreased.
  • 22. Melting Point (Microscopic Definition): Temperature at which the atoms, ions, or molecules in a substance have enough energy to overcome the intermolecular forces (Binding Energy) that hold the them in a “fixed” position in a solid Thermal properties melt at the same temperature. At macroscopic length scales (Bulk), the melting temperature of materials is size-independent. ice cube glacier
  • 23. Thermal properties melting point decreases Nanocrystal size decreases surface energy increases Surface atoms require less energy to move because they are in contact with fewer atoms of the substance Example: 10 nm Au NP melts at 964oC bulk Au at 1064oC <1.4 nm Au NPs melts below room temperature 3 nm CdSe nanocrystal melts at 700 K bulk CdSe at 1678 K In contact with 3 atoms In contact with 6 atoms volume Binding energy: 2 2/3 1/3 3/4 ( 1) ( ) . cZ Z d N Z B E aA bA A A         surface Electrostatic repulsion Lack of symmetry Parity
  • 24. 2 1 surface SL M M f T T H r             Thermal properties Melting point of the surface (1st layer) TM Melting point of bulk materials SL   Solid-liquid interface energy f H   Enthalpy r  Radius of the particle
  • 25. Melting point as a function of size Source: Nanoscale Materials in Chemistry, Wiley, 2001
  • 26. Melting point as a function of size Source: Nanoscale Materials in Chemistry, Wiley, 2001 Au
  • 27. Thermal Conductivity bulk •Heat is transported in materials by two different mechanisms: Lattice vibration waves (phonons) and Free electrons. • In metals, the electron mechanism of heat transport is 8 significantly more efficient than phonon processes. •In the case of nonmetals, phonons are the main mechanism of thermal transport. In both metals and nonmetals, as the system length scale is reduced to the nanoscale, there are quantum confinement and classical scattering effects.
  • 29. Optical Properties • The size dependence on the optical properties of nanoparticles is the result of two distinct phenomena: a) Surface plasmon resonance (SPR) -- metal nano-structures b)Increased energy level spacing due to the confinement of delocalized energy states. -- prominent in semiconductors
  • 30. Optical Properties -SPR • Surface Plasmons – Recall that metals can be modeled as an arrangement of positive ions surrounded by a sea of free electrons. – The sea of electrons behaves like a fluid and will move under the influence of an electric field + - + + + + + + + - - - - - - - - - - - - - - - - - - - - - - - - - - - - - - - - - - - - - - - - - - - - - - - - - - - - - - - - - - + - + + + + + + + - - - - - - - - - - - - - - - - - - - - - - - - - - - - - - - - - - - - - - - - - - - - - - - - - - - - - - - - - - - - - - - E-field
  • 31. Optical Properties -SPR Surface Plasmons – If the electric field is oscillating (like a photon), then the sea of electrons will oscillate too. These oscillations are quantized and resonate at a specific frequency. Such oscillations are called plasmon. Source: MRS Bulletin 2005, 30(5), 338. Resonance at a metal surface Resonance in metal NP
  • 32. Optical Properties - SPR • Surface Plasmons – Formal definition: Plasmons are the coherent excitation of free electrons in a metal. – The plasmon resonance frequency (f) depends on particle size, shape, and material type. It is related to the plasmon energy (E) by Planck’s constant. E=h*f – Surface plasmons are confined to the surface of the material. – The optical properties of metal nanoparticles are dominated by the interaction of surface plasmons with incident photons. If the plasmons oscillation matches with the frequency of incident radiation, resonance occurs and called surface plasmon resonance. • It takes place when size of nanoparticle is smaller than wavelength of incident radiations.
  • 33. Optical Properties -SPR Surface Plasmons – Metal nanoparticles like gold and silver have plasmon frequencies in the visible range. – When white light impinges on metal nanoparticles the wavelength corresponding to the plasmon frequency is absorbed. – The spectral locations, strengths, and number of plasmon resonances for a given particle depend on the particle’s shape and size.
  • 34. Optical Properties Optical absorption spectrum of 20- and 80-nm gold nanoparticles embedded in glass. [Adapted from F. Gonella et al., in Handbook of Nanostructured Material and Nanotechnology, H. S. Nalwa, ed., Academic Press, San Diego, 2000, Vol. 4, Chapter 2, p.85.] • Absorption spectra of spherical Au nanoparticles
  • 35. Martin, Olivier J.F. “Spectral response of plasmon resonant nanoparticles with non-regular shape”. Optics Express Col. 6. No. 11 May 2000 Surface Plasmons: Shape dependence of absorption spectra •The amount of light that is scattered into the far field is described by the scattering cross section (SCS). The SCS is plotted against the wavelength of light used to illuminate a particle from a specific angle. •The arrows indicate the illumination angle, and their colors correspond to the different plot lines. Optical Properties
  • 36. Optical Properties- SPR Martin, Olivier J.F. "Plasmons". Plasmons. 22 Mar. 2006. Ecole Polytechnique Fédérale de Lausanne. 26 Jan. 2003. Surface Plasmons: Shape dependence of absorption spectra. Resonant frequency of different shapes NPs are different.
  • 37. Optical Properties – Band Gap • Energy levels: from atoms to bulk materials… – The Pauli Exclusion Principle states that electrons can only exist in unique, discrete energy states. – In an atom the energy states couple together through spin-orbit interactions to form the energy levels . – When atoms are brought together in a bulk material, the energy states form nearly continuous bands of states, or in semiconductors and insulators, nearly continuous bands separated by an energy gap. N Energy Energy Atoms: Discrete Energy Levels Bulk Materials: Band Structures
  • 38. Optical Properties- Band gap • Energy levels – In semiconductors and insulators, the valance band corresponds to the ground states of the valance electrons. – In semiconductors and insulators, the conduction band corresponds to excited states where electrons are a free to move about in the material and participate in conduction. – In order for conduction to take place in a semiconductor, electrons must be excited out of the valance band, across the band gap into the conduction band. This process is called carrier generation. – Conduction takes place due to the empty states in the valence band (holes) and electrons in the conduction band. Ec Ev Electron excited into conduction band band gap
  • 39. Optical Properties- Band gap • Energy level spacing – In semiconductors and insulators a photon with an energy equal to the band gap energy is emitted when an electron in the conduction band recombines with a hole in the valance band. – The electronic band structure of a semiconductor dictates its optical properties. – GaP, a material commonly used for green LEDs, has an intrinsic band gap of 2.26 eV. Carrier recombination across the gap results in the emission of 550 nm light. Eg = 2.26 eV λ=550 nm
  • 40. Optical Properties- Band gap • Energy level spacing and quantum confinement – The reduction in the number of atoms in a material results in the confinement of normally delocalized energy states. – Electron-hole pairs become spatially confined when the dimensions of a nanoparticle approach the de Broglie wavelength of electrons in the conduction band. – As a result the spacing between energy bands of semiconductor or insulator is increased (Similar to the particle in a box scenario, of introductory quantum mechanics.) Energy Eg Eg Bulk Materials Nano Materials Increased band gap
  • 41. Band gap The band gap is increases with reducing the size of the particles Bandgap is the energy needed to promote an electron from the valence band to the conduction band In bulk materials, there are 1023 atoms on surface, large no. of atoms means large energy states, so band gap is less. As we go in nanorange, no. of atoms decrease to 10-1000 atoms, so energy states decrease, band gap is more.
  • 42. Optical Properties - Band gap • Energy level spacing and quantum confinement – As semiconductor particle size is reduced the band gap is increased. – Absorbance and luminescence spectra are blue shifted with decreasing particle size. CdSe quantum dots Jyoti K. Jaiswal and Sanford M. Simon. Potentials and pitfalls of fluorescent quantum dots for biological imaging. TRENDS in Cell Biology Vol.14 No.9 September 2004
  • 43. For semiconductors such as ZnO, CdS, and Si, the bandgap changes with size Optical Properties- Band gap
  • 45. Electrical and Electronic Properties • Effect of structure on conduction – If nanostructures have fewer defects, one would expect increased conductivity vs macroscale • Other electrical effects on the nanoscale: – Surface Scattering – Change in Electronic Structure – Ballistic Conduction – Discrete Charging – Tunneling Conduction – Microstructural Effects
  • 46. Surface Scattering • Electrons have a mean-free-path (MFP) in solid state materials. • MFP is the distance between scattering events as charge carriers move through the material. • In metals, the MFP is on the order of 10’s of nanometers. • If the dimensions of a nanostructure are smaller than the electron MFP, then surface scattering becomes a factor.
  • 47. Source of resistance: scattering Total resistivity, ρT , of a metal is a combination of the contribution of individual and independent scattering, known as Matthiessen’s rule: thermal resistivity defect resistivity Electron collisions with vibrating atoms (phonons) displaced from their equilibrium lattice positions are the source of the thermal or phonon contribution, which increases linearly with temperature. Impurity atoms, defects such as vacancies, and grain boundaries locally disrupt the periodic electric potential of the lattice and effectively cause electron scattering, which is temperature independent. Source
  • 48. Considering individual electrical resistivity directly proportional to the respective mean free path (λ) between collisions, the Matthiessen’s rule can be written as: Increase in crystal perfection or reduction of defects, which would result in a reduction in defect scattering and, thus, a reduction in resistivity. However, the defect scattering makes a minor contribution to the total electrical resistivity of metals at room temperature, and thus the reduction of defects has a very small influence on the electrical resistivity. Create an additional contribution to the total resistivity due to surface scattering, which plays a very important role in determining the total electrical resistivity of nanosized materials. If the mean free electron path, λS, due to the surface scattering is the smallest, then it will dominate the total electrical resistivity. In nano, the surface scattering of electrons results in reduction of electrical conductivity. + ρs Nano
  • 49.  Reduction in material’s dimensions will increase crystal perfection or reduction of defects, which would result in a reduction in defect scattering and, thus a reduction in resistivity and conductivity increases.  In nanowires and thin films, the surface scattering of electrons results in reduction of electrical conductivity. When the critical dimension is smaller than the mean free path, motion of electron will undergo elastic and inelastic scattering. Elastic scattering: electron reflects same way as photon reflects from mirror. Both momentum and energy is conserved. Direction of motion of electron is parallel to surface. Electrical conductivity is same as bulk materials. Inelastic scattering: In this electron mean free path is terminated by impinging on surface. The electron loses its kinetic energy and electrical conductivity decreases. Electrical and Electronic Properties Surface scattering:
  • 50. Electrical and Electronic Properties Change of Electronic Structure: Reduction in characteristic dimension below a critical size, i.e. below De Broglie wavelength results in change of electronic structure, leading to widening of band gap. Such a change results in reduced electrical conductivity. Some metal nanowires undergo transition to become semiconductors and semiconductors might become insulators when their diameters are reduced below a critical diameter.
  • 51. Bulk Nano Reduced dimension Conductor/semiconductor Insulator Increased Band-gap Electrical and Electronic Properties Change of Electronic Strucutre:
  • 52. Electrical and Electronic Properties Quantum Transport: It occurs when length of conductor is smaller than electron mean free path. In this case, each transverse waveguide mode or conducting channel contributes G0 = 2e2h = 12.9kΩ-1 In ballistic transport there is no energy dissipation and no elastic scattering takes place.  Ballistic conduction,  Coulomb blockade and  Tunnelling Ballistic conduction:
  • 53. Electrical and Electronic Properties It occurs when length of conductor is smaller than electron mean free path.  Ballistic conduction: L   2 1 1 h L R q M          2 1 h R q M  2 h L R q   L   Transport of a conductor Ohm’s law 𝑖 𝐿 << 𝜆𝑚 𝑖𝑖 𝐿 << 𝜆𝜙
  • 54. Coulomb Blockade & Single Electron Transistor
  • 55. Electrical and Electronic Properties  Coulomb Blockade & Single Electron Transistor: It occurs when length of contact resistance is larger than resistance of nanostructures and total capacitance of object is so small that adding a single electron requires significant energy. Metal or semiconductor nanocrystals exhibit quantum effects that give rise to discrete charging of metal particles. Coulomb Blockade can be observed by making the device very small, like quantum dot (i.e. 3D confinement). In this 3D confined state, electrons inside the QD will create a strong Coulomb repulsion preventing other to flow. This, the device will no longer follow Ohms law. It require too much Coulomb energy to add extra electron. This is called Coulomb blockade. G The Coulomb Energy Ec = e2/2C Electronic charge – e Total Capacitance - C
  • 57. Electrical and Electronic Properties  Tunelling: It involves charge transport through an insulating medium seperating two conductors that are closely spaced. This is because electron wave function from two conductors overlap inside insulator, when thickness is thin. As thickness of layer increases, electrical conductivity decreases
  • 59. Magnetic Properties due to the huge surface energy bulk materials nanostructured materials Magnetic properties are distinctly different superparamagnetism Ferromagnetism Ref: Prof A K Gsnguli slides
  • 60. Magnetic Properties I A Magnetic moment, (m or µ) = IA Origin of Magnetism Macroscopic Microscopic (charge current) (atomic scale) Magnetization (M) = m V Magnetic moment per unit volume Magnetic field strength (H) measure of the strength of the externally applied magnetic field. Magnetic moment (m or µ) is the measure of the strength of magnet can the ability to produce magnetic field. Magnetic induction / Magnetic flux density (B)  Magnetic flux per unit area. 0 ( ) B H M    Magnetic Susceptibility , M H   Gives physical idea about the magnetic material Energy of the magnetic moment (E) : E= - m.B
  • 61. Magnetic Properties Origin of Magnetism (atomic) Nuclear Spin Orbital motion of electrons Electron Spin (Small effect) electron nucleus m m Magnetic moment arising due to nucleus is very small compared to electron. or Am2 Electron Nucleus
  • 62. Magnetic Properties Spin Orbital motion Lattice weak In bulk, contribution of magnetic moment due to orbital motion of crystalline solid is small In Nano  orbital – lattice coupling decreases due to reduced surface energy magnetization increases Side reduced Fundamental component of magnetism Magnetism of atom Magnetism of Molecule Magnetism of solid Magnetism of hybrids
  • 64. Spin Orbital motion Lattice weak Contribution of magnetic moment due to orbital motion of crystalline solid is small in bulk In Nano  orbital – lattice coupling decreases due to reduced surface energy magnetization increases Side reduced Increase in Magnetization in nano
  • 65. Decrease in Magnetization in further Nano
  • 66.
  • 67.
  • 68. A Survey of Magnetic Nanoparticle Applications A method for early diagnosis of brain cancer under development uses magnetic nanoparticles and nuclear magnetic resonance (NMR) technology. The magnetic nanoparticles attach to particles in the blood stream called microvesicles which originate in brain cancer cells. NMR is then used to detect these microvesicle/magnetic nanoparticle clusters, allowing an early diagnosis. Iron oxide nanoparticles can be used to improve Magnetic Resonance Imaging (MRI) of cancer tumors. The nanoparticle is coated with a peptide that binds to a cancer tumor. Once the nanoparticles are attached to the tumor, the magnetic property of the iron oxide enhances the images from the MRI scan. Researchers at MIT have shown that iron oxide nanoparticles in water can be used to increase the amount of heat transfer out of a system at localized hot spots. The researchers believe this technique could be applied to cooling a wide range of devices, from electronics devices to fusion reactors. Magnetic nanoparticles can attach to cancer cells in the blood stream. These nanoparticles may allow doctors to remove cancer cells before they can establish new tumors. Using nanoscavengers, in which a layer of reactive nanoparticles coat a synthetic core which is designed to be easily magnetized. The nanoparticles, for example silver nanoparticles if bacteria is a problem, attach to or kill the pollutants. Then when a magnetic field is applied the nanoscavengers are removed from the water. Nanoparticles containing iron oxide that allows the nanoparticles to be directed, by a magnetic field, to stents. This could allow drugs to be delivered directly to stents placed in arteries. Iron oxide nanoparticles can used to improve MRI images of cancer tumors. The nanoparticle is coated with a peptide that binds to a cancer tumor, once the nanoparticles are attached to the tumor the magnetic property of the iron oxide enhances the images from the Magnetic Resonance Imagining scan.

Editor's Notes

  1. Upto now we are discussing about the techniques and methods how we may proceed in a systematic way with nanomaterials. Now, lets see what is the reason behind