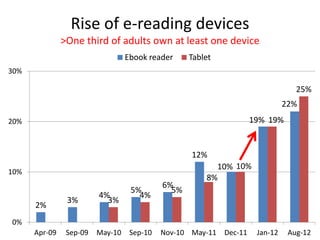
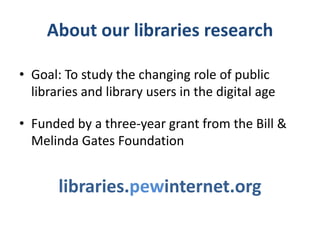
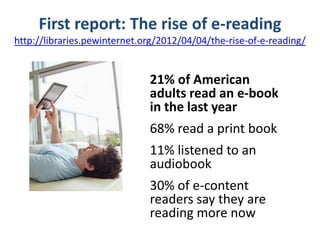
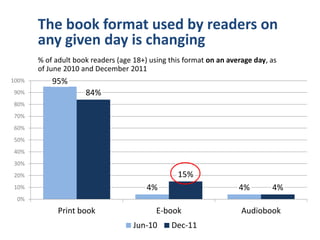
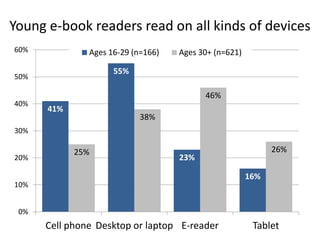
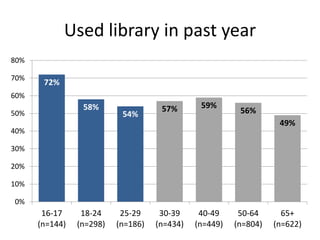
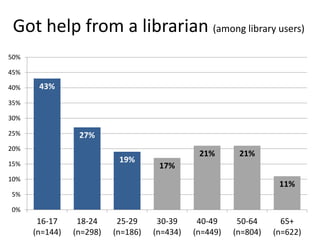
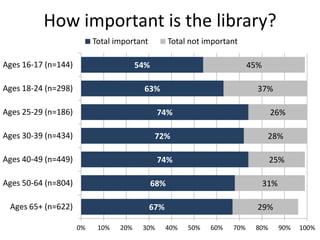
The changing world of libraries

                                            Lee Rainie
                                               Director
 Pew Research Center’s Internet & American Life Project


                        Presented to: SWON Libraries Consortium
                                            November 28, 2012
we need a tshirt, "I survived the
       keynote disaster of 09"
  “Tweckle (twek’ul) vt. To
abuse a speakerdon'tTwitter
  it's awesome in the "I to want to
turn away from the accident because I
 followers ain the audience
     might see severed head" way
while he/she is speaking.”
too bad they took my utensils away w/
  my plate. I could have jammed the
     butter knife into my temple.
                                        2
The traits of networked information

• Pervasively          • Linked
  generated            • Social currency
• Pervasively          • Multi-platformed
  consumed             • Real-time and
• Portable               timeless
• Personal             • More quickly
• Participatory          generated and
• Continually edited     delivered
Digital Revolution 1: Broadband
Internet (85%) and Broadband at home (66%)
Networked creators and curators (among internet users)
  • 69% are social networking site users
  • 59% share photos and videos
      • 46% creators; 41% curators
  •   37% contribute rankings and ratings
  •   33% create content tags
  •   30% share personal creations
  •   26% post comments on sites and blogs
  •   16% use Twitter
  •   14% are bloggers
  •   18% (of smartphone owners) share their locations;
      74% get location info and do location sharing
Revolution 2: Mobile – 89% of adults
  46% smartphones / 25% tablets

                                       321.7
        Total U.S.
        population:
        315.5 million


                                       2012
Apps > 50% of adults
50%
      % of cell owners who have                       43%
40%   downloaded apps                      38%

30%
                                  29%
                 22%
20%


10%


0%
          Sept 2009      May 2010       August 2011   April 2012
Digital Revolution 3
       Social networking – 59% of all adults
                            18-29    30-49   50-64    65+
100%
                                                      86%         87%    92%
               % of internet users
80%
                                             76%
                                     67%
                                                             68%           73%
60%
                                                     61%
                  49%                        48%                  49%     57%
40%
                                                            47%
                                     25%                          29%
                                             25%                         38%
20%                                                   26%
        9%         8%                11%
       7%             4%                     13%
          6%                         7%
 0%
        2005       2006
                       1%   2007      2008    2009    2010        2011   2012
Rise of e-reading devices
               >One third of adults own at least one device
                                  Ebook reader     Tablet
30%

                                                                                25%
                                                                             22%
20%                                                                19% 19%


                                                   12%
                                                         10% 10%
10%
                                                       8%
                                            6%
                                   5%         5%
                         4%          4%
                3%         3%
      2%
0%
      Apr-09    Sep-09   May-10    Sep-10   Nov-10 May-11 Dec-11    Jan-12    Aug-12
About our libraries research

• Goal: To study the changing role of public
  libraries and library users in the digital age

• Funded by a three-year grant from the Bill &
  Melinda Gates Foundation


       libraries.pewinternet.org
First report: The rise of e-reading
http://libraries.pewinternet.org/2012/04/04/the-rise-of-e-reading/


                              21% of American
                              adults read an e-book
                              in the last year
                              68% read a print book
                              11% listened to an
                              audiobook
                              30% of e-content
                              readers say they are
                              reading more now
The book format used by readers on
       any given day is changing
       % of adult book readers (age 18+) using this format on an average day, as
       of June 2010 and December 2011
100%       95%
90%                  84%
80%
70%
60%
50%
40%
30%
20%                                              15%
10%                                     4%                          4%        4%
 0%
             Print book                    E-book                    Audiobook
                                    Jun-10     Dec-11
Who are the readers behind the screens?

Readers of e-books are more likely
than other readers to be:
• Under age 50
• College educated
• Living in households earning $50K+

Other key characteristics:
• They read more books, more often,
and for a wider range of reasons
• More likely to buy than borrow
How e-readers read their e-books
      % of e-book readers who read an e-book in the past
      12 months on these devices
50%


40%
                              42%               41%

30%
           29%
20%                                                           23%

10%


0%
      On a cell phone    On a computer      On an e-book   On a tablet
                                               reader      computer
How device owners read their e-books
       % of owners of each device who read e-books on that device
100%

90%
                                                    93%
80%
                                                                    81%
70%

60%

50%

40%                             46%
30%

20%
             29%
10%

 0%
       On a cell phone*   On a desktop or      On an e-reader*   On a tablet*
                              laptop*
        * = among people who own that device
Which is better for these purposes, a printed
       book or an e-book?
       % of Americans 16+ who have read both e-books and print books in the last 12 months

                                       Printed books        E-books
100%


         81%                                                                                   83%
80%                                                                            73%
                          69%
60%                                                            53%
                                         43% 45%
40%                                                      35%
                                25%
                                                                         19%
20%                                                                                      13%
                9%
 0%
        Reading with a   Sharing books Reading books in Having a wide   Reading while Being able to get
            child         with other         bed         selection to    traveling or  a book quickly
                            people                      choose from      commuting
Reading pleasures by the number
• 26% of those who had read a book in the past 12 months said that
  what they enjoyed most was learning, gaining knowledge, and
  discovering information
• 15% cited the pleasures of escaping reality, becoming immersed in
  another world, enjoyment they got from using their imaginations.
• 12% said they liked the entertainment value of reading, the drama
  of good stories, the suspense of watching a good plot unfold.
• 12% said they enjoyed relaxing while reading and having quiet time.
• 6% liked the variety of topics
• 4% said they enjoy finding spiritual enrichment, expanding
  worldview
• 3% said they like being mentally challenged by books
• 2% cited the physical properties of books
Second report: E-book borrowing
http://libraries.pewinternet.org/2012/06/22/libraries-patrons-and-e-books/

                                   12% of e-book readers (4% of
                                   general pop.) have borrowed
                                   e-book from library in last
                                   year
                                   Non-borrowers are unaware
                                   they can borrow e-books!!!
                                   Non-borrowers are open to
                                   coaching/tech support
                                   Borrowers are buyers, too
62% of non-borrowers don’t know
     about e-borrowing option
• 58% of all library card holders do not know.
• 55% of all those who say the library is “very
  important” to them do not know.
• 53% of all tablet computer owners do not
  know.
• 48% of all owners of e-book reading devices
  do not know.
• 47% of all those who read an e-book in the
  past year do not know.
How is selection?
                     % of e-book borrowers


         Excellent          Very good        Good
         Fair               Poor             Don’t know


    16          18            32              23     4 8


0          20          40          60           80        100
Problems with borrowing process
                                    % of e-borrowers

                               Yes         No       Don’t know

    It was not compatible           18%                              80%                       3%
      with your e-reader

  There was a waiting list                      52%                          46%               3%


The library did not carry it                      56%                        39%              5%

                               0%    10%    20%    30%   40%   50%    60%   70%   80%   90%   100%
Open to library coaching/tech support
                                % of non-borrowers

       Very likely    Somewhat likely                Not too likely       Not at all likely

  Classes or instruction on how to         32%
 use handheld reading devices like        11         21        19               47
     e-readers & tablet computers

                                               32%
        Classes on how to download
library e-books to handheld devices       12         20        19               47


    E-book readers already loaded                46%
   with the book you want to read          18             28         15             37

                                      0    10        20   30   40   50    60   70    80   90   100
Where people get recommendations
                            Library card holder       No card
100%


80%      75%


60%
               51%

40%
                             38%
                                   28%              28%               28%
20%                                                       16%
                                                                            7%
 0%
       Family, friends,   Online bookstore/       Bookstore staff     A librarian/
         co-workers            website                              library website
Last book you read?
                     Library card holder     No card
60%

             50%
50%   47%

40%


30%
                             29%

                      20%                  20%
20%
                                                               14%
                                                        12%
10%
                                                 4%
0%
      Purchased it   Borrowed from     Borrowed from   Some other way
                      family/friend        library
Library card holders vs. fans
58% ages 16+ are card holders   65% ages 16+ say “important”

• Women                         • Women
• Whites                        • African-Americans
• Higher HH income              • Hispanics
• Higher educational            • Lower HH income
  attainment                    • Educ. attainment is
• Non-rural                       less predictive
• Parents of minors             • Non-rural
                                • Parents of minors
9 takeaways for librarians
        1. E-reading is taking off because e-
           reading gadgets are taking off
        2. The gadget doesn’t make the
           reader, but it may change the
           reader
        3. E-book readers are reading
           omnivores (and probably
           influencers)
        4. E-book readers are not platform
           snobs AND they like different
           platforms for different purposes
9 takeaways for librarians

        5. Library users are not always the
           same as library fans
        6. E-book borrowing has foothold –
           and whopping upside
        7. Library users are book buyers
        8. Library borrowing patterns are
           changing
        9. Collections are changing
Third report: Young readers
http://libraries.pewinternet.org/2012/10/23/younger-americans-reading-and-library-habits/

                                          83% of those ages 16-29 read
                                          book in past year
                                          40% of them are reading more
                                          in the age of digital content
                                          Read e-books on phones and
                                          computers more than e-book
                                          readers and tablets
                                          60% visited library in past year
                                          3 sub-cohorts – high schoolers,
                                          college age, early career
How many books Americans read
Among book readers, the mean and median number of
books each group read in the past 12 months, among all
Americans ages 16 and older
                          Mean number of
                                              Median
                            books read
                                             (midpoint)
                             (average)
All those 16 and older           17               8
Ages 16-17 (n=144)               18              10
Ages 18-24 (n=298)               17               7
Ages 25-29 (n=186)               17               6
Ages 30-39 (n=434)               14               6
Ages 40-49 (n=449)               15               6
Ages 50-64 (n=804)               18               8
Ages 65+ (n=622)                 23              12
Reading on a “typical day”                   (among   book readers)
60%

        57%
50%                                                                  53%
                            49%                             48%
40%
                  39%                 39%       38%
30%


20%


10%


0%
        16-17     18-24     25-29     30-39     40-49     50-64       65+
       (n=129)   (n=264)   (n=152)   (n=377)   (n=379)   (n=668)    (n=473)
Young readers are instrumental readers
                Ages 16-29 (n=628)    Ages 30+ (n=2,309)
90%

80%
      81%                     81%              79%         81%
70%                   76%               73%                       73%
60%

50%
             49%
40%

30%

20%

10%

0%
       Read for     Read for pleasure Read to keep up   Read to research
      work/school                      with current     topics of interest
                                          events
Young e-book readers read on all kinds of devices
60%            Ages 16-29 (n=166)   Ages 30+ (n=621)

                     55%
50%

                                          46%
40%
      41%
                            38%
30%

            25%                                              26%
20%                                 23%

                                                       16%
10%


 0%
      Cell phone Desktop or laptop E-reader             Tablet
Used library in past year
80%

70%
       72%
60%
                 58%                 57%       59%
50%                        54%                           56%
                                                                   49%
40%

30%

20%

10%

0%
       16-17     18-24     25-29     30-39     40-49     50-64      65+
      (n=144)   (n=298)   (n=186)   (n=434)   (n=449)   (n=804)   (n=622)
Got help from a librarian (among library users)
50%

45%

40%    43%
35%

30%

25%              27%
20%
                                               21%       21%
15%
                           19%
                                     17%
10%
                                                                   11%
5%

0%
       16-17     18-24     25-29     30-39     40-49     50-64      65+
      (n=144)   (n=298)   (n=186)   (n=434)   (n=449)   (n=804)   (n=622)
How important is the library?
                          Total important          Total not important

Ages 16-17 (n=144)                     54%                                45%

Ages 18-24 (n=298)                      63%                                 37%

Ages 25-29 (n=186)                            74%                                26%

Ages 30-39 (n=434)                           72%                                 28%

Ages 40-49 (n=449)                            74%                                25%

Ages 50-64 (n=804)                           68%                                31%

 Ages 65+ (n=622)                           67%                             29%

                     0%    10%   20%    30%       40%   50%   60%   70%    80%        90%   100%
Forthcoming: Library services


               National survey and focus
               groups with patrons and
                      librarians
               If you want to participate,
                      email me at:
               Lrainie@pewinternet.org
11 early insights
1. Meta-question among librarians: Should we
   try to be all things to all people or do a few
   things really well?
2. Libraries are widely appreciated for their
   meaning to their communities / more than
   personal value
  •   But makeovers are warranted – “elitist”
      “stressed” “behind desk ‘walls’”
3. Libraries still equal “books” to many patrons
  •   E-book situation is still an uncertainty and in flux
11 early insights
4. Many, many are unaware of the array of services
   libraries offer, including their website material
  •   … and they stress the need for better marketing
5. Parents of minor children have the strongest
   feelings and fondest memories AND hope for
   life-lessons for their kids
  •   “You never have to say no to your kids at a library”
6. Technology is as important a service as book
   lending
  •   Jobs applications and searches are big new feature
11 early insights
7. Libraries are being judged in comparison to
   other services and offerings in the world
  •   Genius bars, Amazon recommendations, personal
      shoppers
8. Amenities and atmosphere matter – segmenting
   spaces is appealing
9. People would really appreciate coordination
   with other local institutions
10.A surprisingly big chunk of Americans are totally
   disconnected from the library
Insight 11: You’re on your own
                  inventing the future


                            Robert Dawson photography - Library Road Trip
http://www.robertdawson.com/pages/1/Public%20Library%3a%20An%20American%20Commons/Public%20Library%3a%20An%20American%20Commons
                                                                 /
Thank you!
Lee Rainie
Email: lrainie@pewinternet.org
Twitter: @Lrainie

Kathryn Zickuhr
Email: kzickuhr@pewinternet.org
Twitter: @kzickuhr

Kristen Purcell
Email: @kpurcell@pewinternet.org
Twitter: @kristenpurcell

The changing world of libraries

  • 1.
    The changing worldof libraries Lee Rainie Director Pew Research Center’s Internet & American Life Project Presented to: SWON Libraries Consortium November 28, 2012
  • 2.
    we need atshirt, "I survived the keynote disaster of 09" “Tweckle (twek’ul) vt. To abuse a speakerdon'tTwitter it's awesome in the "I to want to turn away from the accident because I followers ain the audience might see severed head" way while he/she is speaking.” too bad they took my utensils away w/ my plate. I could have jammed the butter knife into my temple. 2
  • 3.
    The traits ofnetworked information • Pervasively • Linked generated • Social currency • Pervasively • Multi-platformed consumed • Real-time and • Portable timeless • Personal • More quickly • Participatory generated and • Continually edited delivered
  • 4.
    Digital Revolution 1:Broadband Internet (85%) and Broadband at home (66%)
  • 5.
    Networked creators andcurators (among internet users) • 69% are social networking site users • 59% share photos and videos • 46% creators; 41% curators • 37% contribute rankings and ratings • 33% create content tags • 30% share personal creations • 26% post comments on sites and blogs • 16% use Twitter • 14% are bloggers • 18% (of smartphone owners) share their locations; 74% get location info and do location sharing
  • 6.
    Revolution 2: Mobile– 89% of adults 46% smartphones / 25% tablets 321.7 Total U.S. population: 315.5 million 2012
  • 7.
    Apps > 50%of adults 50% % of cell owners who have 43% 40% downloaded apps 38% 30% 29% 22% 20% 10% 0% Sept 2009 May 2010 August 2011 April 2012
  • 8.
    Digital Revolution 3 Social networking – 59% of all adults 18-29 30-49 50-64 65+ 100% 86% 87% 92% % of internet users 80% 76% 67% 68% 73% 60% 61% 49% 48% 49% 57% 40% 47% 25% 29% 25% 38% 20% 26% 9% 8% 11% 7% 4% 13% 6% 7% 0% 2005 2006 1% 2007 2008 2009 2010 2011 2012
  • 9.
    Rise of e-readingdevices >One third of adults own at least one device Ebook reader Tablet 30% 25% 22% 20% 19% 19% 12% 10% 10% 10% 8% 6% 5% 5% 4% 4% 3% 3% 2% 0% Apr-09 Sep-09 May-10 Sep-10 Nov-10 May-11 Dec-11 Jan-12 Aug-12
  • 10.
    About our librariesresearch • Goal: To study the changing role of public libraries and library users in the digital age • Funded by a three-year grant from the Bill & Melinda Gates Foundation libraries.pewinternet.org
  • 11.
    First report: Therise of e-reading http://libraries.pewinternet.org/2012/04/04/the-rise-of-e-reading/ 21% of American adults read an e-book in the last year 68% read a print book 11% listened to an audiobook 30% of e-content readers say they are reading more now
  • 12.
    The book formatused by readers on any given day is changing % of adult book readers (age 18+) using this format on an average day, as of June 2010 and December 2011 100% 95% 90% 84% 80% 70% 60% 50% 40% 30% 20% 15% 10% 4% 4% 4% 0% Print book E-book Audiobook Jun-10 Dec-11
  • 13.
    Who are thereaders behind the screens? Readers of e-books are more likely than other readers to be: • Under age 50 • College educated • Living in households earning $50K+ Other key characteristics: • They read more books, more often, and for a wider range of reasons • More likely to buy than borrow
  • 14.
    How e-readers readtheir e-books % of e-book readers who read an e-book in the past 12 months on these devices 50% 40% 42% 41% 30% 29% 20% 23% 10% 0% On a cell phone On a computer On an e-book On a tablet reader computer
  • 15.
    How device ownersread their e-books % of owners of each device who read e-books on that device 100% 90% 93% 80% 81% 70% 60% 50% 40% 46% 30% 20% 29% 10% 0% On a cell phone* On a desktop or On an e-reader* On a tablet* laptop* * = among people who own that device
  • 16.
    Which is betterfor these purposes, a printed book or an e-book? % of Americans 16+ who have read both e-books and print books in the last 12 months Printed books E-books 100% 81% 83% 80% 73% 69% 60% 53% 43% 45% 40% 35% 25% 19% 20% 13% 9% 0% Reading with a Sharing books Reading books in Having a wide Reading while Being able to get child with other bed selection to traveling or a book quickly people choose from commuting
  • 18.
    Reading pleasures bythe number • 26% of those who had read a book in the past 12 months said that what they enjoyed most was learning, gaining knowledge, and discovering information • 15% cited the pleasures of escaping reality, becoming immersed in another world, enjoyment they got from using their imaginations. • 12% said they liked the entertainment value of reading, the drama of good stories, the suspense of watching a good plot unfold. • 12% said they enjoyed relaxing while reading and having quiet time. • 6% liked the variety of topics • 4% said they enjoy finding spiritual enrichment, expanding worldview • 3% said they like being mentally challenged by books • 2% cited the physical properties of books
  • 19.
    Second report: E-bookborrowing http://libraries.pewinternet.org/2012/06/22/libraries-patrons-and-e-books/ 12% of e-book readers (4% of general pop.) have borrowed e-book from library in last year Non-borrowers are unaware they can borrow e-books!!! Non-borrowers are open to coaching/tech support Borrowers are buyers, too
  • 20.
    62% of non-borrowersdon’t know about e-borrowing option • 58% of all library card holders do not know. • 55% of all those who say the library is “very important” to them do not know. • 53% of all tablet computer owners do not know. • 48% of all owners of e-book reading devices do not know. • 47% of all those who read an e-book in the past year do not know.
  • 21.
    How is selection? % of e-book borrowers Excellent Very good Good Fair Poor Don’t know 16 18 32 23 4 8 0 20 40 60 80 100
  • 22.
    Problems with borrowingprocess % of e-borrowers Yes No Don’t know It was not compatible 18% 80% 3% with your e-reader There was a waiting list 52% 46% 3% The library did not carry it 56% 39% 5% 0% 10% 20% 30% 40% 50% 60% 70% 80% 90% 100%
  • 23.
    Open to librarycoaching/tech support % of non-borrowers Very likely Somewhat likely Not too likely Not at all likely Classes or instruction on how to 32% use handheld reading devices like 11 21 19 47 e-readers & tablet computers 32% Classes on how to download library e-books to handheld devices 12 20 19 47 E-book readers already loaded 46% with the book you want to read 18 28 15 37 0 10 20 30 40 50 60 70 80 90 100
  • 24.
    Where people getrecommendations Library card holder No card 100% 80% 75% 60% 51% 40% 38% 28% 28% 28% 20% 16% 7% 0% Family, friends, Online bookstore/ Bookstore staff A librarian/ co-workers website library website
  • 25.
    Last book youread? Library card holder No card 60% 50% 50% 47% 40% 30% 29% 20% 20% 20% 14% 12% 10% 4% 0% Purchased it Borrowed from Borrowed from Some other way family/friend library
  • 26.
    Library card holdersvs. fans 58% ages 16+ are card holders 65% ages 16+ say “important” • Women • Women • Whites • African-Americans • Higher HH income • Hispanics • Higher educational • Lower HH income attainment • Educ. attainment is • Non-rural less predictive • Parents of minors • Non-rural • Parents of minors
  • 27.
    9 takeaways forlibrarians 1. E-reading is taking off because e- reading gadgets are taking off 2. The gadget doesn’t make the reader, but it may change the reader 3. E-book readers are reading omnivores (and probably influencers) 4. E-book readers are not platform snobs AND they like different platforms for different purposes
  • 28.
    9 takeaways forlibrarians 5. Library users are not always the same as library fans 6. E-book borrowing has foothold – and whopping upside 7. Library users are book buyers 8. Library borrowing patterns are changing 9. Collections are changing
  • 29.
    Third report: Youngreaders http://libraries.pewinternet.org/2012/10/23/younger-americans-reading-and-library-habits/ 83% of those ages 16-29 read book in past year 40% of them are reading more in the age of digital content Read e-books on phones and computers more than e-book readers and tablets 60% visited library in past year 3 sub-cohorts – high schoolers, college age, early career
  • 30.
    How many booksAmericans read Among book readers, the mean and median number of books each group read in the past 12 months, among all Americans ages 16 and older Mean number of Median books read (midpoint) (average) All those 16 and older 17 8 Ages 16-17 (n=144) 18 10 Ages 18-24 (n=298) 17 7 Ages 25-29 (n=186) 17 6 Ages 30-39 (n=434) 14 6 Ages 40-49 (n=449) 15 6 Ages 50-64 (n=804) 18 8 Ages 65+ (n=622) 23 12
  • 31.
    Reading on a“typical day” (among book readers) 60% 57% 50% 53% 49% 48% 40% 39% 39% 38% 30% 20% 10% 0% 16-17 18-24 25-29 30-39 40-49 50-64 65+ (n=129) (n=264) (n=152) (n=377) (n=379) (n=668) (n=473)
  • 32.
    Young readers areinstrumental readers Ages 16-29 (n=628) Ages 30+ (n=2,309) 90% 80% 81% 81% 79% 81% 70% 76% 73% 73% 60% 50% 49% 40% 30% 20% 10% 0% Read for Read for pleasure Read to keep up Read to research work/school with current topics of interest events
  • 33.
    Young e-book readersread on all kinds of devices 60% Ages 16-29 (n=166) Ages 30+ (n=621) 55% 50% 46% 40% 41% 38% 30% 25% 26% 20% 23% 16% 10% 0% Cell phone Desktop or laptop E-reader Tablet
  • 34.
    Used library inpast year 80% 70% 72% 60% 58% 57% 59% 50% 54% 56% 49% 40% 30% 20% 10% 0% 16-17 18-24 25-29 30-39 40-49 50-64 65+ (n=144) (n=298) (n=186) (n=434) (n=449) (n=804) (n=622)
  • 35.
    Got help froma librarian (among library users) 50% 45% 40% 43% 35% 30% 25% 27% 20% 21% 21% 15% 19% 17% 10% 11% 5% 0% 16-17 18-24 25-29 30-39 40-49 50-64 65+ (n=144) (n=298) (n=186) (n=434) (n=449) (n=804) (n=622)
  • 36.
    How important isthe library? Total important Total not important Ages 16-17 (n=144) 54% 45% Ages 18-24 (n=298) 63% 37% Ages 25-29 (n=186) 74% 26% Ages 30-39 (n=434) 72% 28% Ages 40-49 (n=449) 74% 25% Ages 50-64 (n=804) 68% 31% Ages 65+ (n=622) 67% 29% 0% 10% 20% 30% 40% 50% 60% 70% 80% 90% 100%
  • 37.
    Forthcoming: Library services National survey and focus groups with patrons and librarians If you want to participate, email me at: Lrainie@pewinternet.org
  • 38.
    11 early insights 1.Meta-question among librarians: Should we try to be all things to all people or do a few things really well? 2. Libraries are widely appreciated for their meaning to their communities / more than personal value • But makeovers are warranted – “elitist” “stressed” “behind desk ‘walls’” 3. Libraries still equal “books” to many patrons • E-book situation is still an uncertainty and in flux
  • 39.
    11 early insights 4.Many, many are unaware of the array of services libraries offer, including their website material • … and they stress the need for better marketing 5. Parents of minor children have the strongest feelings and fondest memories AND hope for life-lessons for their kids • “You never have to say no to your kids at a library” 6. Technology is as important a service as book lending • Jobs applications and searches are big new feature
  • 40.
    11 early insights 7.Libraries are being judged in comparison to other services and offerings in the world • Genius bars, Amazon recommendations, personal shoppers 8. Amenities and atmosphere matter – segmenting spaces is appealing 9. People would really appreciate coordination with other local institutions 10.A surprisingly big chunk of Americans are totally disconnected from the library
  • 41.
    Insight 11: You’reon your own inventing the future Robert Dawson photography - Library Road Trip http://www.robertdawson.com/pages/1/Public%20Library%3a%20An%20American%20Commons/Public%20Library%3a%20An%20American%20Commons /
  • 42.
    Thank you! Lee Rainie Email:lrainie@pewinternet.org Twitter: @Lrainie Kathryn Zickuhr Email: kzickuhr@pewinternet.org Twitter: @kzickuhr Kristen Purcell Email: @kpurcell@pewinternet.org Twitter: @kristenpurcell