Downloaded 13 times
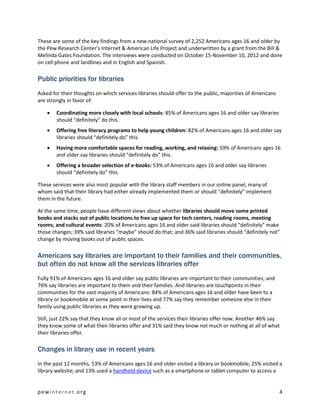
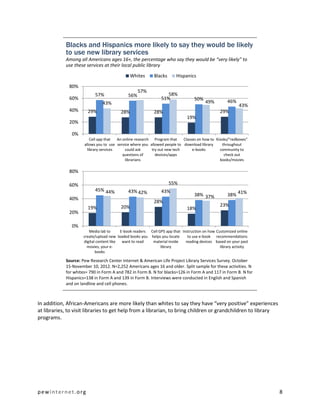

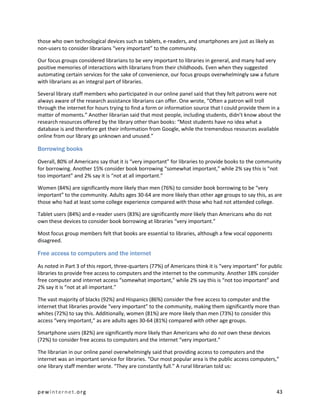
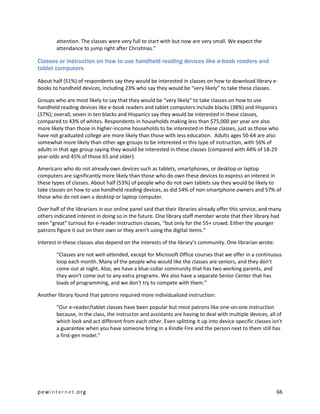
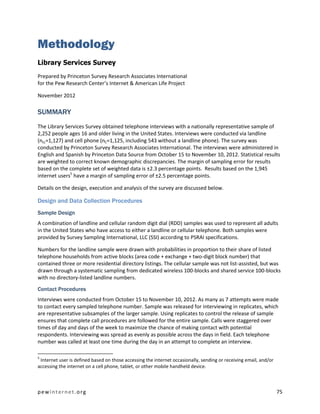
![Urbanity
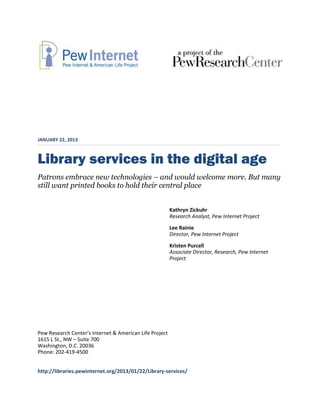
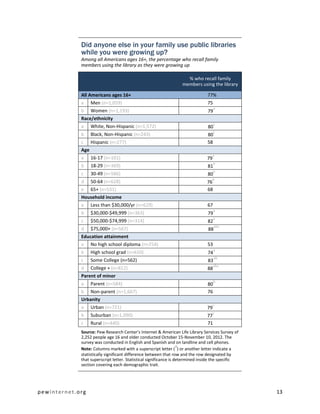
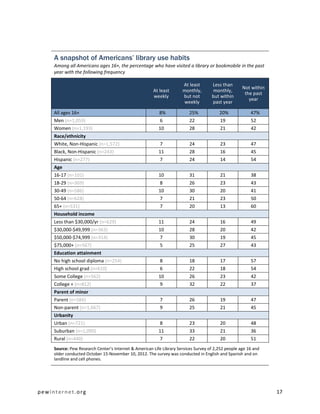
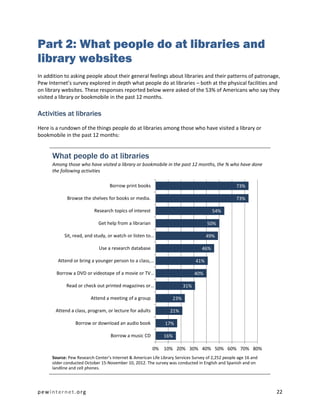
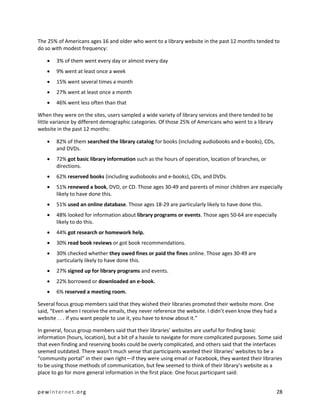
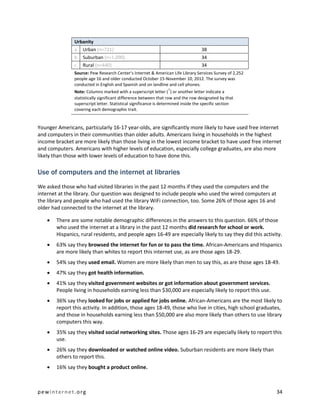
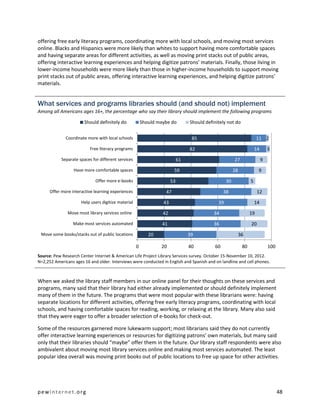
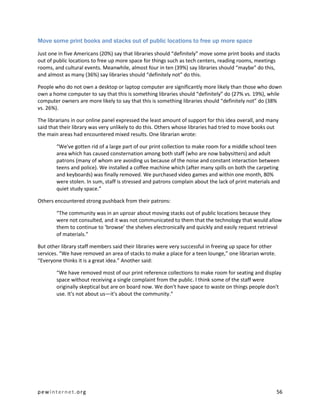
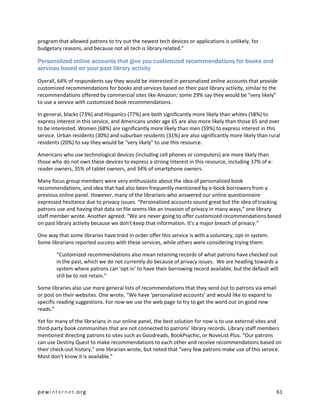
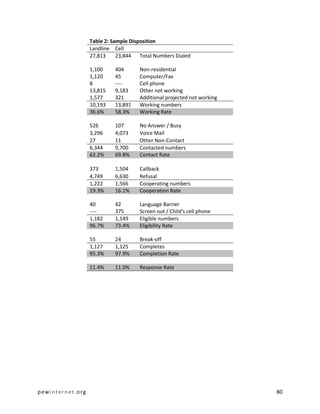
a Urban (n=721) 75 91
b Suburban (n=1,090) 77 91
c Rural (n=440) 73 89
Source: Pew Research Center’s Internet & American Life Library Services Survey of 2,252
people age 16 and older conducted October 15-November 10, 2012. The survey was
conducted in English and Spanish and on landline and cell phones.
a
Note: Columns marked with a superscript letter ( ) or another letter indicate a
statistically significant difference between that row and the row designated by that
superscript letter. Statistical significance is determined inside the specific section covering
each demographic trait.
In our focus groups, most participants said that they valued having libraries in their communities and
would miss them if they were gone, especially as many were still dealing with the effects of the
recession. One participant said, “I think our community would [miss our public library] because our
library is extremely well used. The online system came into it its own right about the time the economy
changed. Our library is extremely heavily used by people who five or six years ago might have been
buying books,” but now can’t afford to.
Even the focus group participants who didn’t use their local libraries much said that they would miss
them if they were gone. One said that she wanted to live in the sort of community that had a library,
even though she personally had not used it yet. Another said that while the loss of her local library
would probably not affect her personally, “I look at myself as a member of a community and so it would
deeply affect my community”—and therefore have an impact on her as well. Another said: “I prefer to
have libraries open to communities where people could not afford what I can afford.”
pewinternet.org 21](https://image.slidesharecdn.com/piplibraryservicesreport012213-130127081824-phpapp02/85/Pip-library-services-report_012213-21-320.jpg)
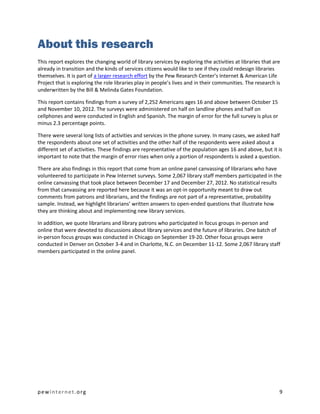
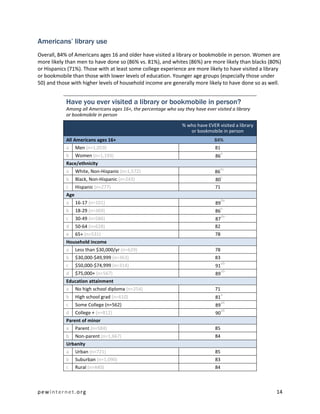
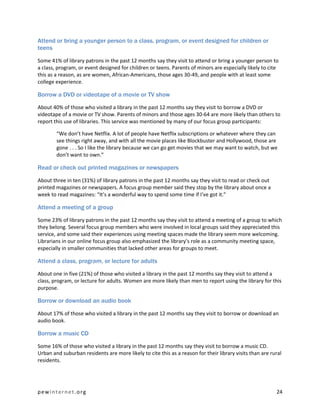
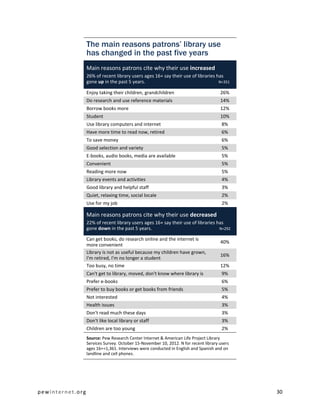
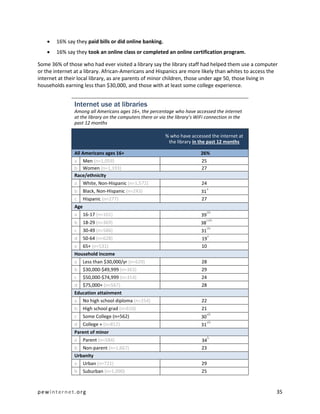
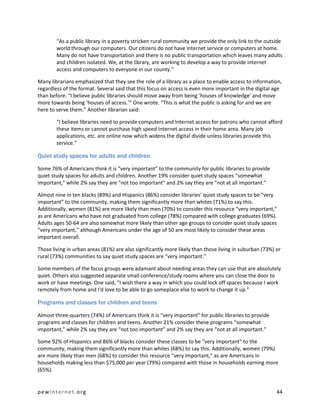
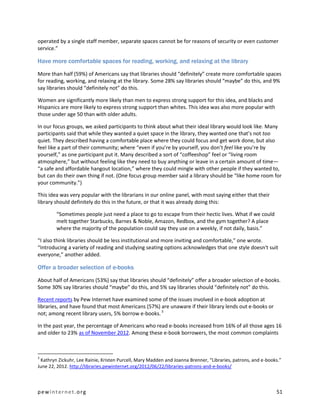
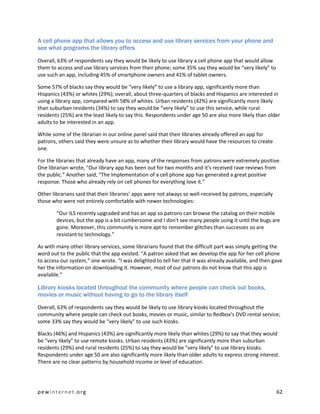
![Browse the shelves for books or media
Almost two-thirds (73%) of library patrons in the past 12 months say they visit to browse the shelves for
books or media. Women patrons are more likely than men to say they do this, as are parents of minor
children, and people with at least some college experience.
Many of our focus group members mentioned how they enjoyed browsing the shelves at their local
public library. One liked the process of discovery—“The cover can draw you in.” Even when they had
reserved materials online, several liked to browse for books, movies, or music.
Borrow print books
Almost two-thirds (73%) of library patrons in the past 12 months also say they visit to borrow print
books. Women are more likely than men to do this, as are parents of minor children and those with at
least some college experience.
Our focus group members mentioned borrowing books more than any other activity. Several said they
had recently started to borrow books more recently due to changes in economic circumstances, or when
they retired. Others said that they began to borrow books more as their tastes in books changed, or
when they simply ran out of space:
“As I got older, I bought more books and we moved a lot. As an adult, I moved a lot with our
profession and I carted probably a roomful of books . . . Finally, I said ‘enough’ and we started
going back to the library because we’re like this is—I don’t need to own all this anymore. So,
now it’s more of ‘Let’s see if they have it at the library first before we buy it’ [mentality].”
Research topics that interest them
Some 54% of those who visited a library in the past 12 months say they visit to research topics that
interest them.
Get help from a librarian
About half (50%) of those who have visited the library in the past year say they visit to get help from a
librarian. African-Americans are more likely than whites to say they visit to get help from a librarian, as
are those ages 50 and older and those who live in households earning less than $50,000. In addition,
some non-technology users are more likely to say they get help from librarians: That is true of those
who do not own tablet computers, those who do not own e-book readers, and those who do not own
smartphones.
Sit, read, and study, or watch or listen to media
Some 49% of those who visited a library in the past 12 months say they visit just to sit, read, and study,
or watch or listen to media. African-American and Latino patrons are more likely to say they do this than
whites. Those ages 18-29 are especially likely to cite this as a reason for their library visit in the past 12
months, as are urban residents and those living in households earning less than $50,000.
Use a research database
About 46% of those who visited a library in the past 12 months say they visit to use a research database.
pewinternet.org 23](https://image.slidesharecdn.com/piplibraryservicesreport012213-130127081824-phpapp02/85/Pip-library-services-report_012213-23-320.jpg)
![In our focus groups, many people reported having only positive impressions of libraries and librarians,
especially if they had positive experiences growing up. One focus group member said:
“When I was younger, there was one librarian in particular, she remembered my name and
every time I would come in with my mom I would take out stacks and stacks of books . . . I
started getting really into reading more because of her and she would [compliment] me about
how much I was reading, and it was like a challenge to me. How much can I read? How much
can I read in this week so I can come back the next week and get more books. So for me, it was a
very positive environment as a child.”
However, some participants, including some who mentioned that their libraries have experienced
cutbacks recently, said that library staff were very busy, and weren’t able to give them the individual
attention they remembered and valued from their childhood. One participant said that it seemed like
there were so many programs going on, the librarians could seem too busy to just help people find
books. At the same time, impressions and library experiences often varied in different areas even within
the same city.
A few focus group members said that they often feel intimidated when visiting some library branches.
These focus groups members said they weren’t very familiar with the Dewey Decimal system, which
made it hard to find what they were looking for even if they were told the call number or pointed in the
general direction; some said that library staff members they interacted with would become “frustrated”
with them for not understanding such a basic concept:
“I live by our library, close by, walking distance. I got intimated by trying to find the books. It
was like they say ‘it’s number-number-number and letter,’ like 100-EB or whatever it is. I’d be
like, ‘What?’ [Laughter] . . . Now I have more fun [reserving books] online and waiting for it to
show up and enjoying that. But when I went by myself . . . it was too [complicated].”
Use of library websites
In all, the Pew Internet Project survey finds that 39% of Americans ages 16 and older have gone to a
library website at one time or another and, of them, 64% visited a library site in the previous 12 months.
That translates into 25% of all Americans ages 16+ who visited a library website in the past year.
Those who are most likely to have visited library websites are parents of minors, women, those with
college educations, those under age 50, and people living in households earning $75,000 or more.
pewinternet.org 26](https://image.slidesharecdn.com/piplibraryservicesreport012213-130127081824-phpapp02/85/Pip-library-services-report_012213-26-320.jpg)
![“I look up like free kids’ events and there’s this website … that sometimes has like free
admission for kids—or if it’s seasonal I’ll literally type in ‘free pumpkin patches for kids’ [in a
search engine] so I can take them to a pumpkin patch or something like that. But I wouldn’t
have even thought to [search for] ‘library free event for kids’. I wouldn’t have even thought that
the library would be a resource at all.”
Changes in library use in recent years
The rise of the internet – especially broadband connections – and the spread of mobile connectivity
could potentially affect people’s use of their libraries. The Pew Internet survey asked recent library users
about their use of libraries over the last five years. Recent library users are those who those who visited
a public library in person in the past 12 months, or those who have gone on a public library website in
the past 12 months, or those who have used a cell phone, e-reader or tablet to visit a public library
website or access public library resources in the past 12 months. They amount to 59% of those who are
ages 16 and older in the general population.
The results showed there is fluidity in library patronage patterns:
26% of recent library users say their own use of local libraries has increased in the past five
years.
22% say their use has decreased.
52% say their use has stayed the same during that time period.
There are some demographic patterns to patronage changes: When it comes to those who have
increased their use of libraries parents of minors are more likely than non-parents to say their library
use has increased (30% vs. 23%), those with at least some college experience are more likely than those
with high school diplomas to say their use has gone up (29% vs. 19%), and suburban residents (28%) are
more likely than rural residents (20%) to report increased library use.
Those who say their library use has declined in the past five years are more likely to be non-parents
(25%) than parents (17%) and those who are in the 18-29 age bracket (32%), compared to others who
are younger or older. Rural residents (61%) and those ages 65 and older (60%) are particularly likely to
say their library use has not changed in the past five years.
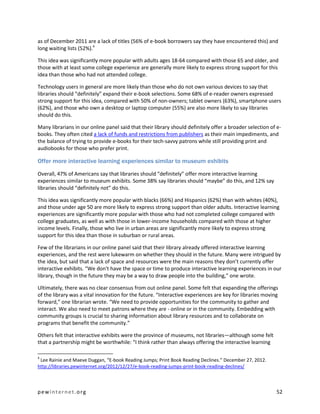
The following table shows the reasons people gave when we asked why their library use had increased
or decreased:
pewinternet.org 29](https://image.slidesharecdn.com/piplibraryservicesreport012213-130127081824-phpapp02/85/Pip-library-services-report_012213-29-320.jpg)
![Many of these reasons were echoed by both the members of our in-person focus groups, many of whom
mentioned some common patterns they’ve noticed in their own library use. Many patrons discussed
how they had used the library frequently as children, but then visited public libraries less often in middle
and high school. Their library use would pick up again for academic reasons in college, but not for
pleasure reading. Many people said they “rediscovered” the library when they became parents, and
again when they retired. They also cited changing habits as individual circumstances changed, such as
the loss of a job or income (job searches, learning new skills).
A few focus group also said that discovering a new library service, such as e-book borrowing, would
rekindle their interest in the library—and lead to an increase in use of other services. Some simply
wished for more programs for single adults. One said that it seemed like all the programs at their library
were “either for the senior citizens or for the really young children, like puppet shows [and] magic
shows. There’s no really in between for those teenagers, young adults, adults.”
Another thread in our focus group discussions was library hours. Several said that budget cutbacks had
led their local libraries to scale back their hours, to the point that it was difficult to find time to stop by—
especially when libraries didn’t have hours in the evenings or on weekends. “It’s not open much at all,”
one said. “I mean a few hours a day and you can’t do a whole lot in that small amount of time.” Others
said that their library’s schedule changed so often that they had trouble remembering when it would be
open—and eventually stopped going at all.
Technology users and library use
As we noted earlier in this report, technology owners are somewhat more attached to their libraries
than non-users. Internet users, tablet users, and smartphone users are more likely to have ever gone to
libraries and more likely to have library cards. However, they are no more likely than non-owners to
have visited a library or bookmobile in the past 12 months.
Asked to assess their library use over the past five years, recent library users who are home internet
users, tablet users and smartphone owners are somewhat more likely than non-users to say their use
has declined. And they are especially likely to say that the reason for their diminished use stems from
the fact they can do research online.
pewinternet.org 31](https://image.slidesharecdn.com/piplibraryservicesreport012213-130127081824-phpapp02/85/Pip-library-services-report_012213-31-320.jpg)
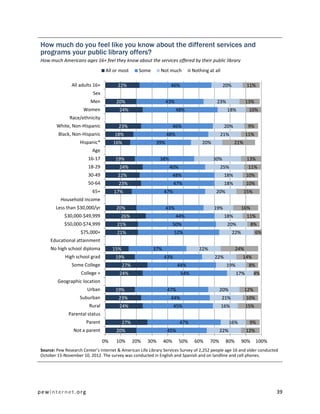
![Part 4: What people want from their
libraries
In addition to asking people how they use their local public libraries, we also asked them about how
much they felt they know about the different services and programs their library offers. We also
examined how important Americans feel various library services are to their communities, and explored
what sort of activities and resources people might be interested in using at libraries in the future.
How much people know about what their library offers
In general, Americans feel somewhat well-informed about the various services offered by their local
libraries. While about one in five (22%) feel they are aware of “all or most” of the services and programs
their public library offers, a plurality (46%) feel they just know of “some” of what their library offers.
Another 20% say they know “not much” about services offered by their library, and 11% say they know
“nothing at all” about what is available at their library.
Whites (23%) are more likely than Hispanics (16%) to say they know “all or some” of what their library
offers, while Hispanics are more likely to say that they know “nothing at all”—21% say this, more than
twice the rate among whites (9%) or blacks (11%). Women are also more likely to consider themselves
well-informed of library services than men, and those with higher levels of education are more likely to
say they’re aware of at least some services than those with less education. Respondents under the age
of 30 are also less likely to say they know much about library services than older adults, particularly
those ages 30-64.
One aspect mentioned very often, both in focus groups and in qualitative work from previous research,
is that people wish they were more aware of the full range of services offered by their libraries. One
focus group member loved her local library and rated it highly in all areas—except communication;
“there’s so much good stuff going on but no one tells anybody.” Another said, “they do so many
fabulous things, [but] they have horrible marketing.”
However, focus group members say that having resources and events listed on their library’s website
wasn’t enough—as several participants pointed out, they probably weren’t going to go to the website to
look for events (or even to sign up for email newsletters) unless they already knew that the library had
those events. Instead, they said they usually stumbled across listings either at their library in-person,
when trying to do something else online, or by seeing signage outside the library as they were driving
past. One parent loved their library and described it as “unbelievable,” but said that she only heard
about events when they were already in the library with their children, on their way to participate in
another activity or event. This parent said that they often weren’t even aware of events until she heard
the announcement that the event was about to start, when it was too late for her family to change
plans.
Many of the librarians in our in-person focus groups agreed that it was difficult to reach patrons and tell
them about all the services the library offered. Several said that almost every day, they will be speaking
with a patron who had come in for a specific service, and would mention other services or resources and
hear the patron reply, “I didn’t know that was available.”
pewinternet.org 38](https://image.slidesharecdn.com/piplibraryservicesreport012213-130127081824-phpapp02/85/Pip-library-services-report_012213-38-320.jpg)
![income households are also generally more likely to say these resources are “very important.”
Additionally, Americans under the age of 65 are most likely to consider these resources important
overall compared with those ages 65 and older.
Those living in urban areas (71%) are also significantly more likely than those living in suburban areas
(64%) to say employment-related resources are “very important.” Finally, people who have computers,
tablets, or smartphones are less likely than those who do not own these devices to consider job
resources at libraries to be “very important.”
In our focus groups, awareness and use of career-related resources seems to vary widely by library, as
well as by city. A few focus group members said that they relied heavily on these services in their job
searches; other focus group members weren’t aware of these services at all.
Library staff members in our online panel often emphasized the importance of employment-related
resources, especially for patrons who are less comfortable with technology or lack resources at home.
“There are large parts of this community that have less than 20% of the population with computers at
home. We have job seekers that leave the library phone as their contact,” one librarian wrote. Another
said: “Many of our town residents/patrons have no internet access and, some who do, are still using a
dial-up network. Offering internet access for e-mail, job searching, and personal research are a vital
component to the services we provide.”
Many librarians said they felt that offering computers and other resources for job-seekers was
increasingly important as technology became more vital to the job search process. “Libraries need to be
able to meet the needs of the patron,” one librarian wrote, and “[in] this day and age the patron needs
have become more focused on technology. This means that they may not have the ability to acquire the
knowledge needed to apply for a job, write a résumé, use a computer, use applications on a computer
or just use a device that they might need to help them in different areas of their life.”
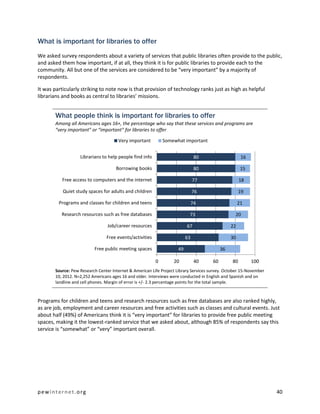
Free events and activities, such as classes and cultural events, for people of all ages
Over six in ten Americans (63%) say it is “very important” for public libraries to provide free events and
activities, such as classes and cultural events, for people of all ages. Three in ten (30%) consider these
activities “somewhat important,” while 4% say they are “not too important” and 2% say they are “not at
all important.”
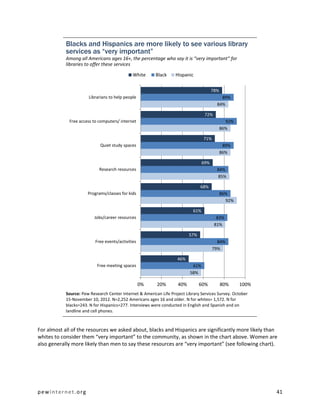
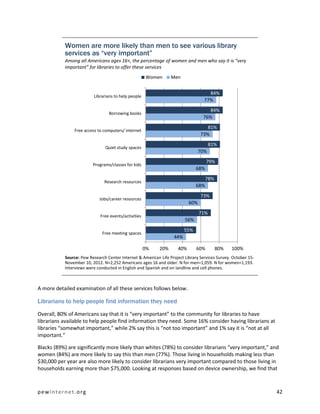
Some 84% of blacks and 79% of Hispanics consider these events to be “very important” to the
community, compared with 57% of whites. Women (71%) are also more likely than men (56%) to say
this, as are those who had not completed college (67%) compared with college graduates (53%). Those
living in lower-income households are also somewhat more likely to consider these activities important
compared with those in higher-income households. Americans living in urban areas (71%) are also
significantly more likely than those living in suburban areas (59%) to say research resources are “very
important.”
Members of our focus groups appreciated the free activities offered by their local libraries—when they
were aware of them. One participant valued these activities as “something that will bring you out of
your house and meet your neighbors and say, ‘Hi.’” The main issue many of them cited was simply
finding out about these activities in the first place. Many focus group members mentioned stumbling
across a list of activities as their library only by accident, when they were on the website for another
purpose.
pewinternet.org 46](https://image.slidesharecdn.com/piplibraryservicesreport012213-130127081824-phpapp02/85/Pip-library-services-report_012213-46-320.jpg)
![The following subsections explore librarians’ responses in further detail, but many described the various
factors they take into account when thinking about what services they should offer, such as the specific
needs of the communities they serve, budgets and staff time, and staff members’ experience with new
technologies. While each response was unique, the following quote from a library staff member touches
on many of the issues that librarians said they consider:
“We attempt to meet the needs of our community. Due to the fact that the needs of the
community are very diverse, our services are also diverse. We have made room for many
activities at the library such as tutoring, meetings, family gatherings such as wedding showers,
study space or just a space to hang out. We have also become mindful of different learning
styles and now offer hands-on learners interactive exhibits and developmentally disabled
individuals a special needs storytime. We offer equipment to help with digitizing materials but
do not have enough staff to help everyone with their project, although when time allows we do
often get pulled into the process and help to get people started. … Print books are still very
popular with older patrons and those who are financially challenged. Electronic materials are
certainly a great addition to our collection but, because not everyone has internet access at
home or can afford to buy an e-reader or tablet computer, we cannot abandon the print
materials. Again, we serve a diverse community.”
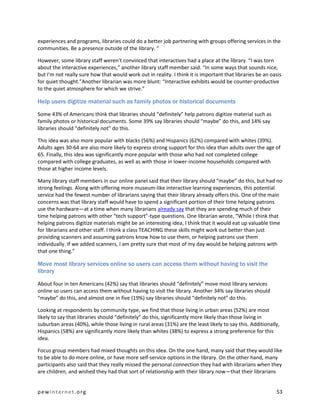
Here is a more detailed analysis of the different services different groups would like to see implemented
at libraries.
Coordinate more closely with local schools in providing resources to kids
Overall, 85% of respondents say that libraries should “definitely” coordinate more closely with local
schools in providing resources to kids. Some 11% say libraries should “maybe” do this, and 2% say
libraries should “definitely not” do this.
Americans ages 16-64 are significantly more likely than older adults to express strong support for this
idea, as are those who live in urban or suburban areas compared with those living in rural areas.
Focus group members were very much in support of this idea. Many said that they would love to see
libraries offer resources such as homework help and tutoring, as well as afterschool study programs.
Some participants said that they wished their library had enough copies of the books assigned to their
children as readings in class, especially when the school library only has a few copies that are quickly
checked out.
Most of the librarians in our online panel either said that their library was already doing this, or should
definitely do this in the future. “I think libraries should work very closely with area schools in an effort to
enable kids to successfully complete their homework and research projects,” a library staff member
wrote. “I am aware that some libraries already have collaborative relationships established with their
school districts. I would very much like to do that with my local school district.”
However, many said that doing so was often complicated, as one librarian pointed out: “Coordinating
with schools is a two-way street that takes time and persistence to build.” Another wrote:
“Although we should definitely work more closely with our public schools, it's virtually
impossible as their jammed schedules leave almost no time for outside agencies to work in the
schools. I think our niche is the early literacy market from birth to Kindergarten—whether it's
working with individual families, daycares, or preschools. One branch [in our system] has been
pewinternet.org 49](https://image.slidesharecdn.com/piplibraryservicesreport012213-130127081824-phpapp02/85/Pip-library-services-report_012213-49-320.jpg)
![most successful by taking storytimes to daycares and working with the youngest populations.
The result has been that the older children now come to storytime at the library as they can
walk to and from the event.”
Offer free early literacy programs to help young children prepare for school
Another popular service was free early literacy programs to help young children prepare for school,
which 82% of respondents say that libraries should “definitely” offer. Another 14% say libraries should
“maybe” do this, and 3% say libraries should “definitely not” do this.
Adults ages 65 and older are significantly less likely than younger Americans to say that libraries should
“definitely” do this, with 69% of this oldest age group expressing strong support (compared with more
than eight in ten younger respondents). Those who had not completed high school are also generally
more likely to express strong support for this idea. Finally, those who live in urban areas are significantly
more likely to say that libraries should “definitely” do this than those in suburban or rural areas.
Many librarians in our online panel said that their libraries already offer early literacy programs and
considered them a core part of their library’s mission. “Libraries have been, and always been, important
to childhood literacy/education,” one wrote, adding that “they need to expand traditional storytimes to
incorporate interactive learning experiences, virtual experiences for kids and teens.”
However, the librarians whose libraries who do not currently offer early literacy programs were
sometimes unsure as to whether this was a service they should clearly offer. “Although I think libraries
should work with schools and early literacy programs, I think there should be specially trained
individuals in those roles,” another library staff member wrote.
Have completely separate locations or spaces for different services
A majority (61%) of Americans say that libraries should “definitely” have completely separate locations
or spaces for different services, such as children’s services, computer labs, reading spaces, and meeting
rooms. Some 27% say libraries should “maybe” do this, and 9% say libraries should “definitely not” do
this.
There are few differences between different demographic groups in support for this idea, although
blacks and Hispanics are more likely to express strong support for this idea than whites.
A common sentiment in the focus groups was the need to keep children’s areas, teen hangout spaces,
and computer-centric areas separate from the main reading or lounge areas, to keep noise levels and
other distractions down to a minimum. Many librarians in our online panel agreed, “When possible I
think that it works well to keep the computer, group meeting, and children's area noise away from the
quieter reading areas,” one said. “Staff and [patrons] both seem to appreciate this.”
Others have seen drastic changes: “We moved our teen library away from our adult patrons and it has
made a world of difference. The teens behavior has gotten so much better we no longer need a security
guard at the library.”
Many of the library staff members in our online panel said that their libraries already have separate
locations for different services, although those who do not currently offer it were split on whether their
library should definitely do this or should only “maybe” do this. Those who said their library was less
likely to do this often cited issues of space, or funding; one pointed out that “in small libraries, often
pewinternet.org 50](https://image.slidesharecdn.com/piplibraryservicesreport012213-130127081824-phpapp02/85/Pip-library-services-report_012213-50-320.jpg)
![knew them well enough to recommend books, library services, or other resources to them, based on
their interests and family needs. One focus group member said that she “always” asks her librarians for
book recommendations:
[My daughter’s] really into pirates right now or whatever … I don’t have time to look around. I
got two screaming kids. [Laughter] [I say] “Help me find something quick” and they can always
think of something.
Another focus groups member said that she found it easier to reserve books online because she has
difficulty finding them in the library otherwise: “I just go online and I reserve [the book] and then I just
pick it up. If I have to go inside and do the Dewey Decimal System or whatever, the card numbers—it’s
so frustrating.”
Overall, some focus group participants saw the library as a destination (a place to take the family for an
afternoon, for instance), and others see it as a resource (a place to get books and other items). Others
said that their library used changed throughout the year, or at different points in their lives—they might
like to spend hours there in the summer, when the kids are out of school, but may be busier during the
school year and only able to stop by to pick up and drop off books.
These thoughts were echoed by members of our librarian panel, who were generally ambivalent about
the prospect of moving most library services online. “I do not think it is critical to move everything
online,” one said. “Most people come to the library because they want to be in the physical location.
They may access some things online. But many of our patrons enjoy the experience of coming to the
library for programs and social interaction.”
Another librarian pointed out that “moving most services online would not serve people who 1) do not
have easy access to a computer or the Internet, 2) need assistance using particular services, 3) like to
interact with library staff on a regular basis. We are not just service centers, we are also community
centers.”
Make most services automated
About four in ten Americans (41%) say that libraries should “definitely” make most services automated,
so people can find what they need and check out material on their own without help from staff. Some
36% say libraries should “maybe” do this, and one in five (20%) say libraries should “definitely not” do
this. Those with no family/childhood library experience are significantly more likely to say that libraries
should definitely do this (51% vs. 37%).
Again, many of the members of our online librarian panel did not generally view automating most
services as a useful path. One library staff member wrote:
“We have discussed automated check out with our patrons, and they have a fierce dislike of the
idea. Not because they fear technology—they are very literate and up to date on all things
electronic—but because they cherish the interaction with a real live person at the desk and they
love being greeted by name. One patron said ‘I am so tired of being anonymous everywhere
else... here I feel welcome and wanted every time I come in the door.’ We don't want to lose
that personal connection with our patrons!”
“Automated services means worse services,” another librarian wrote, and echoed the issues cited by
members of our in-person patron focus groups: “If we are not there to chat as books get checked in or
pewinternet.org 54](https://image.slidesharecdn.com/piplibraryservicesreport012213-130127081824-phpapp02/85/Pip-library-services-report_012213-54-320.jpg)
![out, we miss an opportunity to give patrons information they might not know, to recommend books
(etc.) based on what they are reading, to answer questions as they naturally arise during conversation.”
Yet while few (if any) of the librarians felt that most services should be automated, some staff members
whose libraries had already implemented some automated services found that they served as a useful
option for busier patrons. One noted that families with small children in particular appreciated of the
self-checkout option: “The children feel a sense of accomplishment when they do their own books
through the scanner. Older patrons, however, like the personal service provided at the circulation desk
by our clerks.”
Some librarians noted that for patrons, it was often a matter of preference. “It's important to have both
[self check-out and staff assistance], providing people service at the level they choose,” one wrote.
Another librarian felt that more resistance had some from the staff than patrons:
“We offer self-checkout and an automated payment center. People (like me) who prefer to
pump their own gas love the self-service kiosks. Even though I explained to staff that self-
checkout is primarily a privacy option for users, and that no staff cuts are planned, some are
reluctant to encourage use of the kiosks, even when people are lined up waiting for service.”
Others found that while self-service options can be helpful, automated systems can bring their own
headaches:
“Our library has self checkout machines at each location and the staff and public have a love-
hate relationship with them for a variety of reasons (e.g. they break down, problems with
patron's cards send them to the circulation desk, etc.). We encourage their use and there are
still lines at the checkout desks.”
Ultimately, this issue seems to depend heavily on the wants and needs of the library’s community, as
another librarian discussed:
“Our community is heavily weighted toward retirees who are struggling with the new
technologies. Over 50% of our children in our schools qualify for free and reduced lunch, so
assuming that they have access to the Internet at home is not a good idea. We would be doing a
great disservice to our library users if we fully automated or provided most of our materials
online. As our digital natives age then it would make sense to provide services in formats that
are usable by them.”
The main goal that many librarians in our online panel expressed is simply to balance the needs of busy
patrons with the personal connection they want from their library:
“We have added self-check stations, and the patrons love them. We offer remote access to
some materials, and both staff and patrons love the convenience. We are in the process of
launching a major e-books collection, and the patrons are clamoring for it. That said, we find
that patrons continue to see our library as destination, and they seek out our staff because of
the service we offer and deliver. They tell us that themselves, and the traffic in our library
confirms it.”
pewinternet.org 55](https://image.slidesharecdn.com/piplibraryservicesreport012213-130127081824-phpapp02/85/Pip-library-services-report_012213-55-320.jpg)
![with e-books or research, we set them up with a librarian with good skills in that area for up to
an hour. They really get their questions answered that way. “
However, others had more mixed experiences. “We used to participate in an 24/7 [online research]
program,” one librarian wrote. “At first it was at no charge to us, then we were charged a relatively high
fee, and then we dropped out. Very few of our patrons were taking advantage of it—not a good use of
our scarce funds.” Another librarian also had less-than-positive experiences with the service: “It seemed
to be used more by pranksters, than patrons, mundane questions such as library hours, late fees,
information readily available on our webpage. It's been discontinued.”
For other libraries, it was simply a matter of staff time: “The online research with live librarians seems
unlikely for our system because I don't think we have the staff and availability to guarantee that a
librarian would always be available at a station to immediately respond to online live queries.”
A program that allowed people to try out the newest tech devices or applications
Overall, 69% of respondents say they would be interested in a “technology petting zoo” program that
allowed people to try out the newest tech devices or applications; some 35% say they would be “very
likely” to use such a service.
Over half of blacks (51%) and Hispanics (58%) expressed a strong interest in this resource, compared
with 28% of whites. Urban residents (39%) are more likely than rural (29%) residents to express a strong
interest in this service. Americans under age 65 are also more likely than those 65 and older to say they
would be likely to use such a resource.
Perhaps unsurprisingly, Americans who already own gadgets such as tablets and smartphones are
significantly more likely than those who do not own these devices to indicate a strong interest in this
service. Some 41% of tablet owners say they would be “very likely” to use this service (vs. 33% of non-
owners), as did 39% of smartphone owners (vs. 32% of non-owners).
Many of the librarians in our online panel said that their libraries already offered opportunities for
patrons to try out new devices, and that the try-out programs had been well-received overall. “We have
held "petting zoos" for new technology, particularly for e-readers and tablets,” one wrote. “They are
well-attended but it is a struggle to keep up with the absolute latest offerings.” Another said:
“Staff and patrons were grateful for ‘petting zoo’ programs with e-readers and tablets. It helped
patrons decide which device, if any, they wanted to purchase. Both patrons and staff were
grateful to handle the devices our patrons use, so we can be more helpful when patrons ask
about them.”
Another librarian said that the program was popular, but the devices would soon be out-of-date: “It's
expensive to stay up with all of the new gadgets, so I see us transitioning this program—perhaps to
more of a crowdsourced technology petting zoo where community members are invited to bring in their
devices and share with each other.”
Many of the librarians who said their libraries did not offer this service were not sure that they would be
able to offer it in the near future. “It would be great to offer a ‘petting zoo’ for new devices or apps, but
small rural branch libraries do not have the staffing to make it work,” one librarian said. Another library
staff member said that a tech try-out program would not be a prudent use of the library’s funds: “A
pewinternet.org 60](https://image.slidesharecdn.com/piplibraryservicesreport012213-130127081824-phpapp02/85/Pip-library-services-report_012213-60-320.jpg)
![Though just 18% of whites expressed a strong interest in a digital media lab, 45% of blacks and 44% of
Hispanics say they would be “very likely” to use one. Additionally, about a third (32%) of adults 65 and
older say they would be likely to use such a lab overall, compared with over half of younger
respondents. Finally, urban residents (65%) are more likely than suburban (57%) and rural (48%)
residents to express an interest in this service overall.
Both Americans who do not have a computer and Americans who do own a tablet expressed particularly
strong interest in this resource. Almost a third (32%) of people who do not own a desktop or laptop
computer say they would be “very likely” to use a digital media lab, compared with 24% of those who do
own a computer, and 33% of tablet users say they would be very likely to use it, compared with 24% of
non-tablet owners.
The librarians in our online panel expressed some interest in this idea, but not a strong interest; few said
that their libraries already offer this. Some mentioned staff time, technology resources, budget
concerns, and space as primary factors. Others mentioned liability issues related to user-created
content. One library staff member wrote:
“Regarding the digital media lab, this is another great idea, but I see a number of barriers to us
implementing such a thing at this point. Space is a huge one, but staff knowledge and money are
also significant. We are exploring being part of a grant program on creating e-books, so that's
something we may offer some classes on, at least.”
Classes on how to download library e-books to handheld devices
Overall, 57% of respondents say they would be interested in classes on how to download library e-books
to handheld devices; some 28% say they would be “very likely” to take this type of class, including 34%
of e-reader owners. Overall, 63% of e-reader owners and 58% of tablet owners say they would be likely
to use this resource.
Blacks (50%) and Hispanics (49%) are significantly more likely than whites (19%) to say they would be
“very likely” to take classes on e-book borrowing. Looking at respondents by age group, Americans
under the age of 65 are the most likely to express an interest in these classes, with adults ages 30-64
expressing the strongest interest. Urban residents (64%) are more likely than suburban (54%) and rural
(54%) residents to express an interest in this service overall. Those living in households making less than
$30,000 per year are also more likely than the highest income levels to be interested in this resource.
Classes on e-borrowing were among the most popular services among our panel of librarian, with many
saying that they already offer these and the rest indicating at least some interest in offering these
classes in the future. “People love our eBook download classes,” one librarian wrote. “They are some of
the highest attended classes.”
While some librarians said that patrons ultimately prefer one-on-one attention, especially due to the
wide variety of e-readers available, others said that classes were a useful way to keep patrons’
technology-related questions from occupying too much of staff members’ time:
“The downloadable book classes and device classes [at our library] were necessary to free up
reference staff for actual reference questions. Our reference staff are very busy and stopping to
teach every other patron how to use the download service was a poor use of resources. The
older patrons appreciate the hands on classes where they get the librarian's undivided
pewinternet.org 65](https://image.slidesharecdn.com/piplibraryservicesreport012213-130127081824-phpapp02/85/Pip-library-services-report_012213-65-320.jpg)
![Part 5: The present and future of libraries
Libraries’ strengths
In addition to asking our online panel of library staff members about various services that libraries do
offer or might offer in the future, we also asked about what they considered to be libraries’ strengths.
One common theme was libraries’ role as a community center, and their connection to patrons and
other local institutions:
“I think our strength is in our ties to the community, and the relationships we build with our
customers. That should be our focus, and should drive how we develop our programs and
services in the future.”
“Libraries are community centers. We are very aware of what is happening locally and have
research services and books to meet that demand.”
“Public libraries are very good at partnering with nonprofits, schools, and businesses, which
raises the awareness of the importance of literacy in the community. It expands our reach.
Libraries should focus on literacy (all kinds), partnerships, 21st Century skills, community needs
(health, etc.), and providing welcoming spaces where people can gather.”
“Public libraries continue to be the place where community members can come together to
learn, socialize, meet, do business, and educate their children. We do this very well and should
continue to focus on this strength.”
“A warm, welcoming and friendly space is hard to find these days, and the public library has the
remarkable opportunity to become a community gathering place in communities where such a
space is sorely missing.”
“My public library's strength is in providing entertainment. Most patrons are looking for fiction
books, audio books, DVDs. We are a community center for local information and camaraderie,
like a general store. People are often isolated from one another, and the library provides a place
to exchange ideas of all sorts.”
“Public libraries excel at providing a social hub for any community: free wi-fi, free cards, access
to interlibrary loan services, or simply a warm, well-lit place to get out of the weather and feel
safe.”
Providing access to books was often cited, but the broader theme was one of providing access to
information, in every form:
“A public library is a community buying coop. Very few people can afford access to so many
resources on their own, so we pool our taxes together to create the collection and services.”
“[Our strength is] connecting the community with technology and knowledge.”
“The library is the meeting point of knowledge and information; it is a place where creativity can
be nurtured. Patrons are not judged or graded, but come in and are free to access all the library
has to offer. Libraries should continue to offer all means of giving access to knowledge that they
pewinternet.org 67](https://image.slidesharecdn.com/piplibraryservicesreport012213-130127081824-phpapp02/85/Pip-library-services-report_012213-67-320.jpg)
![currently offer (books, CDs, DVDs, computers, ebooks) and stay on top of new ways to access
knowledge (iPads, cloud computing, software tools, etc.)”
In addition to simply providing access to information, many librarians said that libraries’ strengths lie in
literacy efforts that help people find and use that information on their own; this included not only early
childhood literacy efforts and reading programs for children and teens, but also helping patrons learn
how to use computers, e-readers, and other devices:
“One of our biggest services and strengths is helping those who do not have a computer at
home and/or are unfamiliar with computers and need assistance. Libraries have become the
community ‘tech help’ center. We also help patrons find government documents on the web.
Often this is the only place these documents are available. We also help patron search for jobs
and fill out online job applications.”
“We should be THE destination for parents with young children, both for entertainment and
education.”
“[Our strengths are] providing early literacy for kids, providing help for students of all ages,
providing information and pleasure reading and viewing for adults and seniors. Keeping up with
technology for our patrons. Providing a sense of community: we work very closely with many
agencies in our community that serve kids, teens, adults and seniors. We try to coordinate
services not complete.”
“[Libraries] are the poor man's university. We provide literacy, and outreach, and research, and
job and career assistance, and assistance to small businesses, and so many other essential
services to the community and society.”
What should be libraries’ “guiding principle”?
We also asked library staff what they thought was the main mission of public libraries—what libraries’
“guiding principle” should be as they faced new circumstances and considered various changes:
“To offer knowledge and information to the community through books, online resources,
programs and to encourage a life-long love of reading whether for education, enlightenment or
entertainment.”
“Public libraries should be about educating the public to survive in today's world. That involves
not only the basic literacy that comes with books, but also a digital literacy to interact with the
government and economy as it becomes increasingly paperless.”
“Libraries should be the social hub of the community and to do that the customers have to be
able to use cell phones in the library, congregate around computers, sit and visit, laugh out loud
and be noisy. The main part of the library should be devoted to this and quiet spaces should not
be in any open areas, but should be in smaller cubicles.”
“To help their communities become the best they can be, by addressing community deficiencies.
It's much more than focusing on ‘reading’ literacy. “
“[Libraries should be] unbiased information facilitators.”
pewinternet.org 68](https://image.slidesharecdn.com/piplibraryservicesreport012213-130127081824-phpapp02/85/Pip-library-services-report_012213-68-320.jpg)
![“The public library should be the disseminator of reference materials, reading materials and the
provider of computer access to the general public. The guiding principle should be to keep
abreast of all ways to get info to the public and to provide it free of charge. The library should
always provide programs to introduce young readers to the world of literacy and research.”
“To meet the communities’ needs for information, acculturation, literacy and personal contact.”
“I think our guiding principle should be ‘access.’ We provide access to the world of information
and entertainment.”
“We are free to all, and free for all: all are welcome.”
“Libraries should be a community gathering place.”
“In my opinion, the idea of connection is what is most important. We are here to help people
find their place in the community, provide access to information and services, and help people
connect through the stories they love.”
Things to change
We also asked library staff about what things libraries should change going forward. Many spoke of a
need to be more flexible, to adapt to new technologies and open the library to more activities. Others
felt that some libraries were chasing new technology trends and programming at the expense of their
core competencies.
“[We need to stop] holding on to collections trying to have the breadth and depth that we had
in the `80s. What people want now is different, and how they access it is different. We have to
give up on being the ‘archival public library’ and move toward instant services.”
“We are at a crossroads in our area where we are dealing with an older generation who doesn't
mind change as long as they can still check out the books they want and the new generation
who wants and needs updates which we cannot afford.”
“As our population ages, focus of special services to seniors—hearing devices, viewing devices,
help services like carrying books to their cars, grabbers to get books off shelves, computer
classes directed to seniors, programming specific to seniors, have walkers and wheelchairs
available.”
“It seems that many libraries are struggling with an identity crisis, the next and newest thing to
offer patrons around the corner. Our staff sometimes feels pushed and prodded to offer so may
services with limited staff, space and time.”
“I am concerned about the constant demand to ‘keep up with technology’ when information is
where I place my emphasis. There will always be another device, another way to access the
information, and I am now in a position where I am like a salesman, not a librarian.”
“Stop trying to be all things to all people. Find out what communities want from us and provide
that service.”
pewinternet.org 69](https://image.slidesharecdn.com/piplibraryservicesreport012213-130127081824-phpapp02/85/Pip-library-services-report_012213-69-320.jpg)
![Another thread was making libraries more accessible and welcoming to more members of the
community:
“We need to change the concept of the library as a restricted, quiet space—we bustle, we rock,
we engage, but so many people in the community do not know this.”
“Library workers should look for more ways to seek patrons out. Everyone needs help but no
one wants to ask, myself included. I have been impressed by the reference training I have seen
at my library in order to better help people access information. More of this would be great.”
“Engage the digital natives. Promote online services more. Promote [libraries’] place as a neutral
space. Promote the added value of professional.”
Many librarians also said that public libraries should partner more with other organizations and go out
into the community to engage with new audiences:
“Some libraries believe that customers should come to the library—we can't [wait] for folks to
come in to our buildings. We have to be extremely proactive and get out into our communities
to show all the services we offer to support our communities.”
“Public librarians should reach out to school librarians, academic librarians, special librarians in
the community as all libraries and library personnel in many ways have a common goals of
providing unbiased information, promoting reading, promoting learning, promoting community,
etc. We can do all of this better together rather than trying to do it separately.”
“Libraries need to be more in the face of the public. There are thousands of people out there
who have never been encouraged to use the library, who think it is just for scholars and
computer users.”
“Libraries are not good at marketing their resources and services. People don't know what the
library offers. The library is not on many people's radar. That is one of the biggest problems at
my library.”
Along the same lines, several library staff members said that they felt the current layout of most
libraries was an impediment to patrons, who are often confused by the Dewey Decimal system and may
have difficulty finding or browsing for books:
“Libraries should explore other ways to organize our materials (Deweyless? bookstore model?).
Our goal is to make our resources easy to find. Libraries need to look at modern ways to do that.
Libraries should look at what barriers (rules) we have that impede the use of our resources.”
“We are losing the concept of browsing and the new bookstore model adopted by some
libraries is not the answer. I have worked in a library with it and when it was new patrons
thought it was a good thing. The more they had to use it the less they liked it and it was
eventually changed back.”
“Allow for straying from the Dewey Decimal system and even [alphabetize] by author. I know a
lot of libraries have done this but ours hasn't. As a librarian, I love [the Dewey Decimal system]
because I can find most any particular item right where it is supposed to be! But as a patron and
a mom I find it cumbersome.”
pewinternet.org 70](https://image.slidesharecdn.com/piplibraryservicesreport012213-130127081824-phpapp02/85/Pip-library-services-report_012213-70-320.jpg)
![“We have over 150 people on a waiting list for our computer classes to be offered next month.
The demand is high but there are just not enough staff and they will not pay for anymore staff.”
“Everyone struggles to keep up with the changing technology, but that has been part of
librarianship for a long time.”
Other librarians had concerns about some of the potential innovations and changes that they’ve
encountered:
“I am not personally excited about the mobile technology—it doesn't apply to me or most of
my staff. We are considered dinosaurs, but we have our reservations based upon our own
experiences about the need for privacy, possibility of identity theft, social media problems. We
understand that the younger generation will live like this probably forever, not especially
concerned about negative issues at all. On that note, I would enjoy learning and watching more
real-life examples of various apps for mobile devices. With time, some of us old-timers will
probably relate to some of it, just like we have adjusted to computers.”
“I am pretty negative about the ‘maker’ movement in libraries. If I had wanted to teach people
how to make stuff I would have been a teacher. I think libraries are more about helping people
learn for themselves. We set them on the path of learning, but do not hold their hands walking
down the road. I don't want to see libraries become publishers or creators.”
“I really don't like what I see at the library I where I work. We're pushing out the patrons who
really need us. We're placing too much emphasis on being a place to ‘hang out’ rather than
meeting the needs of our patrons. Our administration turns a deaf ear to our pleas for the
materials and education our patrons ask us for (more books, classes, etc.) and instead are
fixated on e-books and coffee machines.”
“We need to train ourselves to be more knowledgeable about the new formats of digital
materials we are offering. At my branch, we often refer user problems with e-readers and other
devices to those staffers who own such devices personally or have experience with them. We all
need to know how to address such queries.”
“I think I am a bit old-fashioned. I am in no way against automation or e-materials, [but] I do not
think it is our job to push them on the communities. I want them available. I want people to be
comfortable with them and be able to utilize them through our offerings. I do not want to
empty the library of hands-on material because automated materials are available unless I
know/believe automation is the best option. Look at the LPs coming back. How can we say
hands-on materials are a thing of the past?”
pewinternet.org 74](https://image.slidesharecdn.com/piplibraryservicesreport012213-130127081824-phpapp02/85/Pip-library-services-report_012213-74-320.jpg)


This document summarizes findings from a survey of over 2,000 Americans about their views and use of public libraries. Some key findings include: - Borrowing books, access to reference librarians, and free access to computers/internet are seen as very important library services. Many patrons would welcome expanded digital services like online research help from librarians and apps to access library materials. - Majorities think libraries should offer literacy programs, coordinate with schools, and have comfortable reading spaces. Opinions are mixed on moving printed materials to free up room for other services. - While most see libraries as important community resources, many don't know the full range of current services. Some patrons report increasing use


-2(1)](https://cdn.slidesharecdn.com/ss_thumbnails/testpsicotecnicosydepersonalidad11-21-140613074815-phpapp01-thumbnail.jpg?width=640&height=640&fit=bounds)


