Building on a FAIRly Strong Foundation to Connect Academic Research to Transl...
Sonata IC
1. Anand Rathi Share and Stock Brokers Limited (hereinafter “ARSSBL”) is a full-service brokerage and equities-research firm and the views expressed therein are solely of
ARSSBL and not of the companies which have been covered in the Research Report. This report is intended for the sole use of the Recipient. Disclosures and analyst
certifications are present in the Appendix.
Anand Rathi Research India Equities
India I Equities
Key financials (YE Mar) FY15 FY16 FY17 FY18e FY19e
Sales (` m) 16,822 19,405 25,212 28,605 32,537
Net profit (` m) 1,337 1,585 1,538 1,675 1,854
EPS (`) 12.7 15.1 14.6 15.9 17.6
Growth (%) 71.9 18.3 -3.0 9.1 10.7
PE (x) 12.2 10.4 10.7 9.8 8.8
PBV (x) 3.8 3.5 2.8 2.5 2.2
RoE (%) 33.3 35.2 29.1 26.8 26.0
RoCE (%) 45.4 43.0 37.3 39.0 38.4
Dividend yield (%) 4.5 5.8 3.5 4.5 5.0
Net debt/equity (x) -0.6 -0.4 -0.6 -0.6 -0.6
Source: Company, Anand Rathi Research
Mohit Jain
Research Analyst
+9122 6626 6531
mohitjain@rathi.com
Technology
Initiating Coverage
`
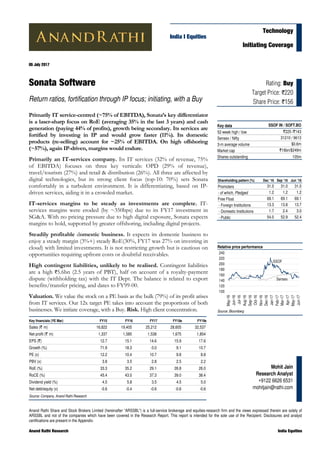
Rating: Buy
Target Price: `220
Share Price: `156
Relative price performance
Source: Bloomberg
SSOF
Sensex
100
120
140
160
180
200
220
240
May-16
Jun-16
Jul-16
Aug-16
Sep-16
Oct-16
Nov-16
Dec-16
Jan-17
Feb-17
Mar-17
Apr-17
May-17
Jun-17
Key data SSOF IN / SOFT.BO
52-week high / low `225 /`143
Sensex / Nifty 31210 / 9613
3-m average volume $0.6m
Market cap `16bn/$249m
Shares outstanding 105m
Shareholding pattern (%) Dec ’16 Sep ’16 Jun ’16
Promoters 31.0 31.0 31.0
- of which, Pledged 1.2 1.2 1.2
Free Float 69.1 69.1 69.1
- Foreign Institutions 13.3 13.8 13.7
- Domestic Institutions 1.7 2.4 3.0
- Public 54.0 52.9 52.4
05 July 2017
Sonata Software
Return ratios, fortification through IP focus; initiating, with a Buy
Primarily IT service-centred (~75% of EBITDA), Sonata’s key differentiator
is a laser-sharp focus on RoE (averaging 35% in the last 3 years) and cash
generation (paying 44% of profits), growth being secondary. Its services are
fortified by investing in IP and would grow faster (11%). Its domestic
products (re-selling) account for ~25% of EBITDA. On high offshoring
(~57%), again IP-driven, margins would endure.
Primarily an IT-services company. Its IT services (32% of revenue, 75%
of EBITDA) focuses on three key verticals: OPD (29% of revenue),
travel/tourism (27%) and retail & distribution (26%). All three are affected by
digital technologies, but its strong client focus (top-10: 70%) sets Sonata
comfortably in a turbulent environment. It is differentiating, based on IP-
driven services, aiding it in a crowded market.
IT-services margins to be steady as investments are complete. IT-
services margins were eroded (by ~350bps) due to its FY17 investment in
SG&A. With no pricing pressure due to high digital exposure, Sonata expects
margins to hold, supported by greater offshoring, including digital projects.
Steadily profitable domestic business. It expects its domestic business to
enjoy a steady margin (3%+) steady RoE(30%, FY17 was 27% on investing in
cloud) with limited investments. It is not restricting growth but is cautious on
opportunities requiring upfront costs or doubtful receivables.
High contingent liabilities, unlikely to be realised. Contingent liabilities
are a high `5.6bn (2.5 years of PBT), half on account of a royalty-payment
dispute (withholding tax) with the IT Dept. The balance is related to export
benefits/transfer pricing, and dates to FY99-00.
Valuation. We value the stock on a PE basis as the bulk (79%) of its profit arises
from IT services. Our 12x target PE takes into account the proportions of both
businesses. We initiate coverage, with a Buy. Risk. High client concentration.
3. 05 July 2017 Sonata Software – Return ratios, fortification through IP focus; initiating, with a Buy
Anand Rathi Research 3
Primarily an IT-services company
Sonata offers traditional and digital IT services
A niche, mid-size IT services operator (FY17 revenue: $121m), Sonata
provides services in three verticals: OPD (outsourced product
development, to largely technology companies), travel (mostly airlines and
travel agents) and retail & distribution(FMCG and retail) with each bringing
~26-30% to revenue.
It has not scaled up to its potential due to its high exposure to select
clients/verticals. In the last three years, though, it has been growing faster
than the industry (a 15% CAGR over FY14-17). The turning point in the
recent past has been its FY13 exit from the troubled and loss-suffering TUI
Infotech JV (`76m in Sonata’s FY12 P&L). In FY12, the EBITDA of this
JV had slid to `277m, from `640m in FY11.
In the past, the company has focused on select clients, with the top-10
accounting for ~70% of revenue. This focus has introduced volatility in its
growth rate on some occasions. For instance, in FY16 it grew just 10%, vs.
25% in FY15. This, though, at other times has worked in its favour (FY14
and FY15 were high-growth years, of 27%) as management sharply focused
on its top-10 clients.
Fig 7 – Sonata’s financial performance in the last seven years
Source: Company, Anand Rathi Research
2%
4%
6%
8%
10%
12%
0
5,000
10,000
15,000
20,000
25,000
FY10
FY11
FY12
FY13
FY14
FY15
FY16
FY17
(`m)
Consolidated
Revenues EBITDA margin (RHS)
0%
5%
10%
15%
20%
25%
30%
0
1,500
3,000
4,500
6,000
7,500
9,000
FY10
FY11
FY12
FY13
FY14
FY15
FY16
FY17
(`m)
IT services
Revenues EBITDA margin (RHS)
Fig 8 – Contribution of CPG / retail has grown, while OPD has shrunk in the last few years
Source: Company, Anand Rathi Research
OPD/ ISV
36%
Travel & Tourism
33%
CPG/Retail &
Distribution
14%
Others
17%
4QFY15
OPD/ ISV
29%
Travel & Tourism
27%
CPG/Retail &
Distribution
26%
Others
18%
4QFY17
4. 05 July 2017
Anand Rathi Rese
Fig 10 – To di
Source: Company, A
earch
fferentiate, So
Anand Rathi Research
W
d
c
b
a
m
T
i
b
H
a
c
o
T
onata is adding
h
Fig 9 – Perform
Source: Company, An
Within servic
digital busine
company is t
building/acq
adding a lay
model throug
The advantag
investments r
by its presen
Halosys $5m
acquiring the
client offerin
or off-the-sh
The customi
services envir
50
60
70
80
90
100
110
120
130
($m
g a layer of sof
Softwa
Softw
Pur
Sonata Softwa
mance of the t
nand Rathi Research
ce lines, the
ess 31%. In
trying to prot
quiring platfo
yer of softwa
gh which it u
ge with Sona
required to b
nt balance s
m, Rezopia E
ese platforms
ngs. The strat
helf) and cus
sation is usua
ronment for
0
0
0
0
0
0
0
0
0
FY14
m)
Top 10 Clients Rev (
ftware in servi
are + Services
ware / Platform
re Services
are – Return ratios
op-10 account
traditional b
the present
tect its traditio
rms in the v
are to an ot
used to operat
ata is that it f
build platform
sheet. So far
EV $2.4m –
s and is in the
tegy is to off
stomise the b
ally high, as t
a particular c
FY15
LHS) IT Services
ces
s
• Cust
(as I
platfo
• Tran
prod
Sona
• Rezo
• Brick
• IBIS s
• Halos
• Retin
• OPD
• IT ser
s, fortification thro
ts in FY14, FY1
business brin
hyper-comp
onal services
verticals it op
therwise pric
te.
focuses on se
ms for these s
r, it has inv
Sonata boug
e process of
fer 35% of th
balance 65%
the product i
client.
FY16
Rev (LHS) Top 10
tomers sometim
P) but mostly fo
orm-based serv
nsaction-based
uctivity gains p
ata
opia
k & Click
supply chain so
sys
na and transit tra
- T&M basis
rvices - T&M ba
ough IP focus; ini
15, FY16 and F
ngs 69% to r
petitive enviro
business. Th
perates in and
ce-sensitive s
elect verticals
services can b
vested $16m
ght 60% of
integrating th
he platform
% on the serv
is implement
67
68
69
70
71
72
73
74
75
76
77
FY17
0 Client concentration
mes pay for soft
or services (as
vices)
pricing possible
artially retained
oftware
avel analytics
asis
tiating, with a Buy
FY17
revenue; the
onment, the
his it does by
d, therefore,
services-only
s. Therefore,
be supported
(IBIS $9m,
Rezopia) in
hem with its
(as-a-service
vices model.
ted in an IT-
7%
8%
9%
0%
1%
2%
3%
4%
5%
6%
7%
n %
tware
e as
d by
y
4
5. 05 July 2017 Sonata Software – Return ratios, fortification through IP focus; initiating, with a Buy
Anand Rathi Research 5
Fig 11 – Sonata is seeing initial signs of success with this strategy
Source: Company, Anand Rathi Research
Note: Advanced Supply Chain Software is also called Modern Distributor
As this strategy is implemented, we expect a steady increase in revenue per
employee. This was partly seen in FY17. Hence, we are building in a 7%
increase in employee productivity over FY17-19, which would be a critical
watch-for factor in measuring the success of its software-plus-services
strategy. During FY14-17, it has clocked a 4% CAGR.
Fig 12 – Revenue per employee and expectations
FY12 FY13 FY14 FY15 FY16 FY17 FY18e FY19e
IT services revenues ($ m) 161 83 79 98 108 121 133 148
Headcount 2,169 2,257 2,445 2,896 3,111 3,213 3,309 3,419
Revenue per employee ($ / employee /hr) 46 22 18 18.9 19.3 21.0 22.4 24.1
Domestic re-selling business ($ m) 163 179 179 178 191 258 297 342
Headcount 126 118 120 122 148 153 161 169
Revenue per employee ($ m /employee) 1.3 1.5 1.5 1.5 1.3 1.7 1.8 2.0
Source: Company, Anand Rathi Research
A significant change has been seen in the mix of service lines offered in the
last three years, the most notable being the shrunken share of ADM
services (a drag on Sonata’s IT-services growth). Simultaneously, though,
IMS revenue has grown rapidly, covering the shortfall in ADM revenue.
While ADM across the industry has slowed down, the rapid growth in the
company’s IMS services has been astonishing and was possibly driven by
strong growth in its top ISV account, Microsoft.
In IMS, Sonata is trying to help product companies transition their existing
products to cloud-based offerings – primarily on the Azure platform. This,
under the verticals, is clubbed in OPD/ISV and is seeing good traction. Its
peers, working on the ISV/OPD side, may see pricing and growth
pressures but Sonata manages to escape that just because it is catering to
clients’ spending, which is now increasing, and plays a more critical role
than traditional OPD expenditure.
Rezopia
(five
clients)
One US-based holiday
company is on Rezopia
+ Services
Brick &
Click (five
clients)
One retail client each in
the US and Australia
are using Brick-&-Click
Adv.
Supply
Chain
SW/IBIS
(10-15
clients)
Three of the top-10
clients are on the
software-plus-
services model
Auto manufacturers
Fig 13 – Service line break-up
Source: Company Reports, Anand Rathi Research
ADM
25%
Testing
17%
ERP
20%
IMS
19%
Platform/Di
gital
19%
6. 05 July 2017 Sonata Software – Return ratios, fortification through IP focus; initiating, with a Buy
Anand Rathi Research 6
Fig 14 – IMS revenues have grown sharply, counter-balancing the ADM slowdown
Source: Company, Anand Rathi Research
Softness in ADM services is expected to continue due to the shift to digital
technologies. We are optimistic on growth in the company’s IMS service
line as it has aligned its growth strategy here to the new “cloud”-based
products (Azure), which is on a high-growth trajectory. Sonata’s small scale
also means that super-normal growth would continue for the next two
years as well. As seen above, the company benefits by building a tool kit for
enterprise clients who primarily use it in their migration to the Azure cloud.
Two of the company’s service lines which disappointed us on the growth
side are mobility and e-commerce. Both these have not grown sustainably
in the last couple of years and have been meaningless for the company in
the overall scheme of things. Management believes that this is because
some of the revenue that these lines have generated was re-classified as
traditional service lines. The actual revenue generated by these services
lines may look small but they are growth-enablers for other parts of the
business. The other part of the problem is related to the new platform –
Halosys. The company is in the process of on-boarding clients on Halosys
and, till this practice is scaled up, revenues may be volatile depending on
project closures.
Fig 15 – Mobility and e-commerce lines are growth-enablers for other lines
Source: Company, Anand Rathi Research
Sonata, overall, is experiencing limited pricing pressure in its IT-services
business and expects it to grow by double digits in FY18. It is seeing
significant investments in digital technologies in its target verticals (both
0%
10%
20%
30%
40%
50%
60%
70%
IT Services Revenues
(US$m)
ADM Revenues (US$m) IMS Revenues (US$m)
FY15-17 CAGR %
-40%
-30%
-20%
-10%
0%
10%
20%
30%
40%
Mobility E-Commerce (including Rezopia)
7. 05 July 2017 Sonata Software – Return ratios, fortification through IP focus; initiating, with a Buy
Anand Rathi Research 7
travel and retail & distribution are consumer-facing). Pressure, though, is
seen in OPD (traditional piece only, not the transition-to-cloud related
OPD), where both price and volume cuts are increasingly common. Sonata
is primarily focused on two large accounts here and, so far, has not yet
borne the brunt of these pressures. In terms of regional breakup, it is in
line with other IT companies, 60% of its revenue coming from the US,
24% from Europe. It is experiencing softness in its Europe business
(mainly the UK and Germany) on account of currency shifts and lower
discretionary spending. It is largely able to hold to its dollar revenue.
On a relative basis, the company has done reasonably well in the verticals it
operates in. We are comparing its travel and retail & distribution verticals
with peers such as TCS, Mindtree and NIIT Tech. For its OPD offering,
we compare it with Persistent and Mindtree.
Fig 17 – Relative growth of travel and retail / OPD
Source: Company, Anand Rathi Research
The proportion of IT services in revenue is 32%, in EBITDA 75% and in
PAT 79%, making it an extremely critical segment for profit growth. PAT
has been stagnant in the last eight quarters as the company was re-investing
part of its higher-than-peers margins into the business by way of higher
SG&A. Ahead, we expect FY18 and FY19 profits to reflect revenue growth
more closely as investments are almost complete and margins may be
steady at these levels.
We will be discussing the cost structure in detail in the next section.
0% 5% 10% 15% 20% 25%
Sonata - Travel/Retail
Sonata (IT services)
TCS (Travel/Retail)
Mindtree
(Travel/Retail)
Sonata (OPD)
PSYS (Services)
Mindtree (OPD)
FY15-17 CAGR %
Fig 16 – Regional split
Source: Company, Anand Rathi Research
US
60%
Europe
include UK
24%
APAC
16%
8. 05 July 2017 Sonata Software – Return ratios, fortification through IP focus; initiating, with a Buy
Anand Rathi Research 8
IT-services margins to be stable, as
investments are complete
Sonata runs two businesses: IT services and domestic re-selling. These two
have remarkably different margin profiles: international IT commands a 21-
22% EBITDA margin, domestic reselling a slim 3-4%. Therefore, at the
company level, Sonata has exhibited volatility (ranging from 6.2% to 11.9%
for the last eight quarters) as the revenue-mix of the domestic reselling
business varies quarterly. The domestic business typically contributes more
in Q1 and Q4 than in the other quarters. Consequently, margins tend to be
weaker in these quarters.
Fig 18 – EBITDA margins reflect the changing mix of domestic and IT businesses
Source: Company, Anand Rathi Research
On the IT services side, Sonata has multiple levers on the cost side that it
has utilised so far to hold margins in a narrow range.
Employee utilisation: The most-actively-used lever has been utilisation,
which it has maintained at 85% for almost 10 successive quarters now. We
do not believe that this can be raised further, If these levels are maintained,
however, profitability is expected to be higher than peers. The leverage
comes from the fact that employees working on developing IP are
considered utilised, but can still be moved perhaps to projects, if required.
Fig 19 – Utilisation compared to larger peers (Persistent, Mindtree)
Source: Company, Anand Rathi Research
0%
10%
20%
30%
40%
50%
60%
70%
80%
0%
5%
10%
15%
20%
25%
30%
FY12
FY13
FY14
FY15
FY16
FY17
FY18E
FY19E
Domestic Rev contribution (RHS) IT services margins
Domestic Margins Consolidated Margins
65%
70%
75%
80%
85%
90%
1QFY15
2QFY15
3QFY15
4QFY15
1QFY16
2QFY16
3QFY16
4QFY16
1QFY17
2QFY17
3QFY17
4QFY17
Sonata - IT Services Persistent Systems Mindtree
9. 05 July 2017 Sonata Software – Return ratios, fortification through IP focus; initiating, with a Buy
Anand Rathi Research 9
Proportion of offshore work: The company has seen a structural increase
in the on-site proportion of work but has managed it better than peers to
ensure that margins (despite some pressure in FY16 and FY17) are steady
relatively. Ahead, it is not looking at increasing the proportion of onsite
work; hence, this headwind to margins will no longer exist.
Fig 20 – Sonata is retaining high offshoring to maintain its margins
Source: Company, Anand Rathi Research
SG&A leverage/investments: This is one area where Sonata has invested
significantly in FY16 and FY17 and where margins have been squeezed.
The company expects to start reaping the benefits of these investments in
FY18 and beyond.
Fig 21 – Movement of EBITDA and re-investments in SG&A to accelerate growth
Source: Company, Anand Rathi Research
Apart from these traditional levers, Sonata enjoys one strength, ie, its lower
cost of delivery than others. While there is a role played by its higher
offshore delivery as well, there are three critical elements which help it
deliver at lower costs: employee pyramid, productivised services (also
reflected in revenue/employee) and focus on just three verticals.
0
10
20
30
40
50
60
70
80
1QFY15
2QFY15
3QFY15
4QFY15
1QFY16
2QFY16
3QFY16
4QFY16
1QFY17
2QFY17
3QFY17
4QFY17
(%)
Sonata - IT Services Persistent Systems Mindtree
1,043
1,675
1,919
1,922
615
17
588
344
472
468
0
500
1,000
1,500
2,000
2,500
FY14EBITDA
GrossProfit
SG&A
FY15EBITDA
GrossProfit
SG&A
FY16EBITDA
GrossProfit
SG&A
FY17EBITDA
(`m)
10. 05 July 2017 Sonata Software – Return ratios, fortification through IP focus; initiating, with a Buy
Anand Rathi Research 10
Fig 22 – Sonata’s cost of delivery is on par with peers (Mindtree, Persistent)
Source: Company, Anand Rathi Research
Note: FY16 and FY17 deviation in costs are largely because of higher offshore proportion of work for Sonata, higher cost of IoT
employees for Persistent Systems, and lower utilisation for Mindtree on the latter’s sharp de-acceleration in growth
0 5 10 15 20 25
FY12
FY13
FY14
FY15
FY16
FY17
Average gross cost per employee (`m)
Mindtree Persistent Systems Sonata - IT Services
11. 05 July 2017
Anand Rathi Rese
Fig 24 – Seaso
Source: Company Re
3Q
2
4Q
2
earch
onality of the t
eports, Anand Rathi R
QFY17
25%
FY17
25%
IT
T
2
c
o
t
T
o
a
m
two businesse
Research
T Services
Domes
The domesti
21% to PAT)
characteristic
selling softwa
or ISVs (with
the OPD sub
Fig 23 – Syner
Source: Company, An
The domesti
strong sales o
of cost struc
are procured
manage the s
es
1QFY17
24%
2QFY17
26%
Sonata Softwa
stic bus
ic business (b
) is the other
cs than IT s
are-product l
h revenue sy
b-segment).
rgies between
nand Rathi Research
ic business is
of licenses in
ture, the bulk
; the balance
sale and deliv
IT ser
(Microso
are – Return ratios
siness,
bringing 68%
r part of the b
ervices. The
licenses from
ynergies seen
IT services an
s seasonal as
n India; the o
k of costs is
is on accoun
very process.
Domestic
(Microsoft,
SAP, O
rvices
oft, HP)
3QFY
24%
4QFY17
30%
s, fortification thro
steady
% to revenue
business, with
former relie
m large indepe
in the IT-se
nd domestic re
s a few quar
other two are
paid to the I
nt of employe
reselling
IBM, HP,
Oracle)
Platform o
(Microsof
Y17
%
Deomestic Res
ough IP focus; ini
y on pr
e, 25% to EB
h fundamenta
es on procur
endent softw
ervices divisio
e-selling
rters (Q1 and
e relatively so
ISVs from wh
ee and opera
offerings
ft, SAP)
1QF
28
2QFY
18%
selling
tiating, with a Buy
1
rofits
BITDA and
ally different
ring and re-
ware vendors,
on as well in
d Q4) enjoy
oft. In terms
hich licenses
ating costs to
FY17
8%
Y17
%
y
1
12. 05 July 2017 Sonata Software – Return ratios, fortification through IP focus; initiating, with a Buy
Anand Rathi Research 12
Fig 25 – Direct costs (as % of revenue) and EBITDA margin of domestic business
FY12 FY13 FY14 FY15 FY16 FY17
Revenues ($ m) 163 179 179 178 191 258
Revenues (` m) 7,866 9,767 10,868 10,941 12,396 17,153
Direct costs -7,400 -8,905 -10,058 -10,177 -11,600 -16,477
Number of employees 126 118 120 122 148 153
EBITDA (`m) 16 190 352 413 548 563
EBITDA margin % 0.2 1.9 3.2 3.8 4.4 3.3
Source: Company, Anand Rathi Research
Fig 26 – Domestic business completely non-linear, unlike IT-services business
FY12 FY13 FY14 FY15 FY16 FY17 FY18e FY19e
IT services revenues ($ m) 161 83 79 98 108 121 133 148
Headcount 2,169 2,257 2,445 2,896 3,111 3,213 3,309 3,419
Revenue per employee ($/ employee/ hr) 46 22 18 18.9 19.3 21.0 22.4 24.1
Domestic re-selling business ($ m) 163 179 179 178 191 258 297 342
Headcount 126 118 120 122 148 153 161 169
Revenue per employee ($ m/ employee) 1.3 1.5 1.5 1.5 1.3 1.7 1.8 2.0
Source: Company, Anand Rathi Research
The strategy of the company here is not to chase growth vigorously but to
focus on margins and return ratios. Management focus is on the IT-
services business. Simultaneously, though, this segment opens up
opportunities to connect with large ISVs to grow the services business.
Fig 27 – Critical clients for the domestic business
Source: Company, Anand Rathi Research
In terms of profitability, the company has maintained its PAT at the same
level for the last seven quarters and is expected to retain it over the next
two years as well. The domestic re-selling business can best be compared to
Redington and the company has been able to impress here as well, in terms
of financial/return ratios.
Fig 28 – Sonata’s performance compared with Redington (distant listed peer))
Redington FY12 FY13 FY14 FY15 FY16 FY17
Revenues (` m) 212,220 242,104 280,051 316,227 354,763 411,560
Growth % 14 16 13 12 16
EBITDA (` m) 6,334 6,842 7,196.1 7,618.9 8,175.8 8,662.30
EBITDA margin (%) 3.0 2.8 2.6 2.4 2.3 2.1
RoE (%) 19.7 16.7 16.3 15.3 15.6
Source: Company, Bloomberg, Anand Rathi Research
Note: With 87 sales offices, 114 warehouses, and 360+ service centres, Redington is into distribution of hardware & software.
It employs 1,400 people and derives 38% of its revenues from India and 98% from its distribution business
IBM
SAPMicroso
ft
HP
SAP
Oracle
Symantec
13. 05 July 2017 Sonata Software – Return ratios, fortification through IP focus; initiating, with a Buy
Anand Rathi Research 13
Sonata is further focusing on selling “cloud” and other digital-technology
products, expected to result in some expansion in margins as these typically
require more value-added-services in terms of determining quantity to be
bought depending on an analysis of a customer’s requirements. Key
customers for these new products are Microsoft, Oracle and SAP. Sonata is
also moving into re-selling security-related products and has tied up with
companies such as Palo Alto and Check Point.
Management’s focus is to run this business from an RoE perspective than
on absolute margins (which may seem too low) or on an investment-driven
growth perspective. In the last many quarters, Sonata has held this
division’s RoE at 25%+ although this has steadily come off from the highs
of 42% at the beginning of FY16. In fact, in Q3 FY17, this has for the first
time turned out to be lower than the RoE of IT services, signalling
investments in the new cloud-based re-selling of products.
Fig 29 – IT-services determines profitability for Sonata as a whole
Source: Company, Anand Rathi Research
Fig 30 – RoE of products business and implied equity investment steady at 20%
FY14 FY15 FY16 FY17
Product business RoE (%) 28 38 38 29
Implied equity investment (` m) 699 665 889 1,169
As % of total equity 19 16 19 23
Total equity (` m) 3,744 4,284 4,710 5,150
Consolidated RoE(%) 22 33 35 31
Cash (as % of total assets) 61 52 26 58
Source: Company, Anand Rathi Research
Overall, the domestic re-selling segment is financially less critical for the
company given its lower percentage of profits. However, the company
believes that it is still a strategic fit and gives Sonata critical size for its
operations. Therefore, while these two businesses are run separately, the
company does not intend to hive them off in the near future.
0
200
400
600
800
1,000
1,200
1,400
FY14
FY15
FY16
FY17
(`m)
IT Services Domestic Reselling
14. 05 July 2017 Sonata Software – Return ratios, fortification through IP focus; initiating, with a Buy
Anand Rathi Research 14
High contingent liabilities, unlikely to
be realized
One of the reasons Sonata is afforded a lower multiple than peers despite
strong financials and returns is its significantly higher contingent liabilities.
It has had many disputes with income-tax authorities related to its transfer
pricing, services considered for export exemption, and on royalty-liabilities
on the domestic-reselling business. (The Income Tax Department contends
that payments made to buy software are in the nature of royalty; hence, a
withholding-tax of 10% is payable.)
Sonata’s effective tax rate over the last eight years has moved up from less
than 20% (FY10-12) to average ~30% over FY13-17. This is not too far
from the rest of the IT companies; therefore substantial liabilities have
been accumulated before FY13.
Fig 31 – ETR (effective tax rates) of Sonata, Persistent and Mindtree suggest lower
chances of further tax disputes
Source: Company, Anand Rathi Research
In terms of accumulated liabilities, contingent liabilities for Sonata turn out
to be `5.5bn, or 3.6x FY17 profits, uncomfortably high. However, on
splitting such liabilities between its international and domestic businesses,
the latter’s share is `3.61bn (or 67% of overall contingent liabilities). The
balance `1.85bn (or 33% of overall contingent liabilities) is largely on
account of the IT-services division and are 1.3x FY17 profits. Although the
issues are common to the industry, this ratio is higher than other IT
companies such as Persistent (0.0x FY16 EBITDA), Mindtree (0.1x) and
Redington (0.3x).
Fig 32 – Contingent liabilities for Sonata (consolidated) ` m %
Guarantees 1,044 19
Claims not acknowledged as debt 23 0
Disputed service and sales tax 68 1
Disputed income tax 4,417 80
Total 5,552 2.9 x FY16 EBITDA
Source: Company, Anand Rathi Research
Note: Of the contingent liabilities, `1,044m are for SITL (its domestic re-selling business)
Management view
Most contingent tax-liability issues Sonata is faced with plague the industry.
Moreover, many of them are quite old and have been carried over
unnecessarily as cases continue to be brought to various fora despite
-120%
-100%
-80%
-60%
-40%
-20%
0%
20%
40%
FY12
FY13
FY14
FY15
FY16
FY17
Sonata Persistent Systems Mindtree
15. 05 July 2017 Sonata Software – Return ratios, fortification through IP focus; initiating, with a Buy
Anand Rathi Research 15
favourable judgements in previous fora. Management believes that none of
these liabilities are tenable in courts, hence unlikely to be realized.
“The CESTAT ruling on September 23 has categorically said that marketing and technical-
support services given to overseas entities could be treated as “export of services”
although these services are actually performed within India and involved market research
on Indian consumers. It is an established policy that exports are not taxable.”
Although the Microsoft case involves services rendered by the Indian firm to one of its
overseas associates, the Tribunal ruling is applicable to all Indian firms providing services
to foreign entities, irrespective of whether they are related parties.
Source: http://indianexpress.com/article/business/companies/microsofts-tax-win-to-aid-others-exporting-services-from-india/
Fig 33 – Contingent liabilities for IT services (`m)
Section 10A- / 80-related 359
Disputed support services and project personnel 1,065
Transfer pricing 116
Others 306
1,847 1.1 x FY16 EBITDA
Source: Company, Anand Rathi Research
Management view
Regarding the domestic business, the company’s view is that software
products from overseas ISVs were considered “goods”; hence, no royalty
payments apply. Consequently, withholding taxes are applicable to these
payments. The Income-Tax department views these payments as royalty
and, since withholding tax is not deducted, income tax would practically
apply to revenues (deduction not allowed for cost of procuring licenses).
Thus, the liabilities appear much larger.
“The Supreme Court of India has held, in its 9
th
Sep’13 judgment pronounced in the case of
GE India Technology Centre Pvt. Ltd. vs. CIT that any payments made to non-residents will
be subject to a withholding tax only when such payments are chargeable to tax in India.”
Source: http://taxinsights.ey.com/archive/archive-news/united-states-irs-issues-updated-publication-570-tax-guide-individuals-
income-us-possessions-2.aspx
Nevertheless, one of its prime ISV suppliers has agreed to pay withholding
taxes in India; that amount is not included above. For others and, given the
stringent Indian tax laws on withholding taxes, Sonata may be held liable
for withholding taxes. The most recent case, somewhat similar in form or
substance, is the Nokia tax dispute, now under bilateral negotiation.
Fig 34 – Contingent liabilities for the domestic business (`m)
Corporate guarantees 1,044
Withholding tax 2,570
3,614 12.4 x FY16 EBITDA
Source: Company, Anand Rathi Research
Past judgements for reference
Hon’ble Kolkata High Court
Indian Steel & Wire Products vs. CIT [69 ITR 379]
Calcutta Landing & Shipping Co. vs. CIT [65 ITR 1]
Aruna Mills vs. CIT [31 ITR 153]
Hon’ble Supreme Court
CIT vs Dhanrajgirji Raja Narasingirji [91 ITR 544]
CIT vs Walchand & Co. [65 ITR 381]
Union of India vs Azadi Bachao Andolan [263 ITR 706]
16. 05 July 2017 Sonata Software – Return ratios, fortification through IP focus; initiating, with a Buy
Anand Rathi Research 16
Financials
IT-services division
We expect Sonata’s IT division to clock a 10% CAGR over FY17-19, with
industry expectations pegged at ~7-8% in dollar terms for FY18. Within
segments, this growth is expected to be driven by OPD and CPG/retail &
distribution, supported by some recovery in the travel and tourism
segment. The growth is similar to that reported in FY15-17 (11%). This is
despite the fact that growth in the industry has decelerated in the recent
past and reflects our optimism regarding two factors: 1) Sonata has a size
advantage (FY17 revenue: $121m) and 2) its platform-driven services and
select-verticals focus should render it more resilient to pricing pressure.
Fig 35 – Sonata’s IT-services growth in comparison to peers
Source: Company, Anand Rathi Research
With this kind of revenue growth and onsite-offshore mix, Sonata should
maintain its IT services division EBITDA margin at 21% (FY17 20.6%).
15%
10%
16%
8%
16%
11%
0%
2%
4%
6%
8%
10%
12%
14%
16%
18%
FY14-17 CAGR FY17-19e
Sonata - IT Services Mindtree Persistent Systems
Fig 36 – On-shore / Offshore mix
Source: Company, Anand Rathi Research
Fig 37 – Margin expectations for IT services
Source: Company, Anand Rathi Research
25
35
45
55
65
75
1QFY15
2QFY15
3QFY15
4QFY15
1QFY16
2QFY16
3QFY16
4QFY16
1QFY17
2QFY17
3QFY17
4QFY17
(%)
Onshore Offshore
11%
18%
24% 24%
21% 21% 21%
0.0%
5.0%
10.0%
15.0%
20.0%
25.0%
30.0%
FY13
FY14
FY15
FY16
FY17
FY18e
FY19e
EBITDA Margins %
17. 05 July 2017 Sonata Software – Return ratios, fortification through IP focus; initiating, with a Buy
Anand Rathi Research 17
Domestic business
We expect this part of the business to register a 15% CAGR over FY17-19,
against 20% over FY15-17. This is because the bulk of the CAGR in FY15-
17 came in the last year when the business swelled 35%. The growth rate
has since started coming off. The other reason is that the management
focus and bandwidth is on growing the IT-services business; therefore,
growth in this segment is more on an opportunistic basis.
Fig 38 – Domestic re-selling business growth compared to Redington’s
Source: Company, Anand Rathi Research, Notes: Revenue growth calculated in US $
The focus on this business is only on margins and RoE. Therefore, Sonata
does not take up products which are low-gross-margin, high-growth. While
it has guided to slightly improved margins as it takes up higher-value-added
products and its mix of cloud-based offerings improve, we are building in
steady margins on the business, assuming some investments for growth.
Fig 39 – Margin expectations for the domestic business
Source: Company, Anand Rathi Research
13%
15%
10%
12%
0%
2%
4%
6%
8%
10%
12%
14%
16%
FY14-17 CAGR FY17-19e
Sonata - Domestic Reselling Redington
2%
3%
4%
4%
3% 3% 4%
0.0%
0.5%
1.0%
1.5%
2.0%
2.5%
3.0%
3.5%
4.0%
4.5%
5.0%
FY13
FY14
FY15
FY16
FY17
FY18e
FY19e
EBITDA Margins %
18. 05 July 2017 Sonata Software – Return ratios, fortification through IP focus; initiating, with a Buy
Anand Rathi Research 18
Consolidated basis
Sonata (consolidated) would grow 14% over FY17-19 and IT services
would bring 30% to revenue in FY19 (FY17e: 32%, FY16: 36%). We
expect a 7.5% EBITDA margin in FY19 vs. 7.6% in FY17. This nominal
margin expansion would be driven by scale efficiencies.
Fig 40 – Consolidated revenue growth and margins
Source: Company, Anand Rathi Research
-5%
0%
5%
10%
15%
20%
25%
30%
0
100
200
300
400
500
600
FY14
FY15
FY16
FY17
FY18e
FY19e
(%)($m)
Revenues Growth (RHS) EBITDA Margins (RHS)
19. 05 July 2017 Sonata Software – Return ratios, fortification through IP focus; initiating, with a Buy
Anand Rathi Research 19
Valuation
Sonata can be valued by two methods
1. A sum-of-parts valuation, assessing the two businesses then summing
them up to arrive at a target multiple. We use this method for Sonata.
There is no case for a holding-company discount in our opinion as
there is no perceived risk in terms of capital allocation (20% to the
domestic business) of the company. The bulk of the investment occurs
in IT services and Sonata is a high-dividend-paying company.
Fig 41 – Sonata’s valuation in order to derive a target multiple
Source: Anand Rathi Research Note: We are not applying any holding-company discount in this case as synergies between
the two businesses and the capital allocation have been quite consistent over the past many years
2. PE-based. Since the bulk of Sonata’s profits are generated from its IT-
services, it can be valued on a PE basis, as with any other IT-services
business. This method has the benefit of rendering Sonata comparable
with other IT-services companies. The problem is that the balance 15%
business would also attract the same valuation as the IT-services
business, and lead to a margin of error in the target price. We have not
used this method to derive our target price.
IT Services
(13x FY19
EPS)
Domestic
Reselling
Business (9x
FY19 EPS)
Sonata (80% IT
Services+20%
Domestic
reselling) = 12x
FY19 PE
Fig 42 – Relative Valuation
Market Data Returns Expect Returns Target PE M Cap PE EV/EBITDA Revenue EBITDA EBITDA Margin % RoE % EV/ sale
Company CMP (`) (LTM) % (NTM) % (FY18e) (` bn) FY18e FY19e FY18e FY19e
CAGR %
FY17-19e
CAGR %
FY17-19e FY18e FY19e FY17 FY19e
TCS 2,353 -8 -5 16 4,637 17.4 16.4 12.9 11.9 7 6 27 27 37.1 3.2
Infosys 933 -20 18 16 2,143 14.1 13.7 8.9 8.5 7 5 27 26 22.2 2.2
Wipro 257 -8 -7 13 1,252 16.0 14.2 9.7 8.6 2 5 19 21 17.2 1.8
HCL Tech 841 15 2 13 1,200 13.4 12.7 9.6 9.1 7 6 23 22 28.8 2.0
Tech M 384 -23 10 12 374 12.4 10.9 7.5 6.7 8 7 14 15 18.3 1.0
Hexaware 245 7 NA NA 74 16.1 14.6 11.2 10.1 11 11 16 16 27.0 1.6
Mindtree 527 -21 2 16 88 16.8 15.6 9.6 8.8 7 13 15 15 16.7 1.3
KPIT Tech 123 -33 30 11 24 9.5 8.6 5.4 4.8 7 18 12 13 16.1 0.6
Persistent 672 -4 19 15 54 15.5 12.9 8.3 7.1 10 16 17 18 17.0 1.3
Cyient 507 4 24 16 57 14.7 13.0 9.2 8.0 9 13 14 15 18.4 1.2
NIIT Tech 569 11 NA NA 35 12.5 11.2 5.7 5.2 7 8 17 17 15.3 0.9
Eclerx 1,300 -10 NA NA 52 15.6 14.1 10.1 9.0 4 4 35 35 30.8 3.2
Sonata Software 154 -7 43 12 16 9.7 8.7 5.8 5.3 14 13 8 8 31.2 0.4
Mastek 260 92 25 13 6 11.1 10.7 5.5 5.1 22 37 12 12 11.1 0.6
Firstsource 33 -28 19 9 23 7.8 7.8 8.0 7.4 5 9 10 11 12.6 0.8
Hinduja Global 512 28 37 7 11 5.4 5.4 2.8 2.7 6 3 12 11 14.2 0.3
Intrasoft Tech 400 -3 38 22 6 28.1 16.3 16.8 9.4 31 77 2.5 3.4 3.0 0.3
Majesco 310 -42 86 52 7 62.9 40.0 34.6 15.1 9 51 3.5 7.0 (2.0) 0.7
Intellect Design Arena 121 -41 45 18 12 19.1 12.3 13.3 8.3 15 NM 9.4 13.2 - 1.1
MEAN -5 24 16.7 13.6 10.3 8.0 10 17 15 16
MEDIAN -8 22 14.7 12.9 9.2 8.3 7 10 14 15
LTM L3M
USD:INR 64.6 -4 0
GBP:USD 1.3 -2 4
Source: Company Reports, Anand Rathi Research, Bloomberg
20. 05 July 2017 Sonata Software – Return ratios, fortification through IP focus; initiating, with a Buy
Anand Rathi Research 20
With only ~2% of its US population on an H1-B visa, Sonata has limited
exposure to such a visa program. The average salary for the rest of the US
workforce is ~$80,000 p.a. Therefore, any changes in these regulations
would not expand or shrink the company’s margin. This also gels with our
thesis of a limited impact of an increase in the visa fee for Indian IT as the
average salary for locals is at a similar level as on-site professionals.
Therefore, theoretically, if the H1-B visa fees are increased to $130,000 p.a.
(or to any figure higher than $100,000 p.a.), the industry will start shifting
to locals at $80,000 p.a. This also means that the impact on margins will be
that much lower (we estimate ~200bps at the gross level for industry and
nil for Sonata, part of which will be offset through greater efficiency or
better billing rates or a higher offshore proportion).
Hence, we initiate coverage on Sonata, with a Buy recommendation.
Fig 43 – One-year-forward PE band
Source: Bloomberg, Anand Rathi Research
-
2
4
6
8
10
12
14
16
18
20
Aug-13
Nov-13
Feb-14
May-14
Aug-14
Nov-14
Feb-15
May-15
Aug-15
Nov-15
Feb-16
May-16
Aug-16
Nov-16
Feb-17
May-17
21. 05 July 2017 Sonata Software – Return ratios, fortification through IP focus; initiating, with a Buy
Anand Rathi Research 21
Company Background, Management
A global IT-services company headquartered in Bangalore, Sonata Software
provides IT solutions to customers in the US, Europe, APAC and West
Asia, and distributes software products in India. It operates through two
distinct business segments: International IT Services (IITS) and Domestic
Products & Services (DPS).
Within the former (~32% of FY17 revenue), it serves travel, retail &
distribution and OPD sectors and provides consulting, ADM, ERP, testing,
IMS, cloud, mobility and platform services. A key focus area for it is
platform-based technology, and it offers various platform solutions such as
Rezopia (travel), RETINA (retail & distribution) and Halosys (enterprise
mobility platform) to clients.
In the Domestic Products & Services segment (DPS) (~68% of FY17
revenue), through its subsidiary, Sonata sells software products including
licenses for Microsoft, SAP, Oracle, Adobe, IBM, HP and TIBCO in India.
Board of Directors
Chairman Pradip P. Shah: B.Com., University of Mumbai, cost accountant
and chartered accountant; MBA, Harvard University. Instrumental in
developing the financial-services sector in India, having served as a project
officer at ICICI, assisted in forming the Housing Development Finance
Corporation, and founder and managing director, CRISIL. Also, director in
many other prominent companies: BASF India, Godrej & Boyce, Hardy
Oil & Gas [UK], Kansai Nerolac Paints, Pfizer and Tata Investment Corp.
Seven directors sit on the Board, of which four are independent.
Key management personnel
Managing director & CEO P Srikar Reddy: graduate, Regional Engineering
College (NIT, Trichy) in electronics and communications engineering in
1980; management post-graduate from IIM, Calcutta. With Sonata since
1986. Involved with NASSCOM and CII; chairman of the Regional
NASSCOM Council and member of the NASSCOM IT Services Council.
CFO Prasanna Oke: BE, University of Pune; MBA, IIM, Ahmedabad.
Over 20 years’ experience in finance, delivery operations, sales and
marketing; several leadership roles in M&A, integration and re-structuring.
Prior to Sonata, was COO at GlobalShiksha.com.
Company secretary and Compliance officer Kundan K. Lal: LLB, Delhi
University, member of the Institute of Company Secretaries of India. Over
17 years' experience in listed and unlisted companies; represented various
companies including engineering, manufacturing, IT and emerging growth
technology companies in corporate & secretarial, labour, indirect taxation,
real estate, intellectual property, setting up units in DTA and SEZ, and
litigation.
Auditors
Deloitte, Haskins and Sells
Fig 44 – Verticals break-up
Source: Company
OPD / ISV
29%
Travel&
Tourism
27%
CPG/Retail
&
Distribution
26%
Others
18%
Fig 45 – Service line break-up
Source: Company
ADM
25%
Testing
17%
ERP
20%
IMS
19%
Platform/Di
gital
19%
22. 05 July 2017 Sonata Software – Return ratios, fortification through IP focus; initiating, with a Buy
Anand Rathi Research 22
Fig 46 – Shareholding pattern
Source: Company, Anand Rathi Research
Fig 47 – Key institutional holdings %
Goldman Sachs, India 3.4
Orange Mauritius Investments 1.75
Ocean Dial Gateway To India Mauritius 1.14
Credit Suisse (Singapore) 1.13
Birla Sun-Llife Trustee Co. Pvt. Ltd. 1.05
Source: Bloomberg, Anand Rathi Research
Promoters
31%
Others
53%
DII
2%
FII
14%
23. Appendix
Analyst Certification
The views expressed in this Research Report accurately reflect the personal views of the analyst(s) about the subject securities or issuers and no part of the
compensation of the research analyst(s) was, is, or will be directly or indirectly related to the specific recommendations or views expressed by the research
analyst(s) in this report. The research analysts are bound by stringent internal regulations and also legal and statutory requirements of the Securities and Exchange
Board of India (hereinafter “SEBI”) and the analysts’ compensation are completely delinked from all the other companies and/or entities of Anand Rathi, and have
no bearing whatsoever on any recommendation that they have given in the Research Report.
Anand Rathi Ratings Definitions
Analysts’ ratings and the corresponding expected returns take into account our definitions of Large Caps (>US$1bn) and Mid/Small Caps (<US$1bn) as described
in the Ratings Table below:
Ratings Guide (12 months)
Buy Hold Sell
Large Caps (>US$1bn) >15% 5-15% <5%
Mid/Small Caps (<US$1bn) >25% 5-25% <5%
Research Disclaimer and Disclosure inter-alia as required under Securities and Exchange Board of India (Research Analysts) Regulations, 2014
Anand Rathi Share and Stock Brokers Ltd. (hereinafter refer as ARSSBL) (Research Entity) is a subsidiary of Anand Rathi Financial Services Ltd. ARSSBL is a
corporate trading and clearing member of Bombay Stock Exchange Ltd, National Stock Exchange of India Ltd. (NSEIL), Multi Stock Exchange of India Ltd (MCX-
SX), United Stock Exchange and also depository participant with National Securities Depository Ltd (NSDL) and Central Depository Services Ltd. ARSSBL is
engaged in the business of Stock Broking, Depository Participant and Mutual Fund distributor.
The research analysts, strategists, or research associates principally responsible for the preparation of Anand Rathi research have received compensation based
upon various factors, including quality of research, investor client feedback, stock picking, competitive factors and firm revenues.
General Disclaimer: This Research Report (hereinafter called “Report”) is meant solely for use by the recipient and is not for circulation. This Report does not
constitute a personal recommendation or take into account the particular investment objectives, financial situations, or needs of individual clients. The
recommendations, if any, made herein are expression of views and/or opinions and should not be deemed or construed to be neither advice for the purpose of
purchase or sale of any security, derivatives or any other security through ARSSBL nor any solicitation or offering of any investment /trading opportunity on behalf
of the issuer(s) of the respective security (ies) referred to herein. These information / opinions / views are not meant to serve as a professional investment guide for
the readers. No action is solicited based upon the information provided herein. Recipients of this Report should rely on information/data arising out of their own
investigations. Readers are advised to seek independent professional advice and arrive at an informed trading/investment decision before executing any trades or
making any investments. This Report has been prepared on the basis of publicly available information, internally developed data and other sources believed by
ARSSBL to be reliable. ARSSBL or its directors, employees, affiliates or representatives do not assume any responsibility for, or warrant the accuracy,
completeness, adequacy and reliability of such information / opinions / views. While due care has been taken to ensure that the disclosures and opinions given are
fair and reasonable, none of the directors, employees, affiliates or representatives of ARSSBL shall be liable for any direct, indirect, special, incidental,
consequential, punitive or exemplary damages, including lost profits arising in any way whatsoever from the information / opinions / views contained in this Report.
The price and value of the investments referred to in this Report and the income from them may go down as well as up, and investors may realize losses on any
investments. Past performance is not a guide for future performance. ARSSBL does not provide tax advice to its clients, and all investors are strongly advised to
consult with their tax advisers regarding taxation aspects of any potential investment.
Opinions expressed are our current opinions as of the date appearing on this Research only. We do not undertake to advise you as to any change of our views
expressed in this Report. Research Report may differ between ARSSBL’s RAs and/ or ARSSBL’s associate companies on account of differences in research
methodology, personal judgment and difference in time horizons for which recommendations are made. User should keep this risk in mind and not hold ARSSBL,
its employees and associates responsible for any losses, damages of any type whatsoever.