1. Anand Rathi Share and Stock Brokers Limited (hereinafter “ARSSBL”) is a full-service brokerage and equities-research firm and the views expressed therein are solely of
ARSSBL and not of the companies which have been covered in the Research Report. This report is intended for the sole use of the Recipient. Disclosures and analyst
certifications are present in the Appendix.
Anand Rathi Research India Equities
Technology
Company Update
India I Equities
Key financials (YE Mar) FY15 FY16 FY17 FY18e FY19e
Sales (` m) 29,899 32,243 33,234 34,983 37,166
Net profit (` m) 2,370 2,815 2,386 2,397 2,875
EPS (`) 12.0 14.3 12.1 12.1 14.4
Growth (%) -4.8 18.8 -15.2 0.5 19.9
PE (x) 11.0 9.3 10.9 10.9 9.1
PBV (x) 2.0 1.9 1.6 1.5 1.3
RoE (%) 18.4 21.0 16.1 14.4 15.5
RoCE (%) 15.9 22.9 18.5 17.8 20.5
Dividend yield (%) 0.9 1.7 1.7 2.4 2.8
Net debt/equity (x) 0.0 -0.1 -0.1 -0.1 -0.2
Source: Company, Anand Rathi Research
Mohit Jain
Research Analyst
+9122 6626 6531
mohitjain@rathi.com
Shobit Singhal
Research Associate
+9122 6626 6511
shobitsinghal@rathi.com
`
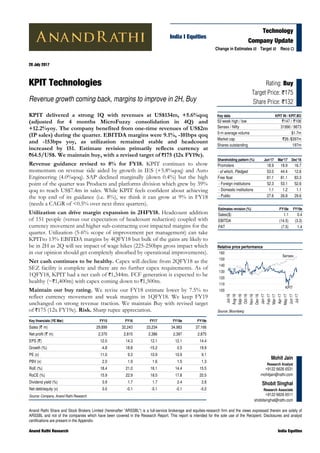
Rating: Buy
Target Price: `175
Share Price: `132
Key data KPIT IN / KPIT.BO
52-week high / low `147 / `106
Sensex / Nifty 31990 / 9873
3-m average volume $1.7m
Market cap `26 /$397m
Shares outstanding 197m
Shareholding pattern (%) Jun'17 Mar'17 Dec'16
Promoters 18.9 18.9 16.7
- of which, Pledged 53.0 44.4 12.6
Free float 81.1 81.1 83.3
- Foreign institutions 52.3 53.1 52.6
- Domestic institutions 1.1 1.2 1.1
- Public 27.6 26.8 29.6
Change in Estimates Target Reco
20 July 2017
KPIT Technologies
Revenue growth coming back, margins to improve in 2H, Buy
KPIT delivered a strong 1Q with revenues at US$134m, +5.6%qoq
(adjusted for 4 months MicroFuzzy consolidation in 4Q) and
+12.2%yoy. The company benefited from one-time revenues of US$2m
(IP sales) during the quarter. EBITDA margins were 9.1%, -101bps qoq
and -153bps yoy, as utilization remained stable and headcount
increased by 151. Estimate revision primarily reflects currency at
`64.5/US$. We maintain buy, with a revised target of `175 (12x FY19e).
Revenue guidance revised to 8% for FY18. KPIT continues to show
momentum on revenue side aided by growth in IES (+5.8%qoq) and Auto
Engineering (4.0%qoq). SAP declined marginally (down 0.4%) but the high
point of the quarter was Products and platforms division which grew by 39%
qoq to reach US$7.4m in sales. While KPIT feels confident about achieving
the top end of its guidance (i.e. 8%), we think it can grow at 9% in FY18
(needs a CAGR of <0.5% over next three quarters).
Utilization can drive margin expansion in 2HFY18. Headcount addition
of 151 people (versus our expectation of headcount reduction) coupled with
currency movement and higher sub-contracting cost impacted margins for the
quarter. Utilization (5-6% scope of improvement per management) can take
KPITto 13% EBITDA margins by 4QFY18 but bulk of the gains are likely to
be in 2H as 2Q will see impact of wage hikes (225-250bps gross impact which
in our opinion should get completely absorbed by operational improvements).
Net cash continues to be healthy. Capex will decline from 2QFY18 as the
SEZ facility is complete and there are no further capex requirements. As of
1QFY18, KPIT had a net cash of `1,344m. FCF generation is expected to be
healthy (~`1,400m) with capex coming down to `1,500m.
Maintain our buy rating. We revise our FY18 estimate lower by 7.5% to
reflect currency movement and weak margins in 1QFY18. We keep FY19
unchanged on strong revenue traction. We maintain Buy with revised target
of `175 (12x FY19e). Risk. Sharp rupee appreciation.
Relative price performance
Source: Bloomberg
KPIT
Sensex
100
110
120
130
140
150
160
Jul-16
Aug-16
Sep-16
Oct-16
Nov-16
Dec-16
Jan-17
Feb-17
Mar-17
Apr-17
May-17
Jun-17
Jul-17
Estimates revision (%) FY18e FY19e
Sales($) 1.1 0.4
EBITDA (14.5) (3.3)
PAT (7.5) 1.4
4. 20 July 2017 KPIT Technologies – Revenue growth coming back, margins to improve in 2H, Buy
Anand Rathi Research 4
Conference Call Takeaways
Company
Sub contractor cost (appears in other expenses) amounted to
`1.13bn in this quarter. Company expects this to return back to
normal levels of `1bn in coming quarters.
Company will be able to generate better cashflow in FY18 due to
reduction in capex, as large part of this has been done in FY17.
Currency has impacted the margins by 150bps in this quarter.
Traditional IT business is expected to decline, while growth is
expected from Digital (ERP and Non ERP customers), IOT and
Engineering.
Company has identified strategically top 20 clients as growth or
structured accounts. Pipeline from these accounts remains to be
healthy.
Out of the top 20 clients, automotive vertical accounts for 55%,
manufacturing accounts for 30-35% and the energy & utilities
accounts for balance.
Company is making continued efforts to correct employee pyramid
structure.
There will be marginal growth in headcount addition in FY18,
though addition will be much lower than the overall growth they are
targeting.
Company is going to soft launch new products like Revolo and K
Bike by end of this calendar year. Revolo is making good progress
and expect some buses to hit in the market using this technology in
Q3 & Q4FY18.
Business Outlook
Company has revised its revenue guidance to higher end of earlier
guidance of 6-8% largely driven by IES, Engineering and digital.
Utilization can be improved dramatically and the company believes it
can go back up to ~+75%.
Notes from the last two quarters’ conference calls
From Q4FY17
Revenue growth in FY18 is expected to be 6-8% on constant
currency basis. Out of that 2-3% will come from MicroFuzzy and the
remaining will be organic
Margins are likely to be better than FY17, despite rupee appreciation,
due to improved utilization and better revenue mix.
From Q3FY17
From FY18, the company will re-start providing revenue and margin
outlook for the year.
Margins can still trend back to 16% (management target) by Q4
FY18.
5. 20 July 2017 KPIT Technologies – Revenue growth coming back, margins to improve in 2H, Buy
Anand Rathi Research 5
Factsheet
Fig 9 – Revenue split
(%) Q1FY17 Q2FY17 Q3FY17 Q4FY17 Q1FY18
Automotive 39 41 39 41 41
Manufacturing 37 35 37 34 32
Energy and Utilities 16 14 14 14 18
Others 8 10 9 11 10
Source: Company
Fig 10 – Revenue-split, by services
(%) Q1FY17 Q2FY17 Q3FY17 Q4FY17 Q1FY18
Integrated Enterprise Solutions 31 30 30 28 28
Product Engineering Services 34 33 32 35 35
SAP 24 23 23 23 22
Products & Platforms 2 5 4 4 6
BTU/Digital Transformation 9 10 11 10 10
Source: Company
Fig 11 – Revenue-split, by region
(%) Q1FY17 Q2FY17 Q3FY17 Q4FY17 Q1FY18
North America 67 67 70 68 64
Europe 18 16 14 17 19
APAC/RoW 14 17 15 16 17
Source: Company
Fig 12 – Client profiles (LTM)
(%) Q1FY17 Q2FY17 Q3FY17 Q4FY17 Q1FY18
Top 1 13 13 13 12 12
Top 5 28 28 27 27 NA
Top 10 40 39 36 38 NA
Active Clients 220 223 225 228 230
Revenue per active client ($m / quart) 1 1 1 1 1
Source: Company, Notes: Company has stopped disclosing Top5 -10 clients instead they now disclosed Top 20-40 clients.
Fig 13 – Workforce
(%) Q1FY17 Q2FY17 Q3FY17 Q4FY17 Q1FY18
Employee Movement
Employees (EoP) 11,288 11,666 11,881 12,110 12,261
Gross Addition (est.) 891 909 760 784 715
Attrition (est.) 513 531 545 555 564
Net Addition 378 378 215 229 151
Attrition % - QA 19 19 19 19 19
Utilization % (onsite) 89 90 89 89 89
Utilization % (cum trainees) 72 72 71 72 72
Source: Company
6. 20 July 2017 KPIT Technologies – Revenue growth coming back, margins to improve in 2H, Buy
Anand Rathi Research 6
Fig 14 – Revenue-split, by delivery type and billing (%)
(%) Q1FY17 Q2FY17 Q3FY17 Q4FY17 Q1FY18
Delivery type
On-site 59 56 57 56 53
Offshore 41 43 42 43 44
Billing Type
T&M 71 71 66 63 62
FP 29 28 34 36 35
Source: Company
Fig 14 – Key area and horizontals growth (%)
(%) Q1FY17 Q2FY17 Q3FY17 Q4FY17 Q1FY18
Verticals growth (yoy)
Automotive 5 8 9 -1 19
Manufacturing 6 3 1 (0) (5)
Energy & Utilities (13) (33) (30) (20) 23
Others (6) 22 30 53 40
Horizontals growth (qoq)
Integrated Enterprise Solutions (18) (11) (5) (19) (0)
Product Engineering Services 25 4 1 10 17
SAP 15 3 (10) 4 1
BTU/Digital Transformation (12) 2 25 30 27
Key area-wise growth (yoy)
North America (2) (1) 0 1 6
Europe 11 (12) (18) (23) (4)
Source: Company
7. 20 July 2017 KPIT Technologies – Revenue growth coming back, margins to improve in 2H, Buy
Anand Rathi Research 7
Valuations
The stock trades at 9.2x FY19e EPS of `14.4, which we find attractive
given that the company is now, after a gap of two years, looking to grow at
industry levels, and operating parameters suggest plenty of headroom for
margin expansion. Besides, capex is expected to go down and the balance
sheet to improve with rising FCF.
We believe that KPIT should trade at 12x FY19e earnings, a 25%discount
to our target multiple for Mindtree due to its volatile performance, weaker
cash generation, and lack of growth in the last two years.
We expect it to start growing in FY18 (organically), in line with the industry
and management guidance of 8%. We also expect it to improve margins to
13%, primarily on improving utilisation.
For growth, KPIT continues to rely on Auto Engineering and products/
platforms segment, both of which are expected to grow in double digits in
FY18.
Fig 16 – Change in estimates
FY18 FY19
New Old Chg % New Old Chg %
Revenues ($m) 540 534 1.1 574 572 0.4
Revenues (`m) 34,983 35,532 (1.5) 37,166 38,028 (2.3)
EBITDA (`m) 3,745 4,382 (14.5) 4,725 4,885 (3.3)
EBITDA margin % 10.7 12.3 -163 bps 12.7 12.8 -13 bps
EBIT (`m) 2,974 3,378 (12.0) 3,749 3,764 (0.4)
EBIT margin % 8.5 9.5 -101 bps 10.1 9.9 19 bps
PBT 3,189 3,475 (8.2) 3,873 3,851 0.6
Net profit 2,397 2,591 (7.5) 2,875 2,836 1.4
Source: Anand Rathi Research
Fig 17 – PE band
Source: Bloomberg, Anand Rathi Research
Risks
Sharp rupee appreciation.
0
2
4
6
8
10
12
14
16
18
Apr-13
Jul-13
Oct-13
Jan-14
Apr-14
Jul-14
Oct-14
Jan-15
Apr-15
Jul-15
Oct-15
Jan-16
Apr-16
Jul-16
Oct-16
Jan-17
Apr-17
Jul-17
8. Appendix
Analyst Certification
The views expressed in this Research Report accurately reflect the personal views of the analyst(s) about the subject securities or issuers and no part of the
compensation of the research analyst(s) was, is, or will be directly or indirectly related to the specific recommendations or views expressed by the research
analyst(s) in this report. The research analysts are bound by stringent internal regulations and also legal and statutory requirements of the Securities and Exchange
Board of India (hereinafter “SEBI”) and the analysts’ compensation are completely delinked from all the other companies and/or entities of Anand Rathi, and have
no bearing whatsoever on any recommendation that they have given in the Research Report.
Important Disclosures on subject companies
Rating and Target Price History (as of 19 July 2017)
Date Rating
TP
(`)
Share
Price (`)
1 11-Feb-14 Buy 200 163
2 01-Apr-14 Hold 188 164
3 04-Jun-14 Hold 180 162
4 24-Jul-14 Sell 155 155
5 01-Oct-14 Sell 170 160
6 27-Oct-14 Sell 180 168
7 05-Jan-15 Sell 195 215
8 09-Apr-15 Hold 210 191
9 30-Apr-15 Buy 140 110
10 23-Oct-15 Buy 190 136
11 01-Jul-16 Hold 170 185
12 12-Oct-16 Hold 160 131
13 06-Jan-17 Hold 155 135
14 28-Apr-17 Buy 160 128
Anand Rathi Ratings Definitions
Analysts’ ratings and the corresponding expected returns take into account our definitions of Large Caps (>US$1bn) and Mid/Small Caps (<US$1bn) as described
in the Ratings Table below:
Ratings Guide (12 months)
Buy Hold Sell
Large Caps (>US$1bn) >15% 5-15% <5%
Mid/Small Caps (<US$1bn) >25% 5-25% <5%
Research Disclaimer and Disclosure inter-alia as required under Securities and Exchange Board of India (Research Analysts) Regulations, 2014
Anand Rathi Share and Stock Brokers Ltd. (hereinafter refer as ARSSBL) (Research Entity) is a subsidiary of Anand Rathi Financial Services Ltd. ARSSBL is a
corporate trading and clearing member of Bombay Stock Exchange Ltd, National Stock Exchange of India Ltd. (NSEIL), Multi Stock Exchange of India Ltd (MCX-
SX), United Stock Exchange and also depository participant with National Securities Depository Ltd (NSDL) and Central Depository Services Ltd. ARSSBL is
engaged in the business of Stock Broking, Depository Participant and Mutual Fund distributor.
The research analysts, strategists, or research associates principally responsible for the preparation of Anand Rathi research have received compensation based
upon various factors, including quality of research, investor client feedback, stock picking, competitive factors and firm revenues.
General Disclaimer: This Research Report (hereinafter called “Report”) is meant solely for use by the recipient and is not for circulation. This Report does not
constitute a personal recommendation or take into account the particular investment objectives, financial situations, or needs of individual clients. The
recommendations, if any, made herein are expression of views and/or opinions and should not be deemed or construed to be neither advice for the purpose of
purchase or sale of any security, derivatives or any other security through ARSSBL nor any solicitation or offering of any investment /trading opportunity on behalf
of the issuer(s) of the respective security (ies) referred to herein. These information / opinions / views are not meant to serve as a professional investment guide for
the readers. No action is solicited based upon the information provided herein. Recipients of this Report should rely on information/data arising out of their own
investigations. Readers are advised to seek independent professional advice and arrive at an informed trading/investment decision before executing any trades or
making any investments. This Report has been prepared on the basis of publicly available information, internally developed data and other sources believed by
ARSSBL to be reliable. ARSSBL or its directors, employees, affiliates or representatives do not assume any responsibility for, or warrant the accuracy,
completeness, adequacy and reliability of such information / opinions / views. While due care has been taken to ensure that the disclosures and opinions given are
fair and reasonable, none of the directors, employees, affiliates or representatives of ARSSBL shall be liable for any direct, indirect, special, incidental,
consequential, punitive or exemplary damages, including lost profits arising in any way whatsoever from the information / opinions / views contained in this Report.
The price and value of the investments referred to in this Report and the income from them may go down as well as up, and investors may realize losses on any
investments. Past performance is not a guide for future performance. ARSSBL does not provide tax advice to its clients, and all investors are strongly advised to
consult with their tax advisers regarding taxation aspects of any potential investment.
Opinions expressed are our current opinions as of the date appearing on this Research only. We do not undertake to advise you as to any change of our views
expressed in this Report. Research Report may differ between ARSSBL’s RAs and/ or ARSSBL’s associate companies on account of differences in research
methodology, personal judgment and difference in time horizons for which recommendations are made. User should keep this risk in mind and not hold ARSSBL,
its employees and associates responsible for any losses, damages of any type whatsoever.
KPIT
14
1 2 3
4
56
7
8
9
10
11
12
13
80
100
120
140
160
180
200
220
240
Jan-14
Mar-14
May-14
Jul-14
Sep-14
Nov-14
Jan-15
Mar-15
May-15
Jul-15
Sep-15
Nov-15
Jan-16
Mar-16
May-16
Jul-16
Sep-16
Nov-16
Jan-17
Mar-17
May-17
Jul-17