

Recommended
Recommended
More Related Content
What's hot
What's hot (19)
Similar to Research report first source solution
Similar to Research report first source solution (20)
Recently uploaded
Recently uploaded (20)
Research report first source solution
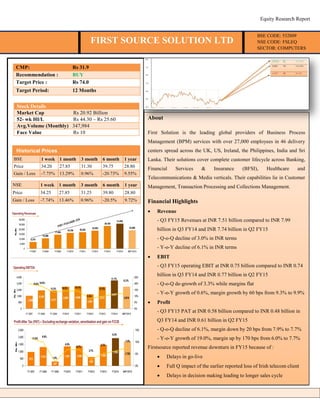
- 1. Equity Research Report CMP: Rs 31.9 Recommendation : BUY Target Price : Rs 74.0 Target Period: 12 Months Stock Details Market Cap Rs 20.92 Billion 52- wk HI/L Rs 44.30 – Rs 25.60 Avg.Volume (Monthly) 347,984 Face Value Rs 10 BSE 1 week 1 month 3 month 6 month 1 year Price 34.20 27.85 31.30 39.75 28.80 Gain / Loss -7.75% 13.29% 0.96% -20.73% 9.55% NSE 1 week 1 month 3 month 6 month 1 year Price 34.25 27.85 31.25 39.80 28.80 Gain / Loss -7.74% 13.46% 0.96% -20.5% 9.72% About First Solution is the leading global providers of Business Process Management (BPM) services with over 27,000 employees in 46 delivery centers spread across the UK, US, Ireland, the Philippines, India and Sri Lanka. Their solutions cover complete customer lifecycle across Banking, Financial Services & Insurance (BFSI), Healthcare and Telecommunications & Media verticals. Their capabilities lie in Customer Management, Transaction Processing and Collections Management. Financial Highlights Revenue - Q3 FY15 Revenues at INR 7.51 billion compared to INR 7.99 billion in Q3 FY14 and INR 7.74 billion in Q2 FY15 - Q-o-Q decline of 3.0% in INR terms - Y-o-Y decline of 6.1% in INR terms EBIT - Q3 FY15 operating EBIT at INR 0.75 billion compared to INR 0.74 billion in Q3 FY14 and INR 0.77 billion in Q2 FY15 - Q-o-Q de-growth of 3.3% while margins flat - Y-o-Y growth of 0.6%, margin growth by 60 bps from 9.3% to 9.9% Profit - Q3 FY15 PAT at INR 0.58 billion compared to INR 0.48 billion in Q3 FY14 and INR 0.61 billion in Q2 FY15 - Q-o-Q decline of 6.1%, margin down by 20 bps from 7.9% to 7.7% - Y-o-Y growth of 19.0%, margin up by 170 bps from 6.0% to 7.7% Firstsource reported revenue downturn in FY15 because of : Delays in go-live Full Q impact of the earlier reported loss of Irish telecom client Delays in decision making leading to longer sales cycle FIRST SOURCE SOLUTION LTD Historical Prices BSE CODE: 532809 NSE CODE: FSLEQ SECTOR: COMPUTERS
- 2. Equity Research Report Ratio Analysis Mar '14 Mar '13 Mar '12 Investment Valuation Ratios Face Value 10.00 10.00 10.00 Operating Profit Per Share (Rs) 2.88 2.06 2.36 Net Operating Profit Per Share (Rs) 13.90 13.39 17.51 Profitability Ratios Operating Profit Margin(%) 20.67 15.35 13.50 PBIT(%) 14.68 7.97 5.23 Gross Profit Margin(%) 14.93 8.81 5.56 Cash Profit Margin(%) 20.07 17.98 6.44 Adjusted Cash Margin(%) 20.07 17.98 6.44 Net Profit Margin(%) 14.41 13.96 5.65 Adjusted Net Profit Margin(%) 14.41 13.96 5.65 Return On Capital Employed(%) 9.70 12.65 9.74 Return On Net Worth(%) 9.74 11.03 5.15 Adjusted Return on Net Worth(%) 9.74 9.52 -0.92 ROA Excluding Revaluations 20.92 18.74 20.43 ROA Including Revaluations 20.92 18.74 20.43 Return on Long Term Funds(%) 10.13 12.65 10.14 Liquidity And Solvency Ratios Current Ratio 1.53 1.29 0.69 Quick Ratio 2.34 1.14 0.68 Debt Equity Ratio 0.14 0.09 0.05 Long Term Debt Equity Ratio 0.09 0.09 0.01 Debt Coverage Ratios Interest Cover 8.59 3.22 1.40 Total Debt to Owners Fund 0.14 0.09 0.05 Financial Charges Coverage Ratio 11.56 4.32 1.47 Management Efficiency Ratios Debtors Turnover Ratio 6.85 7.40 4.89 Asset Turnover Ratio 0.63 0.78 0.47 No.of Days In Working Capital 58.9 -22.1 -217.5 Cash Flow Indicator Ratios AdjustedCash Flow Times 1.00 0.64 0.91 Earnings Per Share 2.04 2.07 1.05 Book Value 20.92 18.74 20.43 Financial Performance Firstsource’s revenue growth should start improving from Mar’15 quarter onwards led by ramp ups on the large deals won in recent quarters (note that Firstsource has won net new deals worth ACV of US$ 61 million during 9m FY15). Besides seasonal strength of company’s collection business (~10% of revenues) will aid revenue growth rates in Mar’15 quarter. We marginally cut FY16/17 EPS estimate by ~2/3% respective to Rs 4.5/51 respectively as we accommodate Dec’14 quarter performance. We believe that current valuation at 6.9x/6.2x FY16/17E P/E respectively largely captures revenue disappointment in 9mFY15 and limits downside Firstsource did lose quite a few key clients in the last two quarters. They are expecting to comeback within that segment again. They have diversified and de-risked themselves by not going for too many big clients. In fact what they trying to do is their top five clients have been substituted by another 7-8 smaller ones. That is a good strategy. It constantly helps these smaller players. The kind of capital that they can deploy to expand their footprint especially in the US, they could do well getting into newer verticals. Currently Firstsource is an undervalued stock. Recently Firstsource Solutions Ltd has informed BSE that CARE Ratings has upgraded its Long Term rating of the Company to ''CARE A'' from ''CARE A-''. The rating on the Company''s short-term bank facilities has also been upgraded to ''CARE A1'' from ''CARE A2+''. Management expects growth to revive form Mar’15 quarter aided by ramp-ups of deals won in recent quarters as well as seasonality in collection business; deal pipeline stays strong amid healthy demand environment FIRST SOURCE SOLUTION LTD
- 3. Equity Research Report Source of Funds Mar’14 Mar’13 Total Share Capital 659.74 657.67 Equity Share Capital 659.74 657.67 Reserves 720.46 574.82 Networth 1,380.27 1,232.49 Secured Loans 186.9 110.69 Unsecured Loans 1 2.08 Total Debt 187.9 112.77 Total Liabilities 1,568.17 1,345.26 Application Of Funds Mar’14 Mar’13 Gross Block 403.58 419.07 Less: Accum. Depreciation 317.98 322.65 Net Block 85.6 96.42 Capital Work in Progress 0.05 1.76 Investments 1,173.13 1,168.61 Inventories 0 0 Sundry Debtors 185.24 82.72 Cash and Bank Balance 28.78 25.33 Total Current Assets 214.02 108.05 Loans and Advances 296.35 245.57 Fixed Deposits 0 0 Total CA, Loans & Advances 510.37 353.62 Current Liabilities 190.56 260.59 Provisions 10.42 14.55 Total CL & Provisions 200.98 275.14 Net Current Assets 309.39 78.48 Total Assets 1,568.17 1,345.27 Contingent Liabilities 1,785.55 1,479.66 Book Value (Rs) 20.92 18.74 Name Last Price Market Cap.(Rs) Sales(Cr) Net Profit Total Assets Vakrangee 116.15 5,847.95 1,965.39 199 1,197.57 eClerx 1,580.00 4,795.44 713.38 246.51 538.41 KPIT Tech 160.4 3,156.15 890.09 149.16 1,421.77 Sonata 162.55 1,709.36 333.7 53.84 325.01 Accelya Kale 1,048.00 1,564.27 283.21 89.59 80.32 Take Solutions 122.25 1,496.34 26.02 17.11 320.07 R Systems Intl 86 1,096.14 294.92 75.03 188.5 Cigniti Tech 434.85 1,075.78 55.63 8.04 94.24 OnMobile Global 80.75 922.94 473.34 -37.32 795.7 FIRST SOURCE SOLUTION LTD Technical OutlookBalance Sheet (INR Crores) Firstsource Solutions Ltd 12 month Stock Performance Firstsource Solutions Ltd Performance Against Sensex Peer Analysis